In our last week’s template round-up, we shared templates which were made specifically for researchers, engineers, entrepreneurs and project planners giving them the tools needed to succeed in their respective industries.
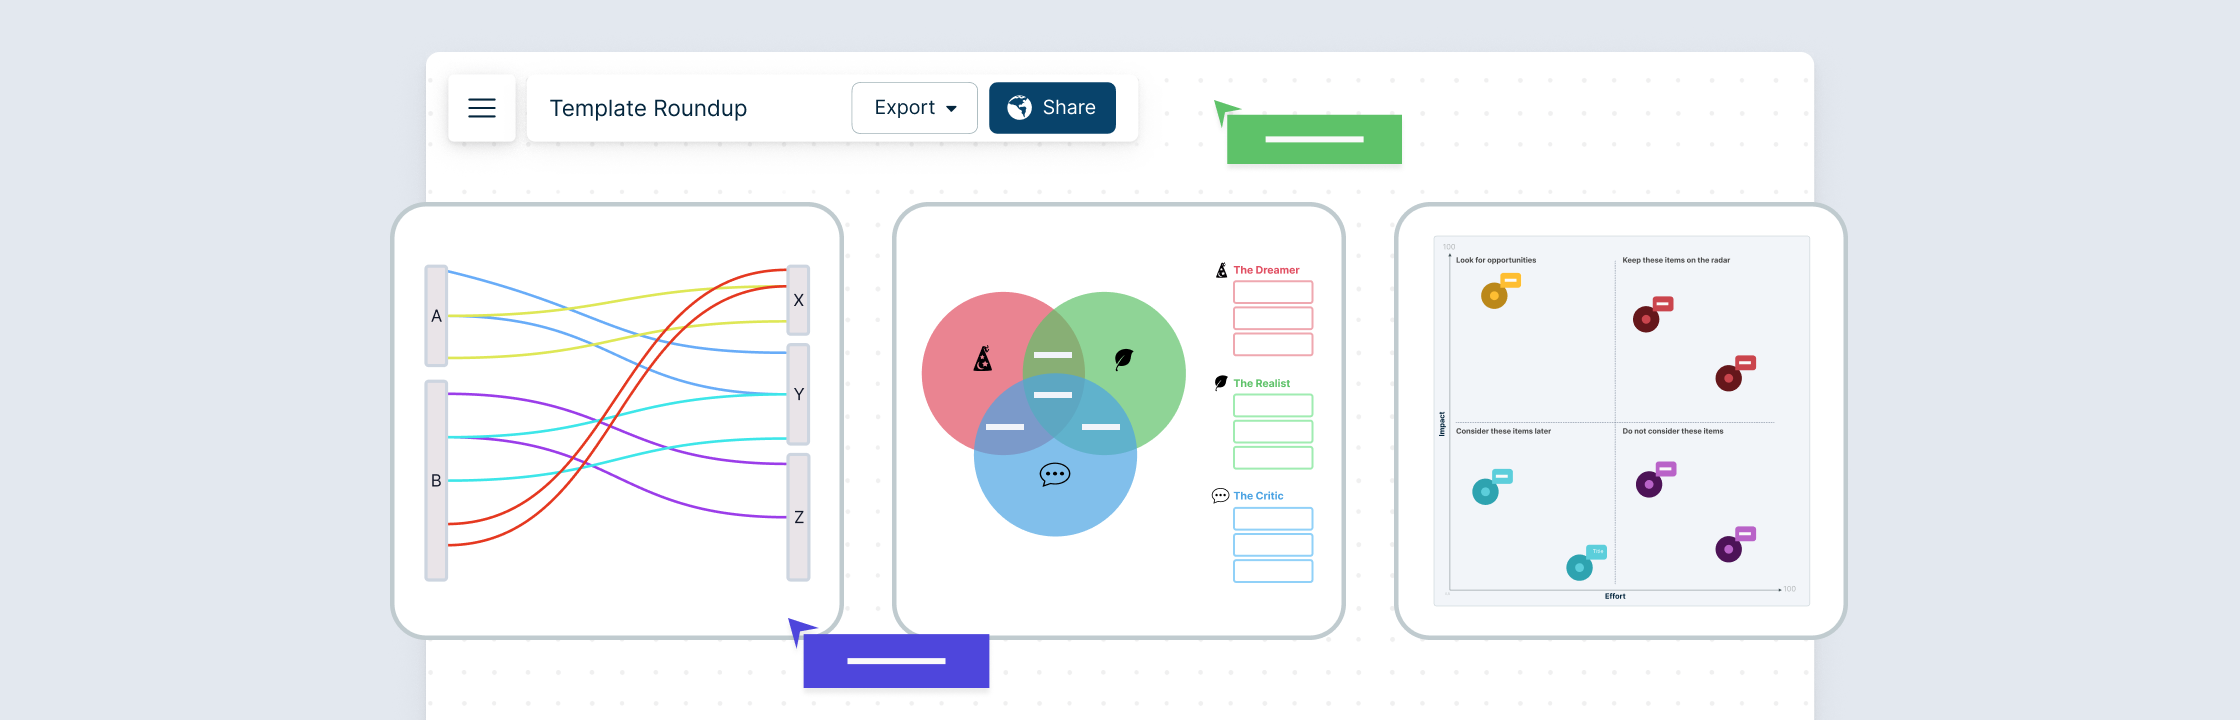
This week, we are excited to introduce five new templates tailored for professionals in marketing, content creation, project management, UX design, and data analysis.
Discover an extensive collection of templates in our diagram community, covering a wide range of organizational use cases and examples for over 80 distinct diagram categories.
This week’s templates include
- Disney Creative Strategy Template
- Parking Lot Matrix
- Idea Funnel Backlog
- E-commerce website user flow
- Sankey Diagram
Disney Creative Strategy Template
The Disney creative strategy template is a framework used by marketing, advertising, and content creation to generate and refine ideas from the perspectives of the Dreamer, Realist, and Critic. This approach helps in developing well-rounded concepts and narratives that are both imaginative and practical.
Here’s how to use the Disney Creative Strategy template focusing on the Dreamer, Realist, and Critic perspectives:
- Dreamer: Start by embracing the Dreamer’s perspective. Let your imagination soar and brainstorm ideas without any limitations. Think big and ask yourself, “What if anything were possible?” Capture all the creative and innovative ideas that come to mind.
- Realist: Transition to the Realist’s perspective. Evaluate the feasibility and practicality of the ideas generated. Consider factors such as available resources, budget constraints, and timelines. Identify the ideas that align with the project’s constraints and have the potential for implementation.
- Critic: Adopt the Critic’s perspective to analyze and refine the selected ideas. Identify potential flaws, weaknesses, or areas that need improvement. Challenge the ideas from different angles and seek to enhance their impact and effectiveness. This critical evaluation will help you refine and strengthen the chosen concepts.
By incorporating the Dreamer, Realist, and Critic perspectives, professionals can leverage the Disney Creative Strategy template to foster creativity, assess feasibility, and refine ideas for marketing campaigns, advertising initiatives, and content creation projects. It allows for a comprehensive exploration of ideas, ensuring a balance between imagination and practicality.
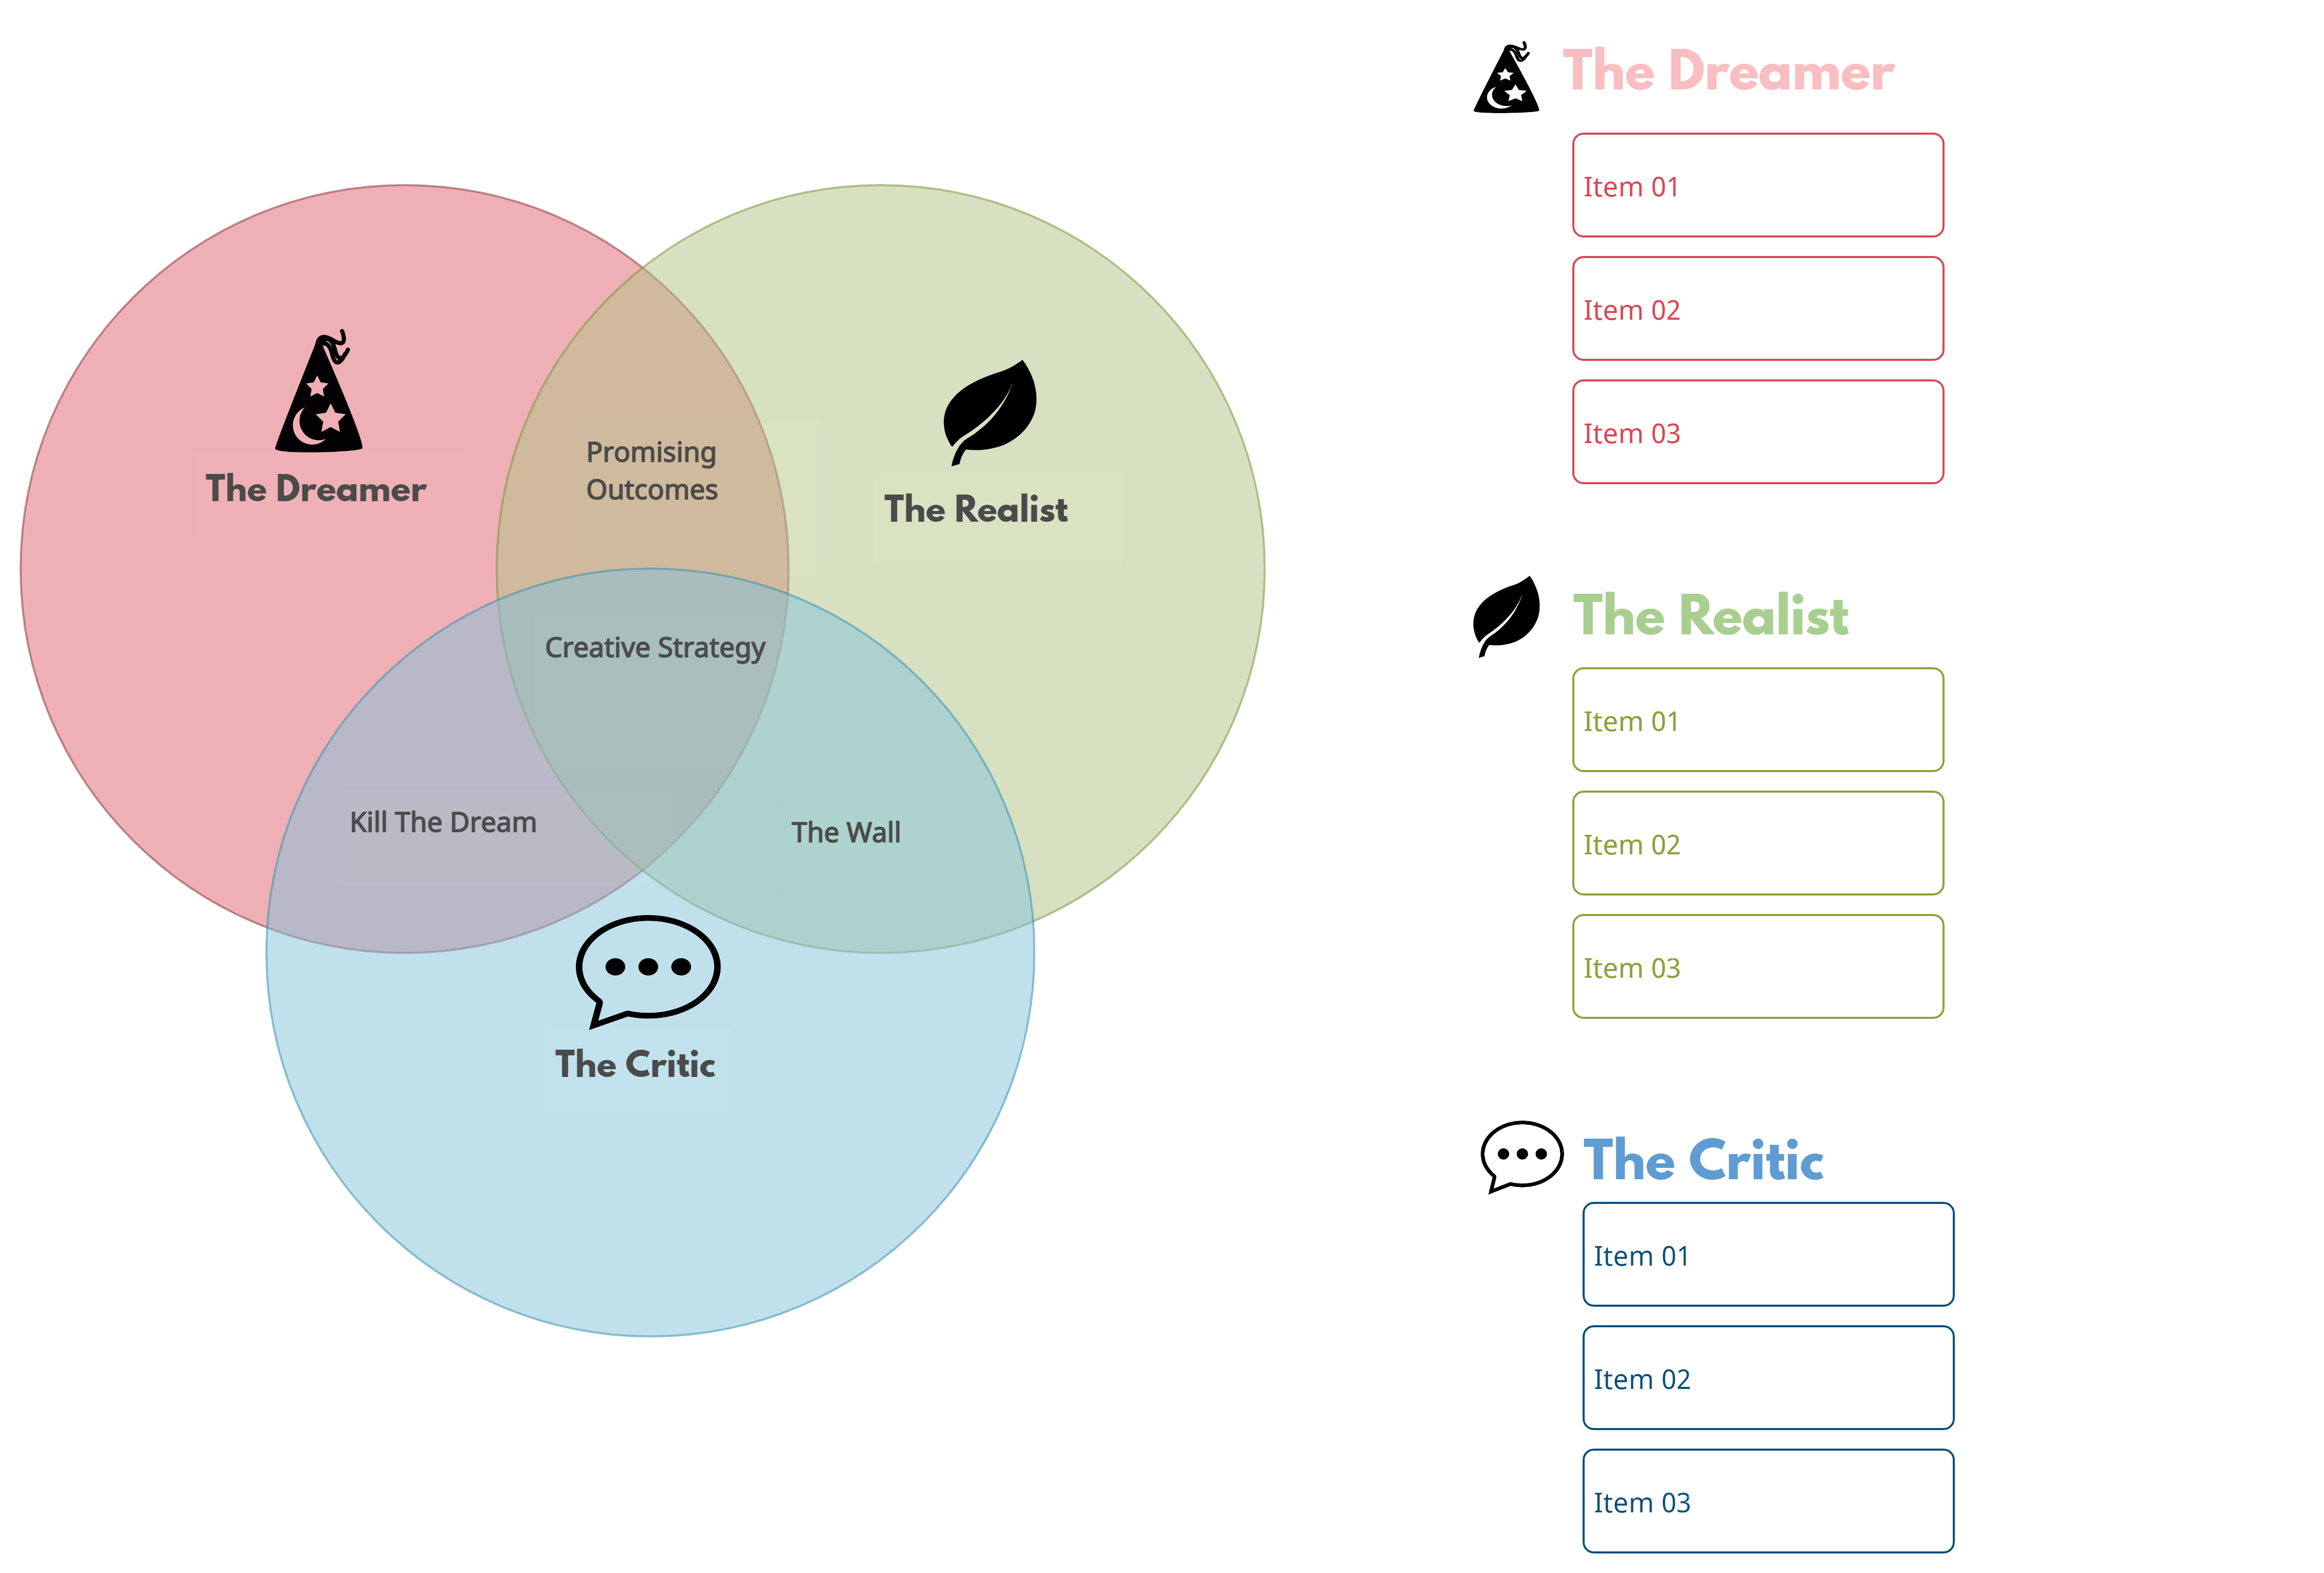
Click on the image to edit Disney Creative Strategy
Parking Lot Matrix
The parking lot matrix is a widely used tool employed by project managers, team leaders, and facilitators to effectively manage and address ideas, issues, and topics that arise during meetings or discussions but require further attention later on.
Here’s how to use the parking lot matrix template:
- During a meeting or discussion, create a designated section on a whiteboard, flipchart, or digital platform labeled as the “Parking Lot Matrix.”
- Whenever an idea, concern, or topic arises that is not directly related to the current agenda or cannot be fully discussed at that moment, write it down in the Parking Lot section. This ensures that no valuable input is lost or forgotten.
- Categorize the items in the parking lot matrix based on their nature or relevance. For example, you can use labels like “Ideas for Future Discussion,” “Questions Requiring Research,” or “Issues to Address in Next Meeting.”
- After the meeting or discussion, allocate time specifically designated for reviewing the items in the parking lot matrix. This allows for dedicated attention to each item and ensures that they are properly addressed in due course.
- Prioritize the items in the parking lot matrix based on their importance or urgency. Determine which items need immediate action or discussion and which can be deferred to future meetings or tasks.
By using the parking lot matrix template, professionals can effectively manage and track ideas, concerns, and topics that emerge during discussions, ensuring that they are not forgotten and can be addressed at the appropriate time. It promotes a structured and organized approach to managing meeting outcomes and enables more productive and focused discussions.
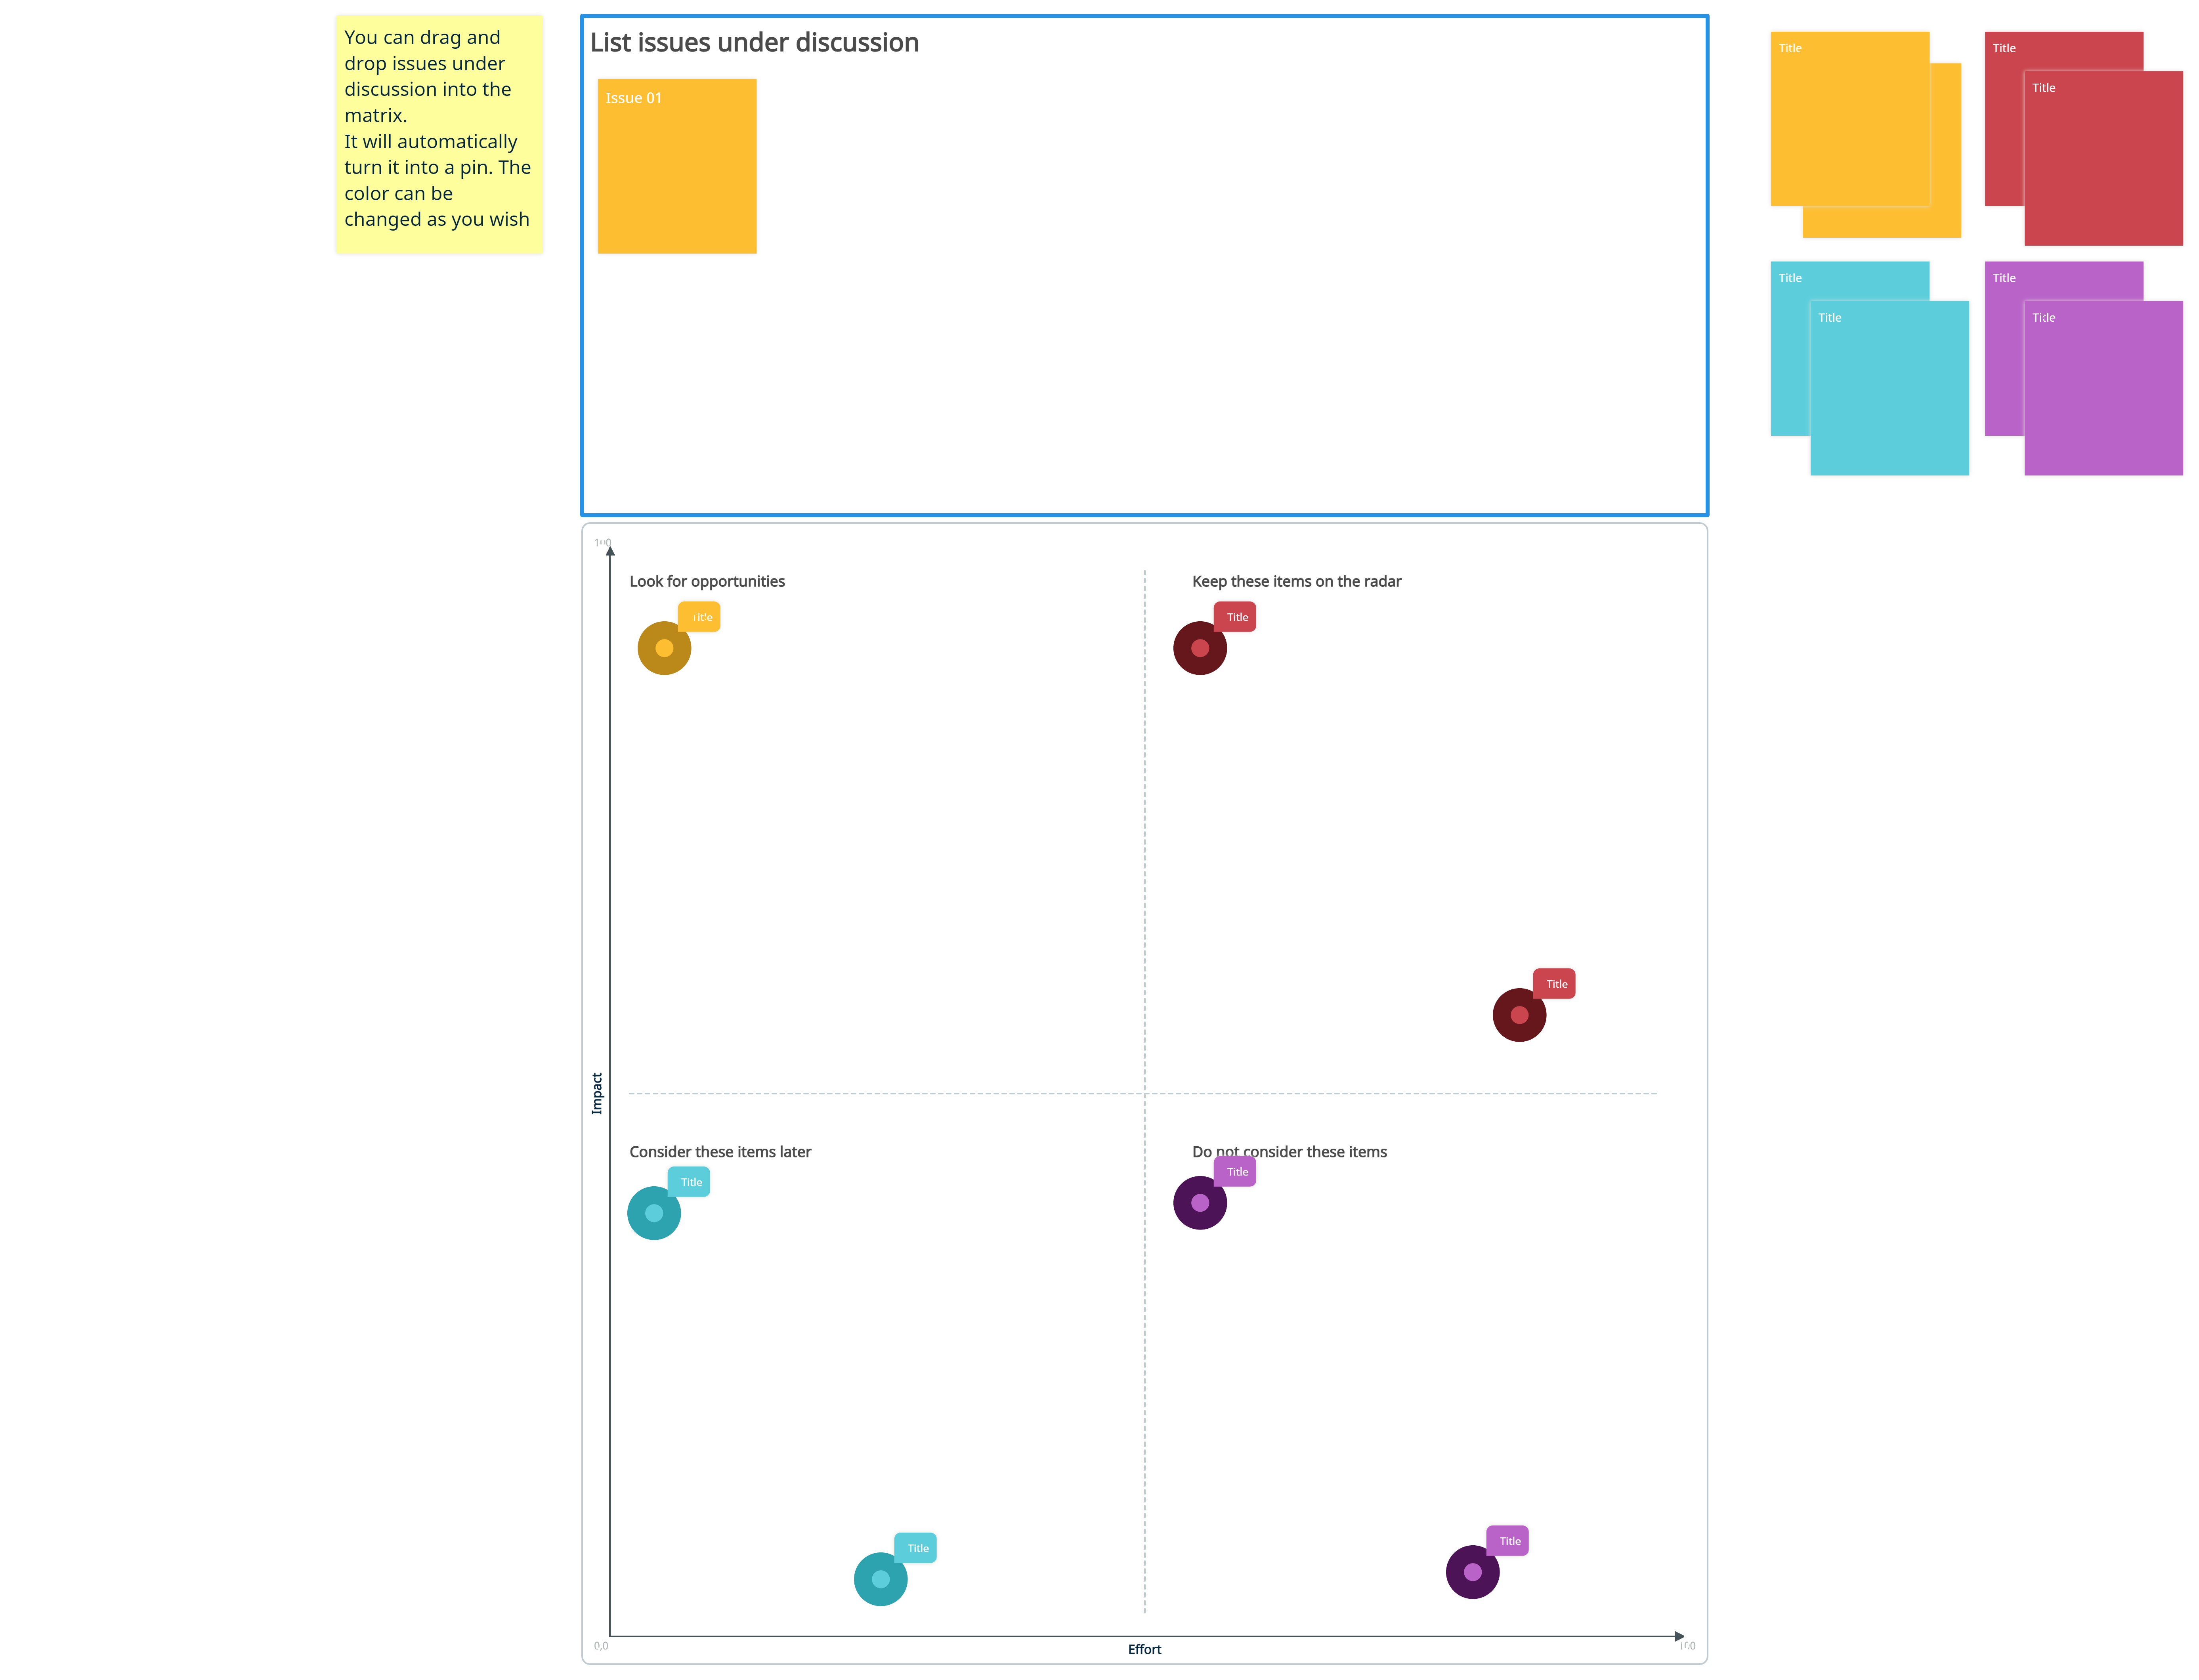
Click on the image to edit the Parking lot matrix
Idea Funnel Backlog
The idea funnel backlog is a tool commonly used by product managers, innovation teams, and entrepreneurs to manage and prioritize a backlog of ideas and feature requests. It enables effective idea management and ensures that the most valuable concepts are implemented.
Here’s how to use it:
- Gather ideas from various sources, such as brainstorming sessions, customer feedback, or team discussions.
- Create a centralized space, either physical or digital, to capture and store these ideas.
- Evaluate the ideas based on criteria such as feasibility, potential impact, and alignment with project goals.
- Prioritize the ideas by considering factors like market demand, available resources, and strategic importance.
- Track the progress and status of each idea within the idea funnel backlog.
- Once an idea is approved for implementation, transfer it to a separate project management or development tool for execution.
The idea funnel backlog streamlines the decision-making process and supports innovation within projects and organizations.
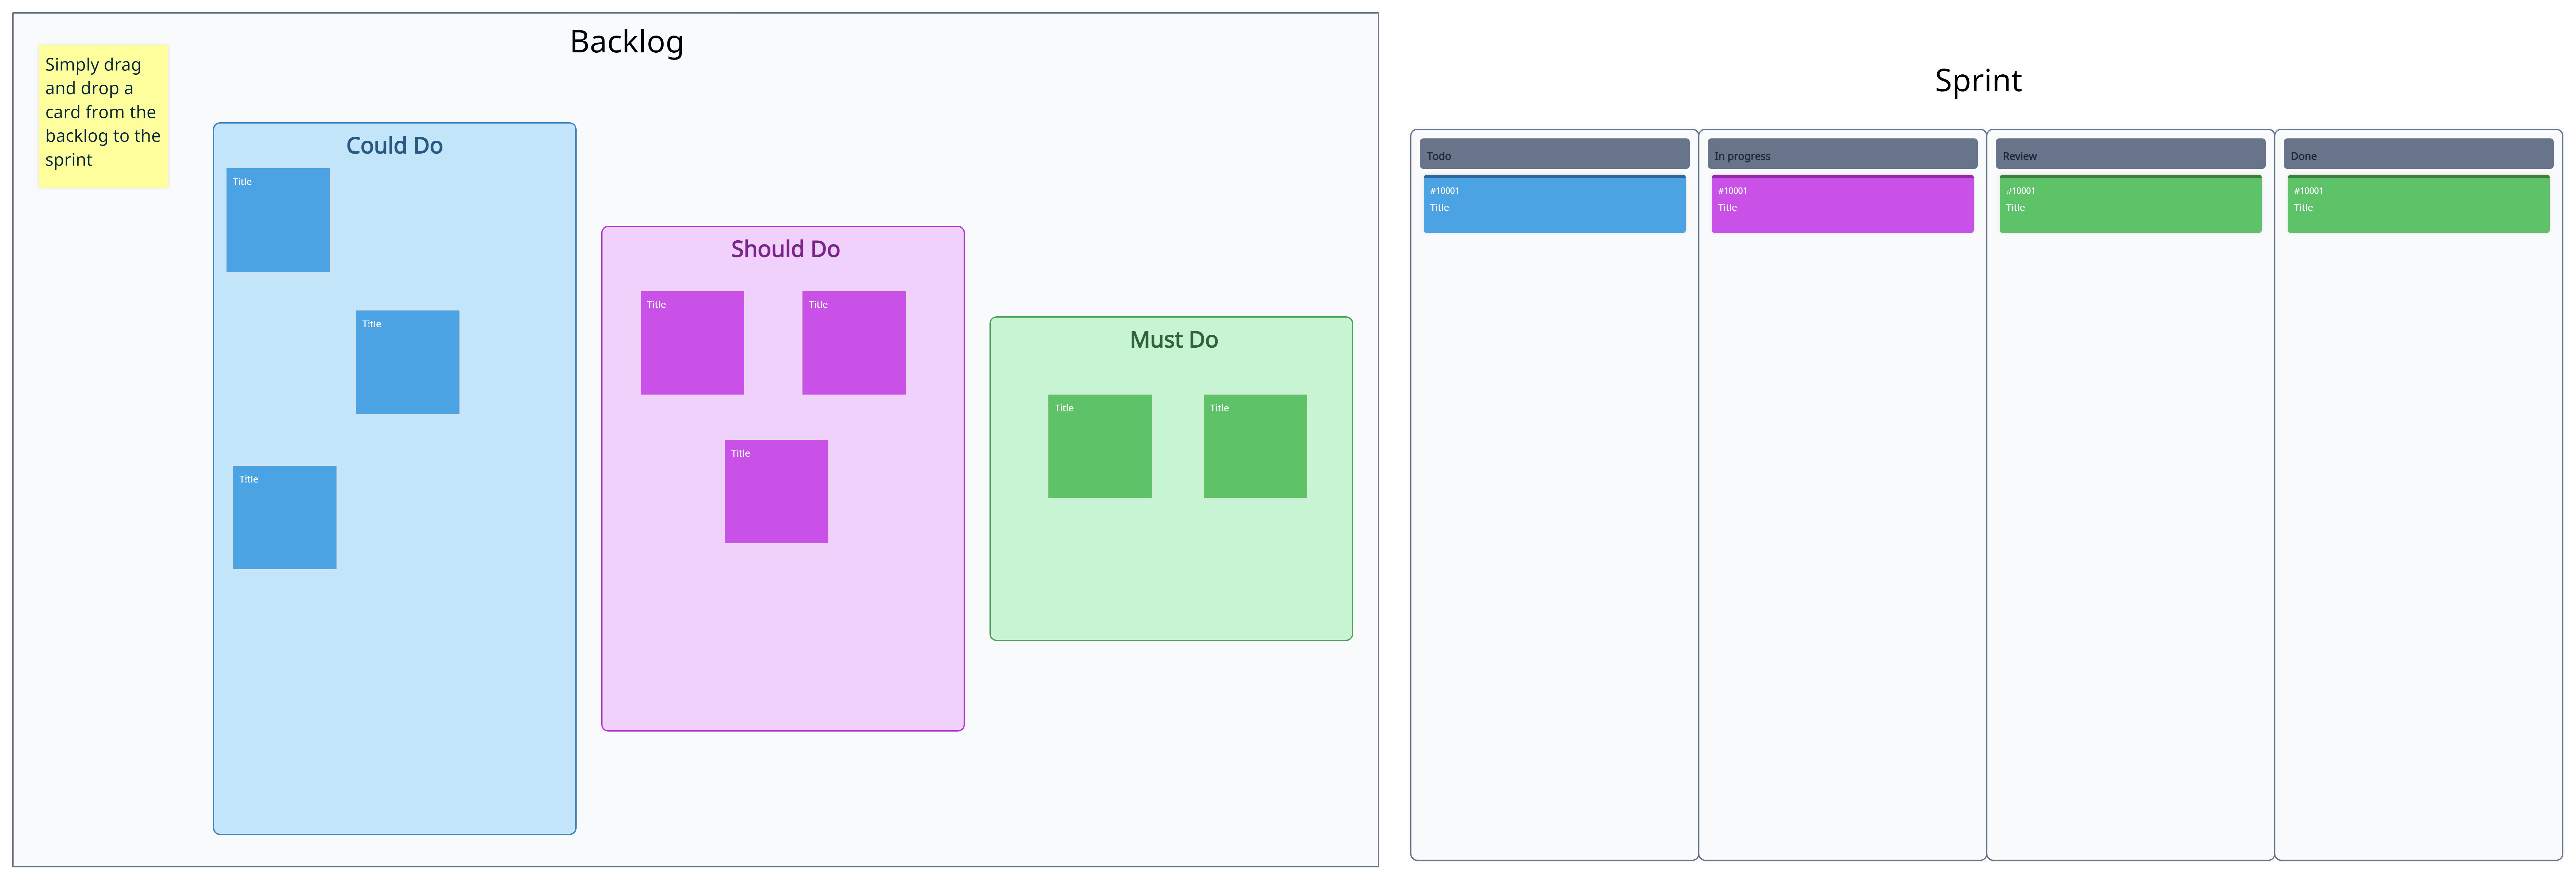
Click on the image to edit the Idea Funnel Backlog
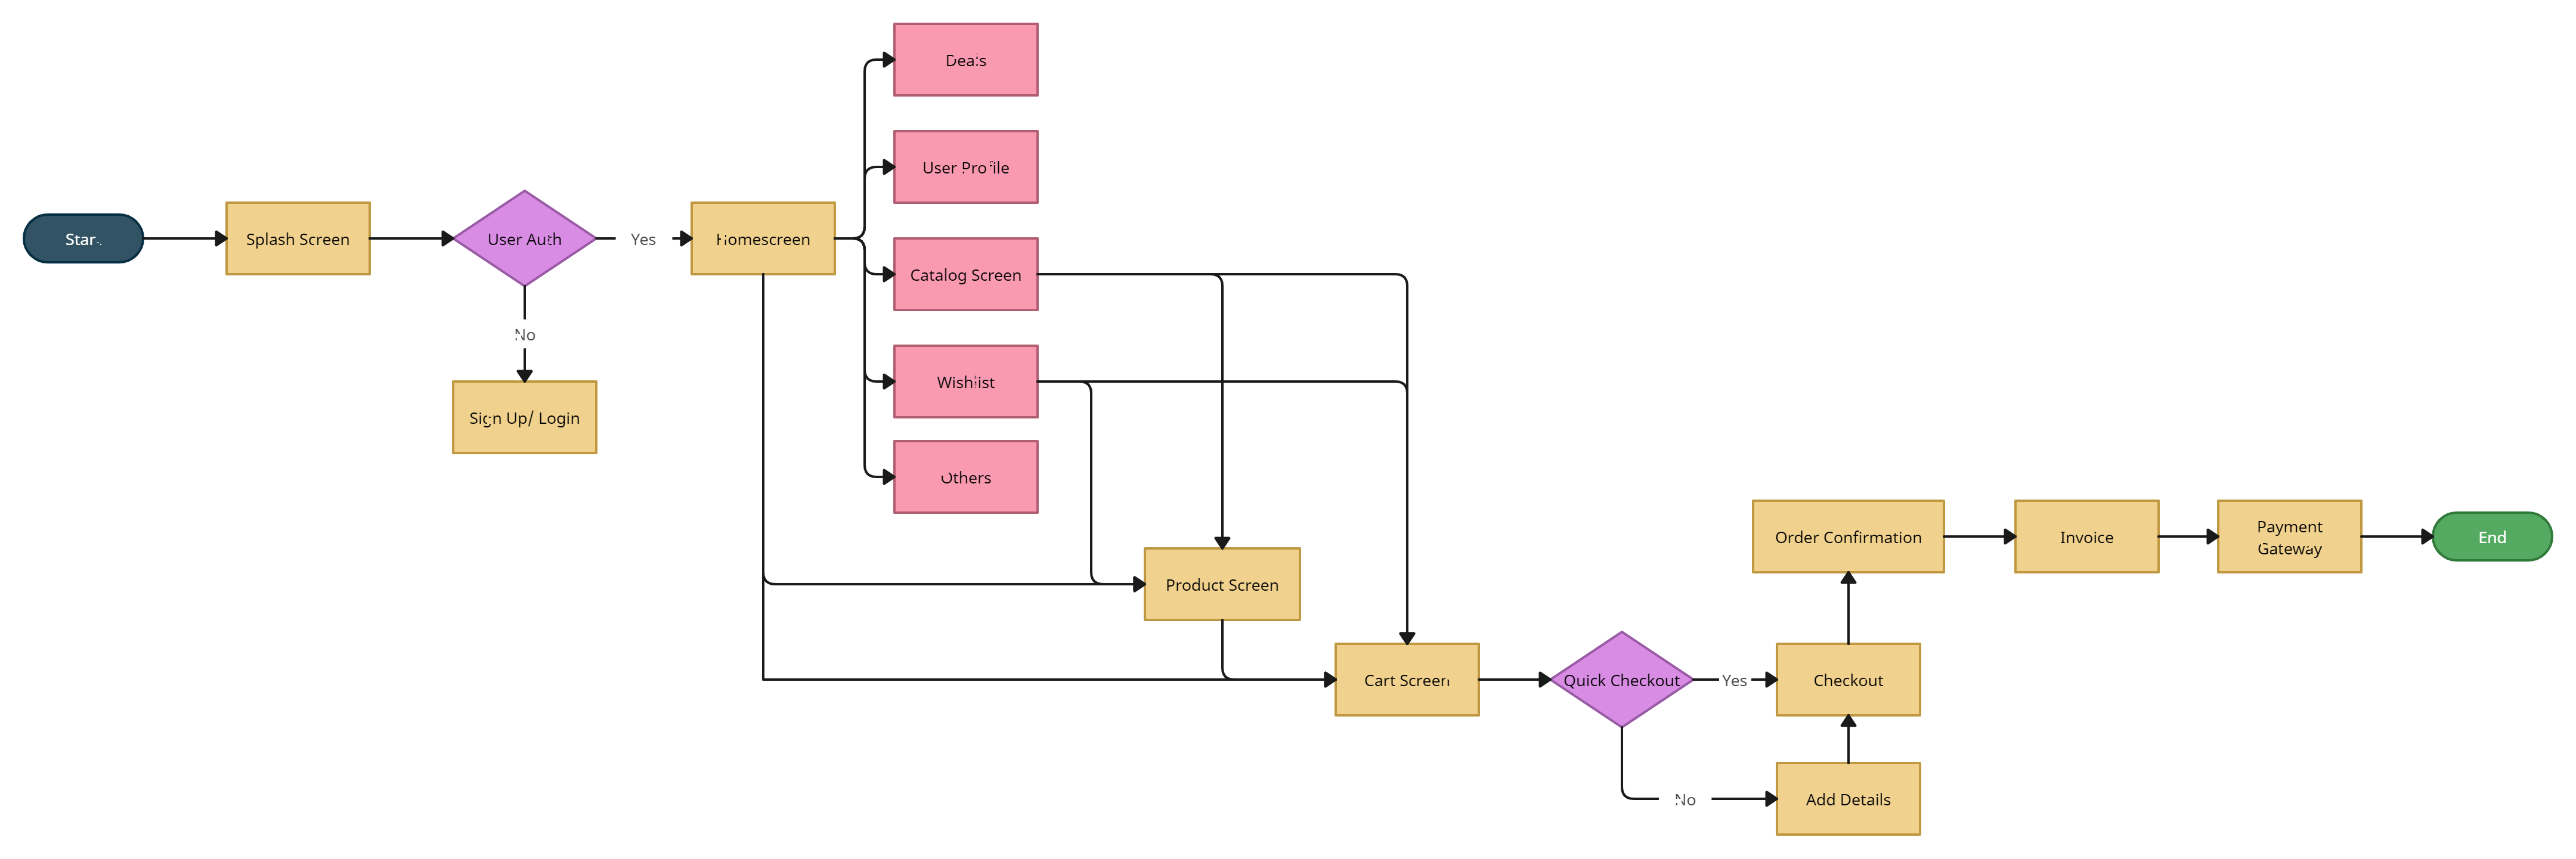
E-Commerce Website User Flow
The E-commerce website user flow flowchart is a visual tool commonly utilized by user experience (UX) designers, web developers, and product managers. It helps in planning and mapping out the navigation and interaction patterns of an e-commerce website, ensuring a smooth and intuitive user experience.
Here’s how to use the E-commerce website user flow flowchart template:
- Start by identifying the key pages or sections of your e-commerce website, such as the homepage, product listings, product details, cart, checkout, and user account.
- Create a flowchart diagram using the E-commerce website user flow flowchart template. Each page or section should be represented as a box or shape, and the connections between them should depict the navigation paths.
- Determine the different user actions or interactions within each page or section, such as browsing products, adding items to the cart, applying filters, or making a purchase. Represent these actions as arrows or lines connecting the corresponding boxes or shapes.
- Consider various user scenarios and incorporate them into the flowchart. For example, include paths for new users registering, returning users signing in, or users navigating back and forth between different pages.
- Label the connections and actions with clear descriptions, specifying the user actions and the resulting page transitions or interactions.
- Review and iterate on the flowchart, ensuring that it accurately represents the intended user journey and covers all necessary scenarios and interactions.
The E-commerce website user flow flowchart template helps in identifying potential bottlenecks, optimizing navigation paths, and ensuring a seamless and intuitive flow for users throughout their interaction with the website.
Click on the image to edit the E-Commerce Website User Flow
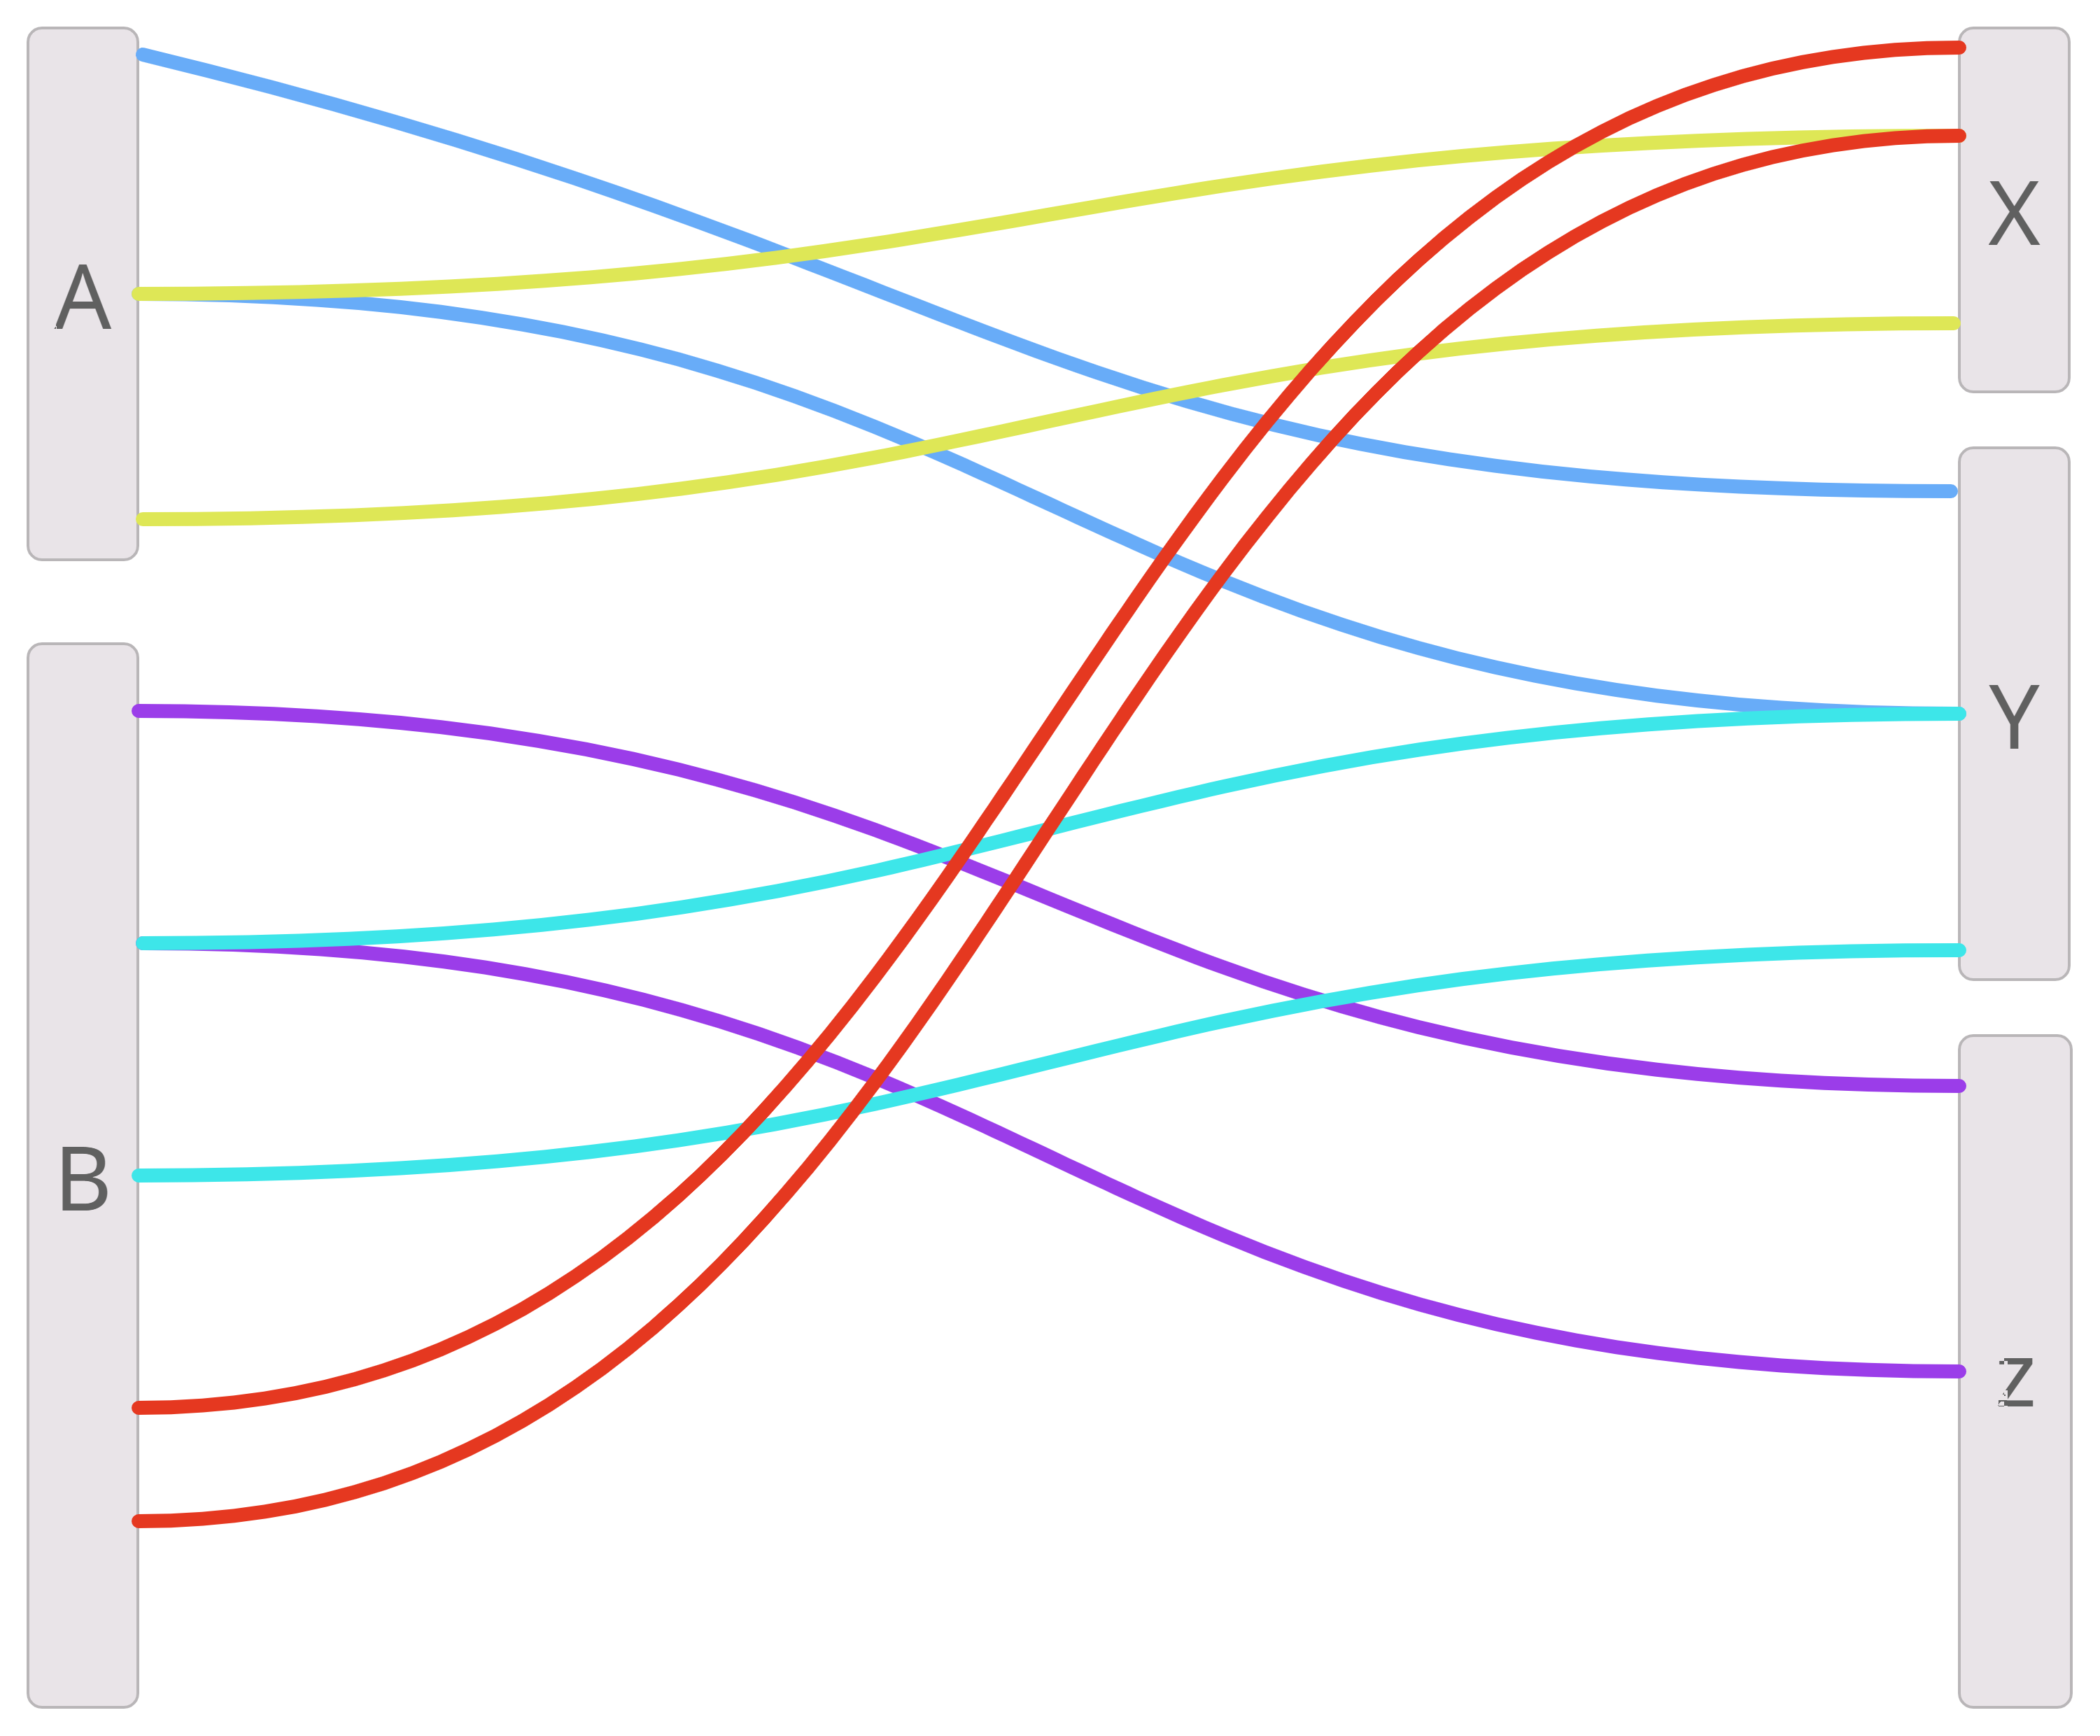
Sankey Diagram
The Sankey diagram is a powerful visualization tool commonly used by data analysts, environmental scientists, and engineers. It represents the flow of data, energy, resources, or processes between different entities or stages, providing valuable insights into the distribution, transformation, and efficiency of these flows.
Here’s how to use the Sankey diagram template:
- Identify the entities or stages involved in the flow that you want to visualize. For example, in an energy system, this could be power sources, distribution networks, and end-use sectors.
- Determine the flow quantities or metrics you want to represent, such as energy consumption, resource allocation, or data transfer.
- Create a Sankey diagram using the template, with each entity or stage represented as a node or column.
- Determine the flow connections between the entities or stages. These connections should reflect the direction and magnitude of the flow, usually represented as flows or arrows connecting the nodes or columns.
- Assign the flow quantities or metrics to the connections, indicating the volume, proportion, or value associated with each flow.
- Customize the Sankey diagram by labeling the nodes, flows, and values to enhance clarity and understanding.
- Analyze the diagram to gain insights into the flow patterns, identify bottlenecks, inefficiencies, or areas of optimization. Use it to inform decision-making, improve resource allocation, or identify opportunities for improvement.
The Sankey diagram template facilitates data analysis, system optimization, and strategic decision-making in fields such as data analysis, environmental science, energy systems, industrial processes, and transportation networks.
Click on the image to edit the Sankey Diagram