In our last week’s post, we shared some useful templates tailored for professionals in marketing, content creation, project management, UX design, and data analysis. We hope you found them helpful in getting your work done faster.
This week, we are thrilled to share five more brand new templates designed specifically for professionals in the fields of data analysis, process improvement, Scrum mastering, UX design, and SEO specialization.
Want more templates? Explore our diagram community to discover an extensive collection of templates ranging over 100s of organizational use cases.
This week’s templates include:
Bubble Chart
Bubble chart is a versatile data visualization tool used by data analysts, market researchers, and project managers. It helps them analyze and present data points with three variables in an engaging format.
To use the bubble chart template effectively, follow these steps:
- Input Data: Enter your data values for the x-axis, y-axis, and bubble size. Each data point represents a unique combination of these variables.
- Customize Labels: Add labels to identify each data point or bubble. This can include names, categories, or any relevant information that helps interpret the data.
- Color Coding: Apply colors to the bubbles based on specific categories or data ranges to provide additional visual cues and insights.
- Adjust Bubble Size: Modify the size of each bubble to reflect the magnitude or significance of the corresponding data point. Larger bubbles indicate higher values.
- Analyze and Interpret: Once the Bubble Chart is customized, analyze the chart to identify patterns, correlations, or trends among the variables. Use this information to draw meaningful conclusions and make data-driven decisions.
Professionals can effectively use the bubble chart template to visualize and interpret complex data sets, enabling them to communicate insights and make informed decisions based on the analysis.
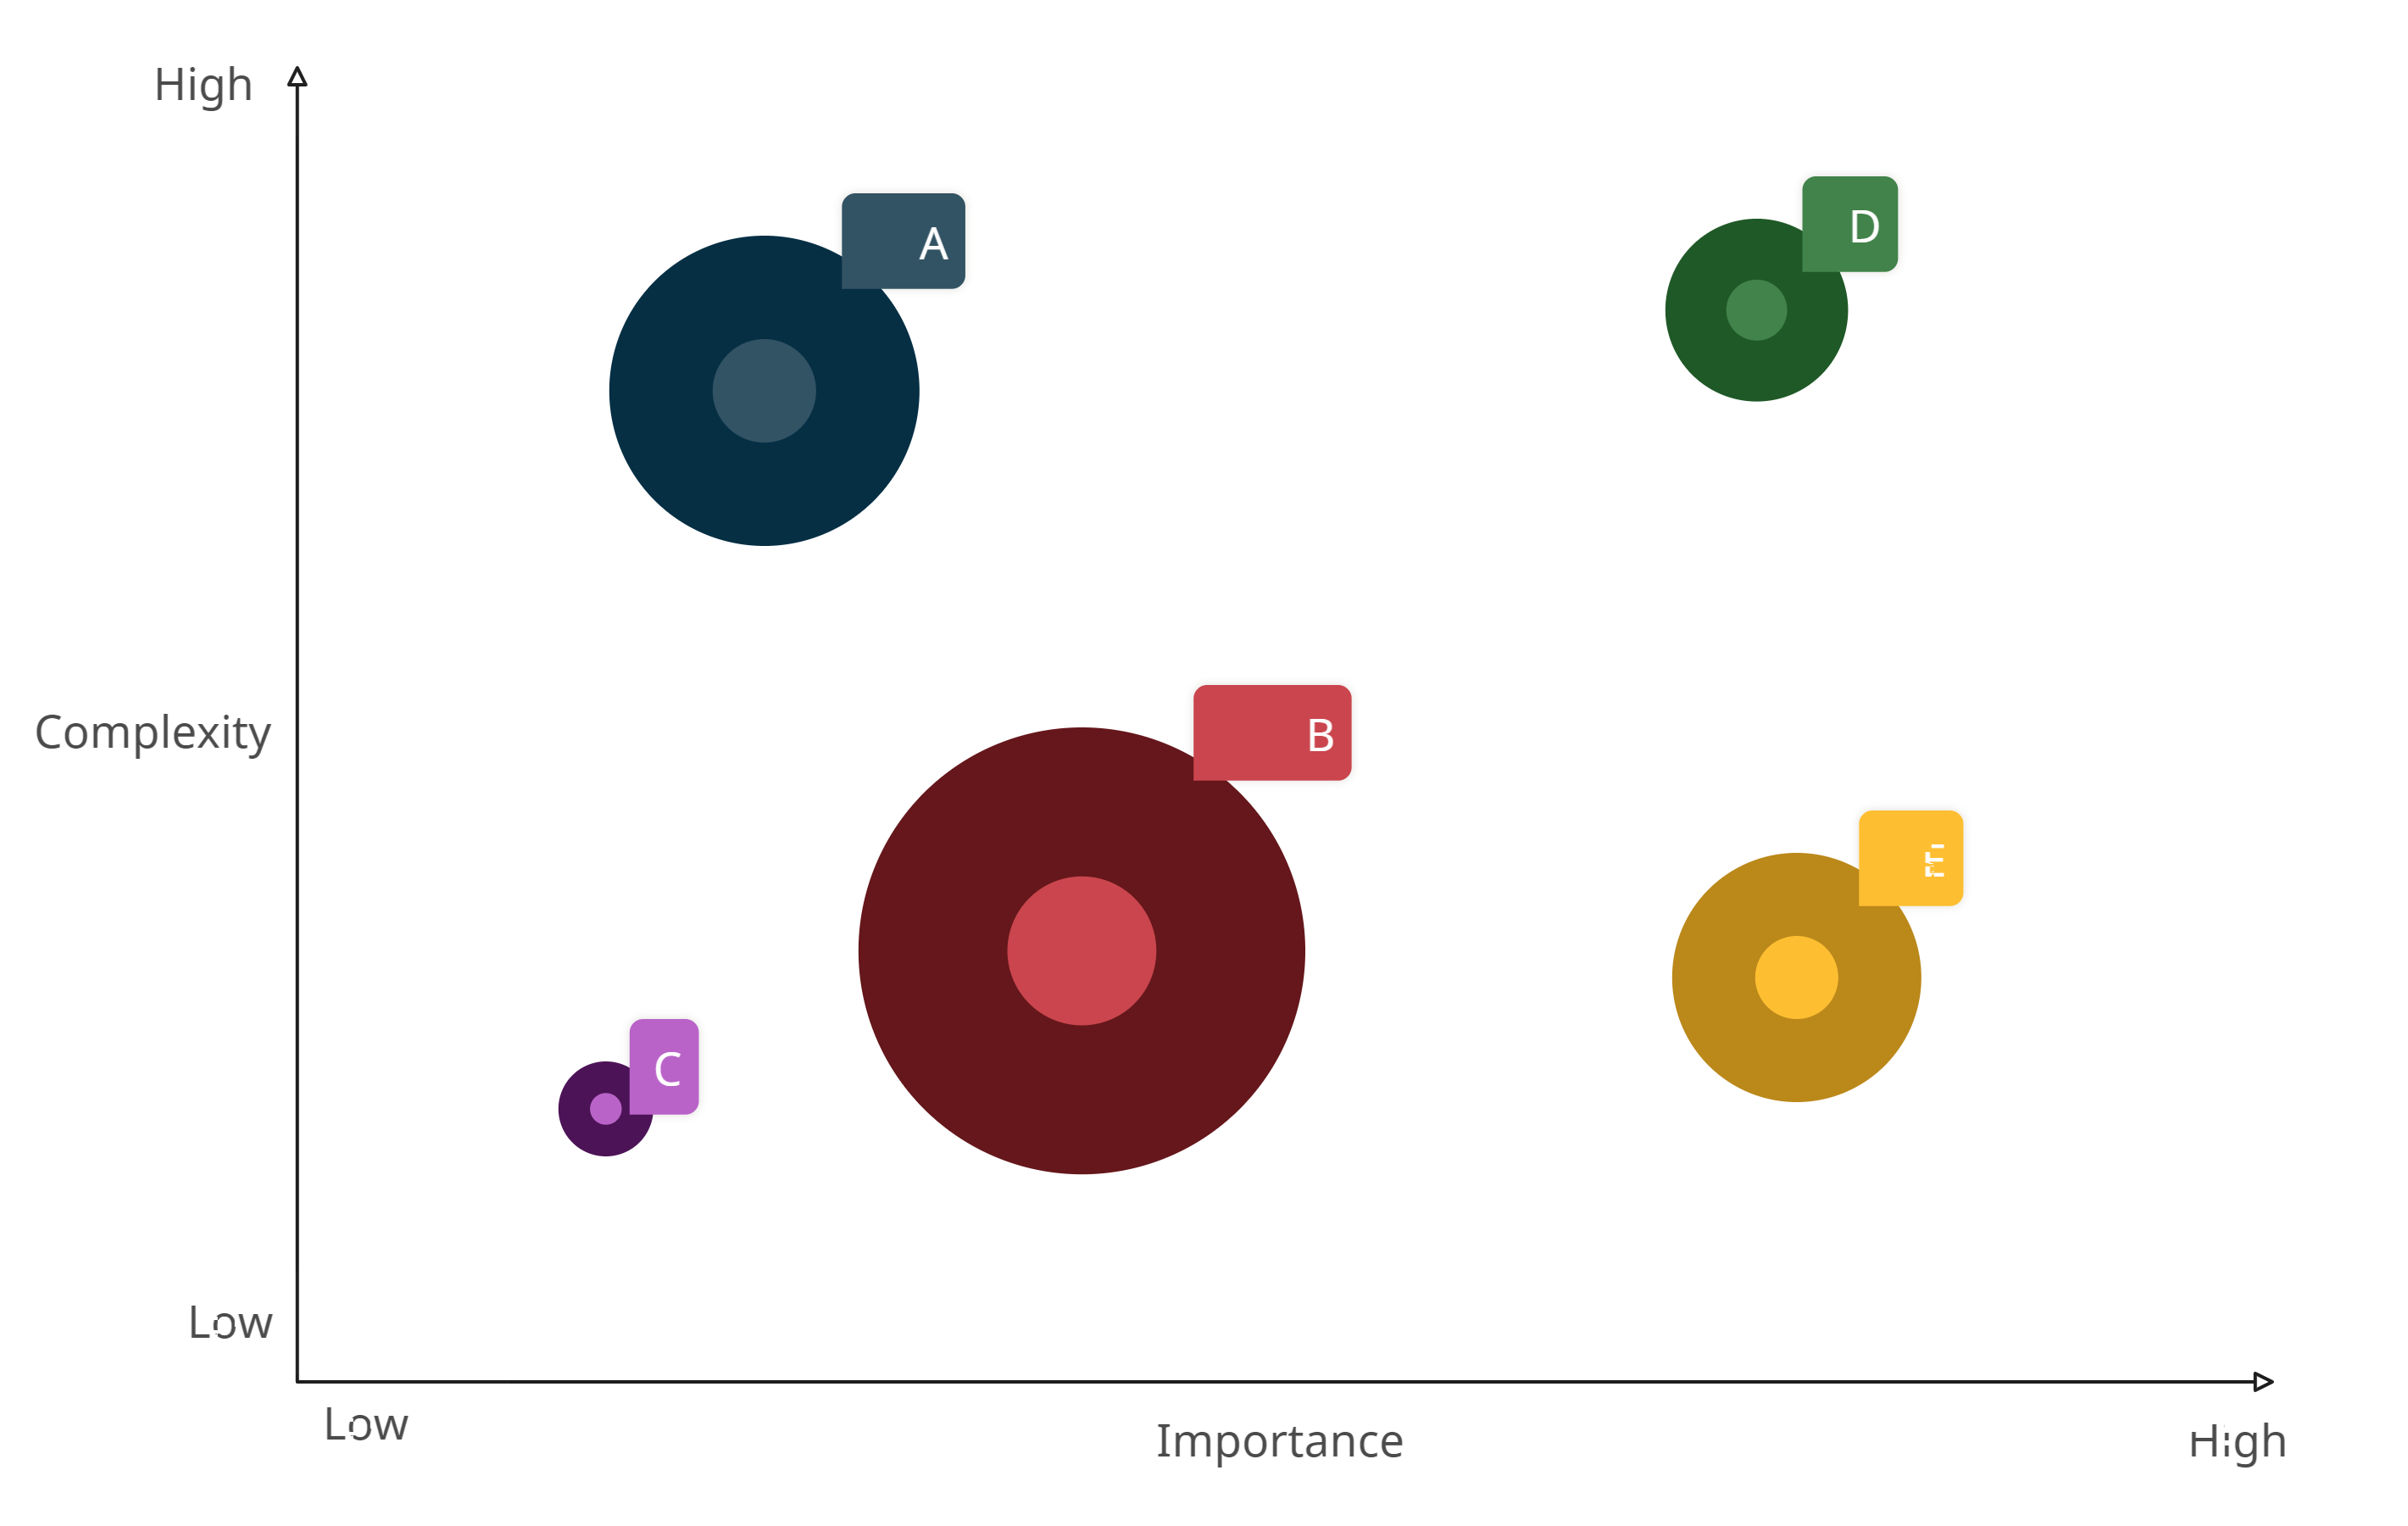
Click on the image to edit the Bubble chart
Spaghetti Diagram
Spaghetti diagram is a visualization tool commonly used in fields such as process improvement, logistics, and facility design. It helps analyze and optimize the flow and movement of people, materials, or information within a space.
Follow these 5 steps to use the spaghetti diagram template effectively:
- Map the Space: Begin by sketching or importing a floor plan or layout of the area you want to analyze. This can be a workspace, warehouse, or any physical environment where movement occurs.
- Track Movement: Observe and document the paths and routes taken by individuals, equipment, or materials within the space. Use a pen or digital tools to trace and mark the paths accurately.
- Analyze and Document: Identify any areas of congestion, bottlenecks, or inefficient pathways within the diagram. Make notes or annotations to highlight specific observations or issues.
- Visualize the Diagram: Transfer the information gathered onto the spaghetti diagram template. Use lines or arrows to represent the paths, and color code them to indicate different types of movement or flow.
- Optimize and Improve: Analyze the diagram to identify opportunities for improvement. Look for ways to streamline movement, eliminate unnecessary steps, and improve overall efficiency. Consider redesigning the layout or implementing process changes based on the insights gained.
You can utilize the spaghetti diagram template to visualize and analyze the flow of people, materials, or information within a space. This enables them to identify and implement improvements that enhance productivity and optimize operations.
Click on the image to edit the
Sprint Retrospective Template
The Sprint retrospective template is a valuable tool used by professionals practicing Agile methodologies, such as Scrum Masters and development teams. It facilitates reflection and improvement at the end of each sprint.
Follow these 5 steps to utilize the Sprint retrospective template effectively:
- Set the Stage: Begin the retrospective by creating a safe and open environment for team members to share their thoughts and ideas. Emphasize the purpose of the retrospective and the goal of continuous improvement.
- Gather Insights: Use the Sprint retrospective template to capture feedback and insights from team members. Encourage everyone to contribute by reflecting on what went well during the sprint and what areas need improvement.
- Identify Actionable Items: Collaboratively discuss the feedback and identify specific actions that can be taken to address the areas of improvement. Categorize these actions into themes or topics.
- Prioritize and Assign: Prioritize the identified actions based on their impact and feasibility. Assign responsibilities to team members to ensure accountability for each action item.
- Follow Up: Track the progress of the action items in subsequent sprints or team meetings. Regularly review and assess the effectiveness of the implemented changes to gauge their impact on the team’s performance.
Use the Sprint retrospective template to facilitate effective retrospectives and foster a culture of continuous improvement within their Agile teams. This enables teams to identify strengths, address weaknesses, and enhance their overall performance sprint after sprint.
Click on the image to edit the Sprint Retrospective Template
Feedback Grid
The feedback grid is a versatile tool utilized by managers, trainers, and educators to gather structured feedback and assess performance or ideas.
Follow these 5 steps to effectively use the feedback grid:
- Define Evaluation Criteria: Determine the specific criteria or dimensions you want to assess. This could include factors like effectiveness, creativity, communication, or any other relevant aspects.
- Create the Grid: Draw a grid or use a template to create a matrix with the defined criteria as columns and rows. This forms the foundation for organizing feedback.
- Collect Feedback: Engage relevant stakeholders and ask them to provide feedback by placing their input in the corresponding cells of the grid. They can use symbols, ratings, or written comments to express their opinions.
- Analyze and Summarize: Review the feedback collected and identify patterns or common themes within the grid. Summarize the feedback to gain a comprehensive understanding of strengths, weaknesses, and areas for improvement.
- Action Planning: Based on the feedback received, develop an action plan. Identify specific steps or strategies to capitalize on strengths and address areas for improvement. Assign responsibilities and establish timelines for implementation.
Use the feedback grid to gather comprehensive feedback, assess performance, and identify opportunities for growth or refinement. Its structured approach allows for a systematic evaluation and actionable insights that contribute to professional development and continuous improvement.
Click on the image to edit the Feedback Grid
Tier Ranking Template
The tier ranking template is a valuable tool used by project managers, strategists, and decision-makers to prioritize and categorize items or options based on their importance or relevance.
Follow these 5 steps to effectively use the tier ranking template:
- Define Evaluation Criteria: Determine the specific criteria or factors you want to use for ranking. This could include parameters like cost, impact, feasibility, or any other relevant considerations.
- List the Items: Create a list of the items or options you want to rank. This could be projects, tasks, features, strategies, or any other elements that require prioritization.
- Assign Tiers: Assign tiers or categories to group the items based on their relative importance or performance. For example, you can use labels like “High Priority,” “Medium Priority,” and “Low Priority.”
- Evaluate and Rank: Evaluate each item against the defined criteria and assign them to the appropriate tier based on their performance or relevance. Consider the impact and significance of each item within the context of the evaluation criteria.
- Review and Adjust: Review the tier ranking and assess if it aligns with your objectives and expectations. Make adjustments if necessary to ensure a balanced distribution of items across the tiers and reflect their true prioritization.
Use the tier ranking template to effectively prioritize and categorize items, enabling them to make informed decisions and allocate resources accordingly. It provides a structured approach to assess and rank options, ensuring focus on high-priority items and efficient resource allocation.
Click on the image to edit the Tier Ranking Template