According to Forrester, companies that map processes before automating see 42% faster implementation and 31% higher ROI. Precision and clarity are important, and the humble flowchart often serves as the unsung hero.
Whether you’re third-party robotic process automation tools, or a custom software solution, RPA process mapping can be the bridge between vision and execution.
Businesses use process maps in RPA projects because:
- They help bridging the gap between business and technical teams by clearly communicating the requirements
- They help to reduce the number of revisions and deliver the project faster
- They act as a documentation for non-technical users at the end of the project
Let’s explore the principles of effective RPA process mapping, a real-life example and best practices for integrating them into your development lifecycle.
Flowcharts in RPA Process Mapping
Flowcharts are visual representations of a process, depicting the flow of actions, decisions, inputs, and outputs. They transform abstract workflows into visual blueprints. Without them, automation projects is exposed to the following risks:
- “Black box” logic, where only developers understand the system.
- Misaligned stakeholders expecting different outcomes.
- Costly rework when edge cases surface late.
Here’s why they are especially useful in automation projects:
1. Clarify Complex Processes
Automation often involves intricate workflows, conditional logic, and multiple stakeholders. Flowcharts help business users explain the developers how processes should work before any code is written.
2. Support Accurate Development
Flowcharts reduce ambiguity, which helps developers and automation tools translate business logic into precise steps. This minimises the number of errors and revisions during implementation.
3. Facilitate Testing and Troubleshooting
Having a visual reference makes it easier to identify where issues occur in the automation and validate that the logic flows as intended.
When to Use Flowcharts in Automation Projects
During Requirements Gathering
Mapping out the current (as-is) and desired (to-be) processes ensures stakeholders are aligned on scope and outcomes.
During Process Design
Designing the logic flow, including exceptions, approvals, loops, and branching, before development begins.
During Development
Developers use flowcharts to guide the structure of automated workflows or bots, especially when using tools like Power Automate, UiPath, or Zapier.
During Documentation and Training
Flowcharts serve as documentation that explains how the automation works, crucial for onboarding new team members or undergoing audits.
Key Components of a Good Automation Flowchart
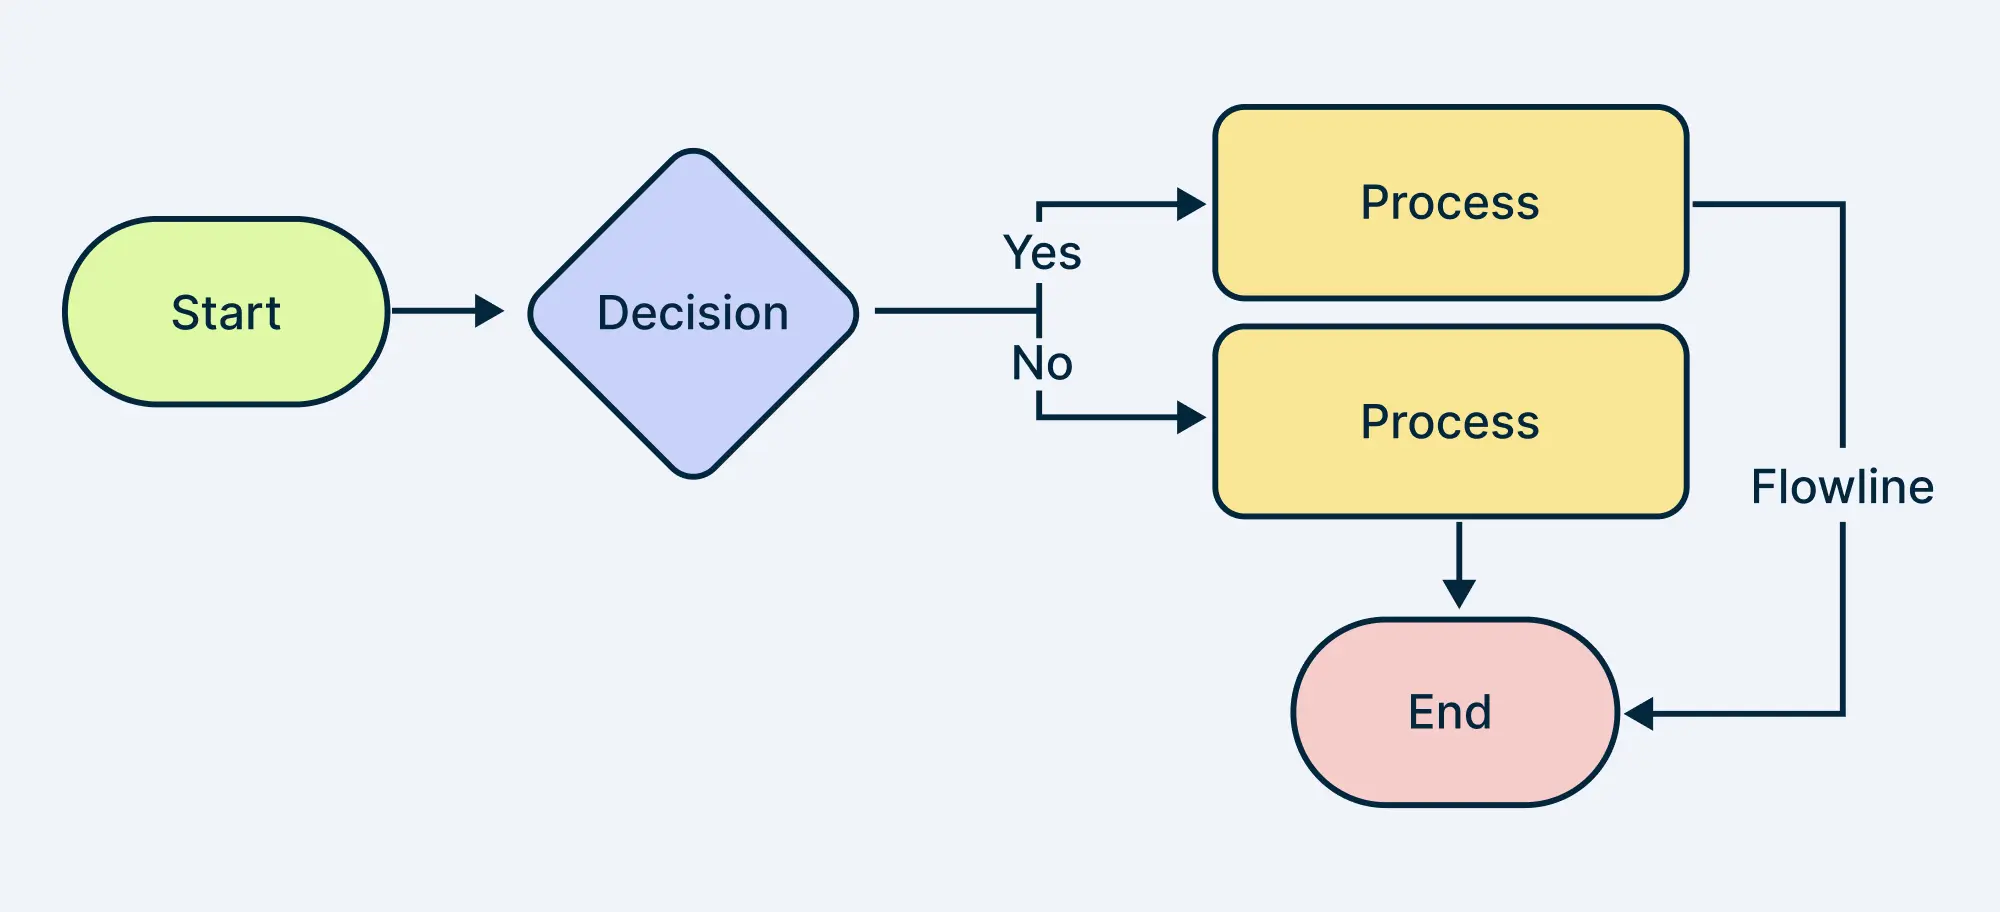
| Symbol | Meaning |
| Rounded rectangle / Oval | Marks the beginning or conclusion of a process |
| Rectangle | An action or step in the process |
| Diamond | A branching point based on a condition |
| Square | A data input or system output |
| Arrows | Indicate the direction of the flow |
Creately has a flowchart library which include all of the flowchart symbols mentioned above and more.
Case Study: Pre-assessment Automation
In a recent digital transformation initiative, the Singapore Changi Airport replaced its manual pre-assessment for new IT and Digital projects with a fully automated solution.
Their pre-assessment process relied heavily on manual inputs, primarily through Microsoft Forms. However, once the data was captured, it needed to be reviewed and approved by 6 different teams (data engineering, cyber security, etc) for the project to go ahead. This meant little visibility of the project review status and frequent delays in gathering approvals and launching projects.
The organisation transitioned to a more robust and scalable solution using Microsoft Power Apps and Power Automate, to address these gaps. The goal is to enhance efficiency, minimise delays, and ensure accurate decision-making during the early phases of IT and digital project evaluations.
We started the project by using Creately’s flowchart software to visualise the process and clearly explain it to the developers.

The flowchart helped in the following areas:
- Specify the order of steps in the review process.
- Defined automation triggers like “form submitted” or “SME notified”.
- Clearly communicate which review functionality is needed for every team and how different teams depend on each other in this process.
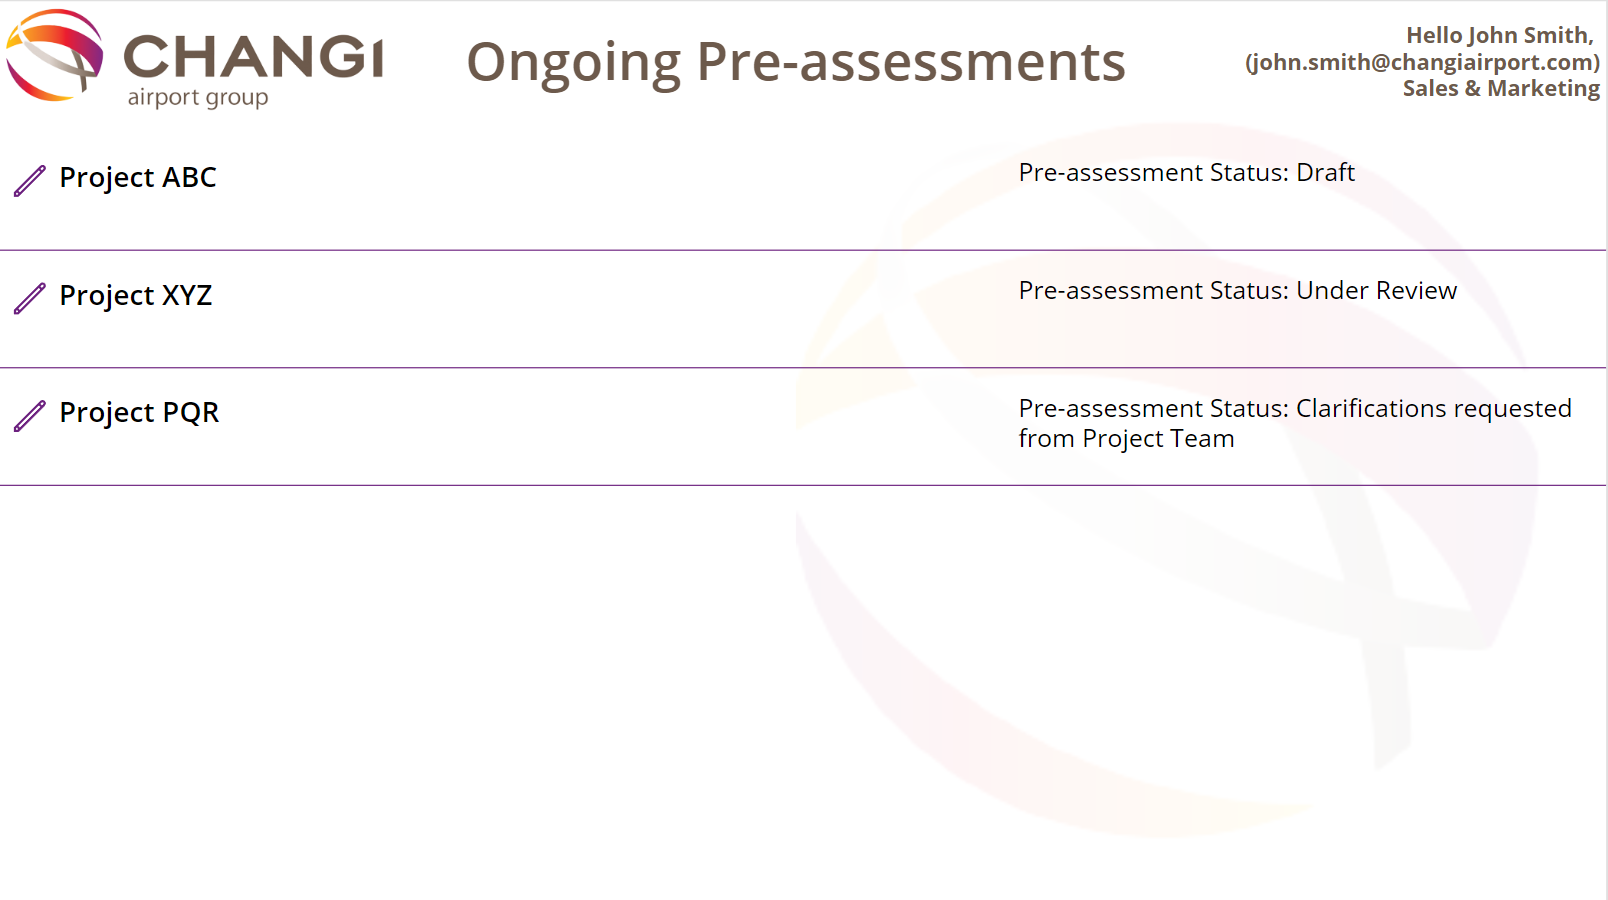
When the project development started, the Power Apps developers referred to the process map to create a landing screen for all the teams. This screen enabled project team to submit new pre-assessments and view the status of ongoing assessments.

The project teams then populated all the required details needed for the pre-assessment by all the other teams in the next Power Apps screen. This helped Changi group to ensure that all the necessary details for the review are gathered and avoid delays due to missing information.

Finally, the project teams were able to see all the outstanding requests and their status. This increased the visibility throughout the process and ensured that all the stakeholders knew who is responsible for next steps of the review process.
Step-by-Step: Building Impactful RPA Process Maps
Step 1: Define the Process Scope
Start by answering three simple questions:
- What is the goal of this process?
- Where does it start, and where does it end?
- Who are the stakeholders involved?
Step 2: Identify the Key Steps
List each step in the process chronologically, from input to outcome. Don’t worry about formatting yet, this is just about capturing what happens.
For example:
- Employee submits a request
- The manager reviews and approves
- IT sets up access
- HR sends a welcome email
Ask questions like:
- What decisions are made?
- What tools or systems are used?
- Are there any exceptions or loops?
Step 3: Choose Your Flowchart Tool
You can use anything from pen and paper to sophisticated digital tools. A popular option is Creately, which offers good functionality to create an industry-standard flowchart.
Step 4: Map the Logic Flow
Now it’s time to sketch the actual flow:
- Begin with the Start symbol.
- Add each process step in a box.
- For any decision (Yes/No, If/Else), use diamonds.
- Use arrows to indicate direction and sequence.
Keep the following in mind:
- One entry and one exit point per shape.
- Avoid overlapping lines.
- Use clear, concise labels.
Step 5: Review with Stakeholders
Before proceeding to development or automation, walk through the flowchart with all stakeholders:
- Does it reflect the real-world process?
- Are any steps missing?
- What exceptions haven’t been accounted for?
- Are all roles and handoffs correct?
This step ensures alignment across business, technical, and compliance teams.
Step 6: Optimise Before Automating
Once the process is visualised:
- Identify redundant steps or bottlenecks.
- Consider automation candidates, steps that are manual, repetitive, or error-prone.
- Ensure any decision points have clear rules or logic.
This is your chance to refine the process, not just digitise it.
Step 7: Integrate into Your Automation Platform
Many automation tools allow you to build logic visually, much like your flowchart:
- Power Automate uses trigger-based flows and connectors.
Use your flowchart as the source of truth when configuring workflows.
Step 8: Document and Maintain
Once automation is live:
- Include your final flowchart in project documentation.
- Use version control if processes change.
- Train new users or developers using the visual reference.
Best Practices for Using Flowcharts in Automation
1. Keep It Simple, but Detailed
Avoid clutter, but don’t skip over critical decision points or subprocesses. Aim for clarity.
2. Use Standard Symbols
Maintain consistency across your diagrams. Standardisation helps teams quickly interpret flowcharts.
3. Modularise Complex Flows
Break down large processes into smaller, modular flowcharts to make them easier to manage and maintain.
4. Involve Stakeholders Early
Validate flowcharts with end-users and analysts before development begins. This prevents scope creep and misalignment.
5. Integrate with Tools
Many automation platforms (e.g., Microsoft Power Platform) offer visual editors that function like flowcharts. Start with conceptual diagrams and map them directly into your tool.
Conclusion: You’re More Likely to Succeed with RPA Process Mapping
Flowcharts aren’t just for brainstorming; they are strategic tools that transform ideas into executable automation. In every phase of an automation project, from discovery to delivery, they provide clarity, improve collaboration, and reduce risk.
Don’t skip the flowchart if you’re starting your next automation initiative. It might just be the smartest first step you take, especially with a powerful flowcharting software like Creately to help you.

Eugene Lebedev is the managing director of Vidi Corp, a UK-based RPA and data analytics consultancy. Vidi Corp has delivered 1000+ projects for 600+ international clients including Google, Teleperformance and DS Smith.