Project management is hard and it gets even harder if you don’t have the right information at your disposal. Only 71% of projects manage to meet the agreed scope and only 28% of projects manage to meet the budget requirements. With stats like that, it’s no wonder companies emphasize on hiring experienced and certified project managers.
And experienced project managers know that success of any project relies on having the right information at the right time. And good visualization tools help you get that information quickly and also enables you to communicate that information quickly to your team, stakeholders etc.
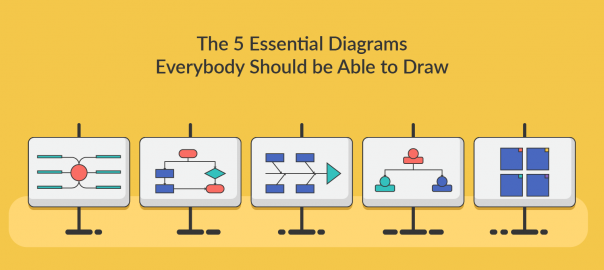
Listed below are some diagrams that will help you visualize the information you need for a project.
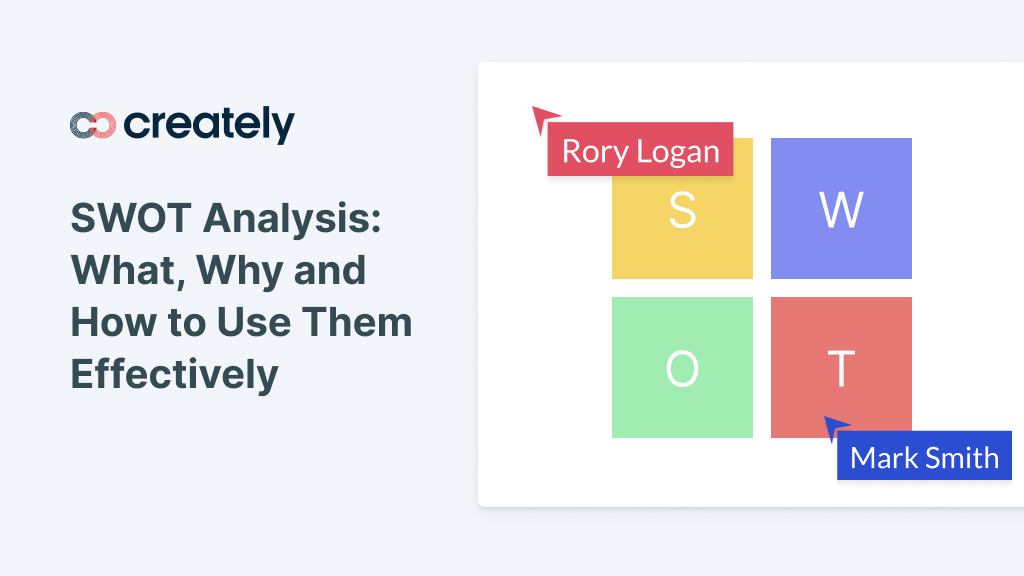
SWOT Analysis in Project Management

Click on the image to use it as a template
SWOT stands for strengths, weaknesses, opportunities and threats. And you need to identify all of them before you start planning your projects. This is also a perfect opportunity for other stakeholders of the projects to provide their input.
For example in an IT project, a team leader will have a better understanding of the technical requirements of the project and whether there are resources to fulfill those requirements. Similarly, a third party consultant can give input on the current trends and what your competitors are doing etc. All these details are important to understand the overall picture before you start your project.
Understanding the overall picture has become a key component in modern project management. This is why modern project management tools focus on integrating themselves with other external business tools; for example, WorkflowMax I integrates with HubSpot, Xero, SalesForce etc. This enables you to quickly access data that is important to the success of the project. You can get started immediately using our SWOT analysis templates.
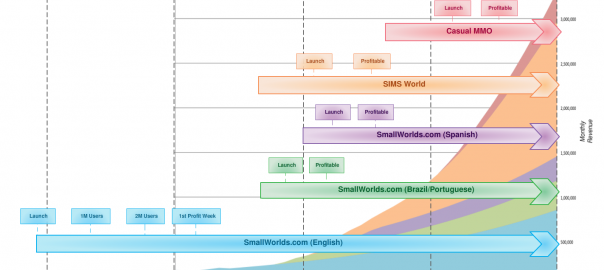
Gantt Charts in Project Management

Click on the image to use it as a template
Gantt charts are one of the easiest ways to quickly visualize a project and all its subtasks. Although they become less useful in complex projects with lots of tasks, for less complex projects, they provide a great way to measure progress and define outcomes.
Even for complex projects, they can be used to provide a quick overview of the project to stakeholders. You can clearly show the timeline of the project, dependencies between tasks and also the resource allocation for the project.
Most project management software have built in tools to generate the Gantt chart once you’ve added the tasks which show how deeply intertwined Gantt charts are with project management. Find these ready to use gantt chart templates to get started right away.
Work Breakdown Structures in Project Management

Click on the image to use it as a template
A Work breakdown structure is a simple diagram type that is used to break large tasks into manageable sub tasks. Here, you don’t have to worry about dependencies, time allocation or the resources. This is mostly done by smaller teams who are part of a larger project.
The sub tasks derived from this exercise are used in Gantt charts and activity diagrams which have the ability to show dependencies and other factors useful to the project.
Activity Diagrams in Project Management

Click on the image to modify it online
In complex projects with lots of subtasks and interdependent tasks, activity diagrams are preferred over Gantt charts. They have a much better mechanism to show dependencies and enable the project manager to identify critical paths in a project.
Once you identify the critical paths, it’s easier to allocate resources; this will help you to significantly reduce the slack time of various teams.
In a typical project, you’re likely to see both Gantt charts and activity diagrams used in conjunction.
As you can see there are many tested and proven diagram types that you can use to visualize your project and make correct decisions. It’s unlikely that you will use all of them in a single project, but using some of them will definitely make it much easier to manage your project.
Got any more diagram types that can help you with managing projects? Do let us know in the comments section.