Project management is not an easy job. In general, 37% of projects fail while that number reaches around 60% for IT projects. There are so many contributing factors which need to be carefully monitored. The article will discuss how to use Gantt charts to plan projects, why they are useful and how to effectively use them in a project.
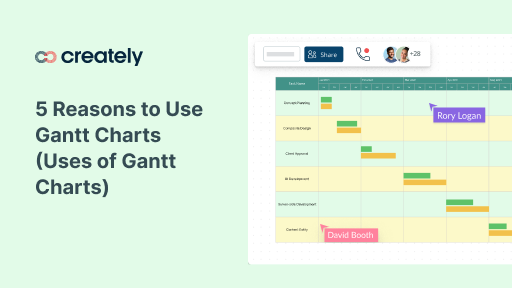
One of the biggest advantages of Gantt charts is the ability to easily visualize the state of your project. Even for a large project with thousands of tasks, a Gantt chart can be used to visualize the overall status of that project. It can also be used to
- To produce an accurate timescale for the project
- Breaking down the structure of the project
- Showing team members how their work relates to others
- Schedule of work on a day to day basis throughout the entire duration
- Able to be used in the critical path method
You can do all this and more using our Gantt chart software.

You can plan almost anything using a Gantt chart
Since you know the benefits lets look at how to use a Gantt chart for project development.
Identifying the Processes for Project Planning
In order to produce a Gantt chart, it is essential that you know all of the processes involved. This means that you will need to use a flow chart or arrow chart to go through each of the steps which are required to make sure the project is completed. Once you have these basic processes it is then necessary to work out how long each of the tasks will last, and how many resources are needed to complete the task.
Once you have a list of all these processes and their relevant information it is then time to identify the sequence of events. You will have to know which of the processes can only begin after certain tasks have already carried out and which ones have to be completed at certain milestones throughout the project.
Mapping the Processes to the Gantt Chart
Once you have all this information it is then a great idea to get it down on paper in the form of a chart. By doing so it allows you to see the whole of the project from start to finish and share your plan with others.
Creating the chart itself can be a little tricky if you are doing it from scratch. You will need a horizontal axis which indicates the time. The time can be broken down into days or weeks depending on which scale is the most appropriate for your plan. On the left of the page is where you need to add each of the tasks as well as the milestones.
Make sure you add the length each step will take and highlight vital dates such as specific milestones if and when they relate to the set task. For each of the tasks create a bar which spans the right length of time for easy viewing and make sure you have included all of the processes.
Alternatively, it can be a lot easier to use Creately which has ready-made Gantt chart templates for project management processes. All you need to do then is add your relevant information to the chart by typing in the text and adding extra processes if you need to. Creately is especially useful for sharing with all the team even if some of the work is to be carried out by companies or departments overseas.

Easy to use Gantt chart template
Sharing and Working Together for the Success of the Project
You can quickly share your Gantt chart via email and add each of the team members to the chart so they are able to add their comments and documents with the rest of the team and discuss the project together. You can even add charts like this to websites with ease and share the information with your clients so they are able to track the progress of the project. This can reduce the need for constant feedback to be provided to worried clients and allow you to continue working without as many interruptions or logistical issues getting in the way.

Visually collaborate on the project plan using easy to use Gantt chart templates
Using the Information to Your Advantage
Once you have your completed chart you can use it to determine to time that you require in order to complete the project. You can pass on information regarding the completion date to your client and also allow the team members to see when their part in the project needs to be completed.
The information can be broken down into days so that a project manager is able to see how many people or working on the project on any one day, which teams are currently involved and what steps may need to be taken if a problem halts the progression of the finalized plan. In short, a simple chart of this nature provides all the information required for project planning and scheduling to be used by multiple people including the client to help everyone stay on track and informed from the start to finish.
Do You Use Gantt Charts to Plan Projects?
People take different approaches to planning. If you’re planning a project a Gantt chart is a good way to visualize the overall structure and the timeline of the project. If you’re using them in project development I would love to hear about how you use them.
More articles from the Gantt Chart series
- 5 Reasons to use Gantt Charts
- Gantt Chart Templates to Instantly Create Project Timelines
- How to draw Gantt Charts quickly using Creately
- Using Gantt Charts and Flowcharts for in Project Management
- Why Every Startup Needs Gantt Charts
- How To Create a Project Timeline In 6 Simple Steps

can we define a function in visio gantt chart as we do in excel sheet?
The use of Gantt chart easily visualize the timeline of each project and how these projects interact with one another in terms of time as they progress.
Hi Khathutshelo,
You can use a Gantt chart to plan long projects, it do
thanks sir for telling about how to plan a project nyc post…
Hi Khathutshelo,
You can use a Gantt chart to plan long projects, it doesn’t matter whether it’s 4 years, 10 years or one week.
Can I use a gantt chat on a 4 years or more project?
Management information system
Consider a change within the IT/IS department in your organization that is happening now, or has happened recently.
1. Taking it as a case study consider how well the change was managed, and compare it with how change should ideally be managed. What was good, and what was could have been done better?
2. Explain the potential threats and resistance to the project and how it was resolved or not resolved in the execution of the project
3. Explain how the organizational culture either stimulated or inhibited the technological changes that were initiated by your organization?
4. Finally, show how you would have planned the project, using gantts etc, and explain how this would have helped.
At least 4000 words