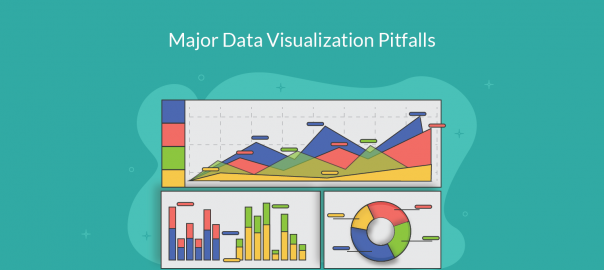
Data Visualization is one of the trending areas in data science and can help an organization thrive. It can deliver clear messages to the shareholders who are not much familiar with data, such as an organization’s board. Data visualization helps… Read More
Tag Archives for data visualization
A picture is worth a thousand words. Or in other words that complex idea you are trying to explain to your reader in several detailed sentences can actually be better clarified with one single picture. There are many advantages of visual… Read More
Everyone has problems, and we spend most of our working lives solving them. For those who find this quite negative, problems can be also termed as Issues, Challenges or Opportunities. Some people are especially gifted at problem-solving while others struggle…. Read More
Any software engineer worth her salt has drawn some UML diagrams. They are a great tool for good design and planning of a software product and is applicable for all stages of the software lifecycle. The UML standard exists so… Read More
It’s an undisputed fact that the human brain processes images a lot faster than words and this is particularly true when it comes to illustrating complicated data. Visually representing large amounts of data in an infographic allows it to be… Read More