As Alex Carter, someone who’s spent years helping teams optimize their digital workflows, I’ve witnessed a fundamental shift in how successful project managers approach their craft. The days of managing projects through endless email chains and static spreadsheets are behind us. Today’s most effective project managers have embraced visual project management—and the results speak for themselves.
I recently worked with a software development team that was consistently missing deadlines despite having talented individuals. The problem wasn’t their skills; it was their inability to see the bigger picture and understand how their work connected to the overall project timeline. After implementing visual project management techniques using collaborative platforms, they reduced their project delivery time by 35% and virtually eliminated communication gaps.
What Is Visual Project Management?
Visual project management uses diagrams, charts, boards, and other visual elements to plan, track, and communicate project information. Instead of relying on text-heavy documents and verbal updates, teams can see project status, dependencies, and progress at a glance.
Think of it as the difference between reading a novel about a city versus looking at a detailed map. Both contain information, but the map allows you to navigate much more efficiently.The core principle is simple: when everyone can see the same picture, everyone stays aligned.
Why Visual Project Management Accelerates Delivery
Enhanced Communication Clarity
Traditional project communication often suffers from the “telephone game” effect—information gets distorted as it passes from person to person. Visual representations eliminate ambiguity. When a team member sees a flowchart showing exactly where their task fits in the overall process, there’s no room for misinterpretation.
Faster Decision Making
Visual dashboards and charts allow project managers to identify bottlenecks, resource conflicts, and timeline issues immediately. Instead of spending hours analyzing spreadsheets, they can spot problems and make adjustments in real-time.
Improved Team Alignment
When project information is visualized on shared platforms, every team member has access to the same up-to-date information. This creates a shared understanding that keeps everyone moving in the same direction.
Better Stakeholder Engagement
Executives and clients don’t have time to dig through detailed project reports. Visual summaries and interactive dashboards give them the high-level view they need while allowing them to drill down into specifics when necessary.
The 6-Step Visual Project Management Framework
After implementing visual project management across dozens of projects, I’ve developed a systematic approach that consistently delivers faster results. Here’s the step-by-step framework:
Step 1: Create Your Visual Project Charter
Before diving into tasks and timelines, establish a clear visual representation of your project’s foundation. This serves as your project’s north star and keeps everyone aligned on the bigger picture.
What to Include:
- Project objectives and key deliverables
- Success criteria and metrics
- Stakeholder map and roles
- High-level timeline and milestones
- Risk assessment matrix
Tools and Techniques: Start with a project charter canvas that visually maps out all critical elements. Modern visual collaboration platforms offer structured templates that organize these elements into clear, color-coded sections. For example, you can create organized layouts with distinct areas for Objectives, Tasks, Success Criteria, Time Frame, and Resources—each with their own visual treatment to make information instantly recognizable.
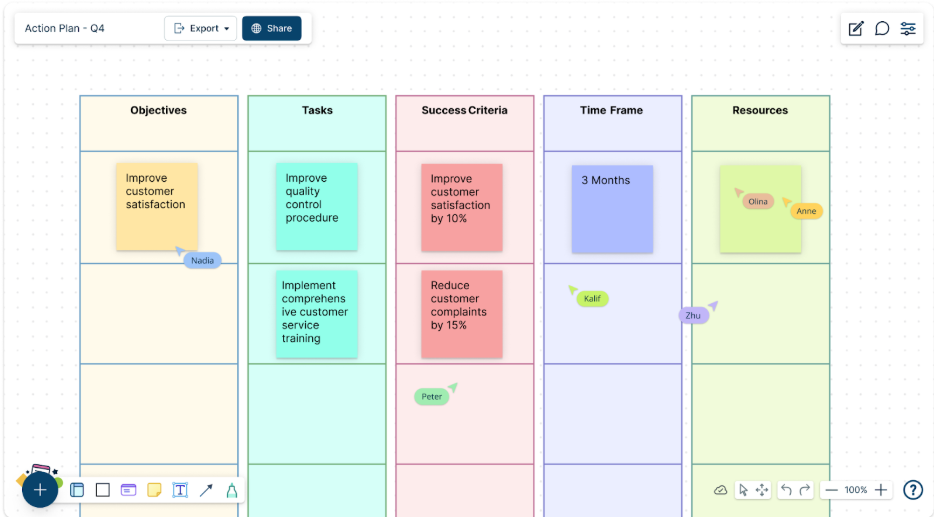
Pro Tip: Use color coding to differentiate between different types of information—blue for objectives, green for deliverables, yellow for risks. This visual consistency will carry through your entire project management approach.
Step 2: Build Your Visual Project Structure
This step involves breaking down your project into manageable components and visualizing their relationships. Think of this as creating the blueprint for your project house.
Work Breakdown Structure (WBS) Visualization: Create a hierarchical diagram that shows how major deliverables break down into smaller tasks. This visual representation helps identify gaps and ensures nothing falls through the cracks.
Dependency Mapping: Show how different tasks and deliverables connect to each other. Visual dependency maps reveal critical path activities and help teams understand the ripple effects of delays.
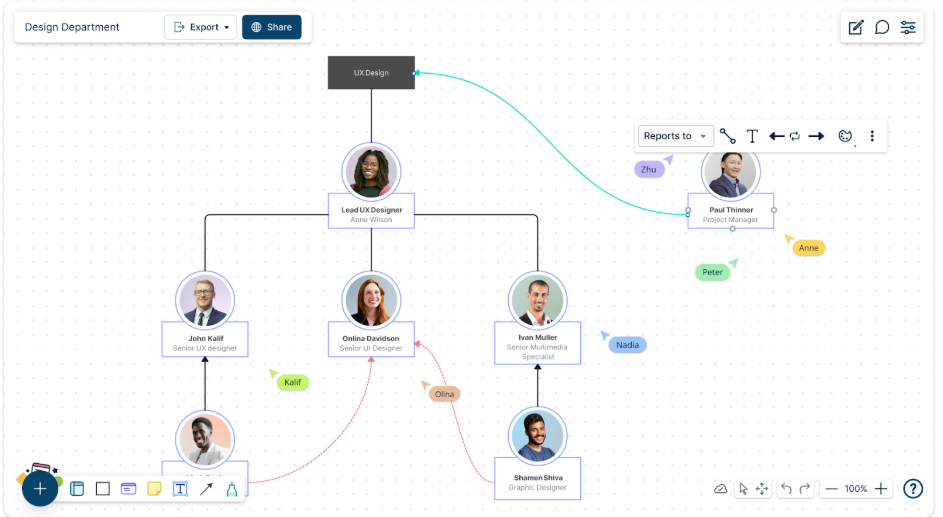
Resource Allocation Overview: Create visual representations of who’s responsible for what, when they’re available, and how their workload is distributed across the project timeline. Team organizational charts with clear reporting structures and role definitions help everyone understand accountability and communication flows.
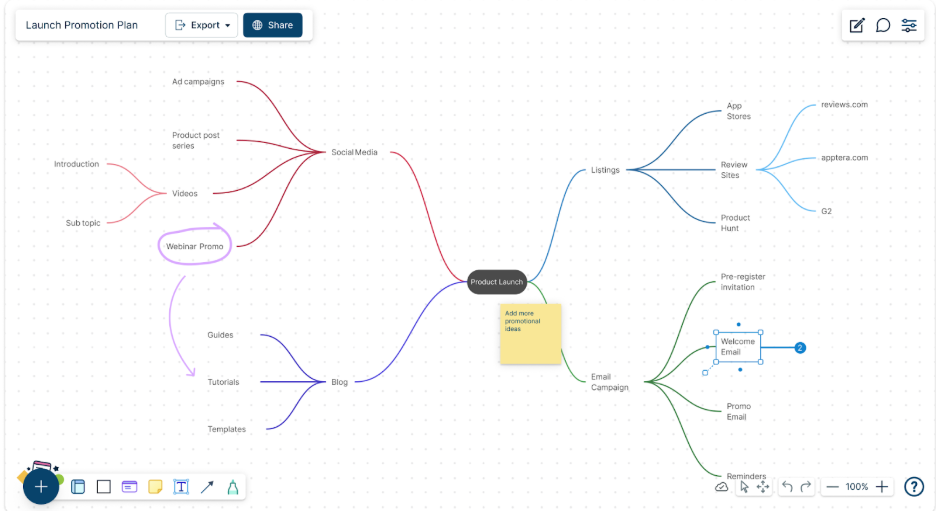
Implementation Strategy: Use mind mapping techniques to start broad and drill down into specifics. Begin with major project phases as main branches, then add deliverables, tasks, and finally individual actions. The visual hierarchy helps team members understand their role in the larger context.
Modern platforms allow you to create comprehensive launch planning visualizations that show all campaign elements, promotional channels, and content strategies in a single, interconnected view. This bird’s-eye perspective reveals opportunities for synergy and helps identify potential gaps in your project approach.
Step 3: Design Your Visual Timeline and Scheduling System
Visual scheduling goes far beyond traditional Gantt charts. While timelines are important, modern visual project management incorporates multiple perspectives on scheduling and progress tracking.
Multi-View Timeline Approach:
- Gantt charts for detailed task scheduling and dependencies
- Calendar views for milestone and deadline tracking
- Kanban boards for workflow status visualization
- Burndown charts for progress measurement
Interactive Timeline Features: Make your timelines interactive so team members can click through to see task details, add comments, or update status. This turns static planning documents into dynamic collaboration tools.
Milestone Visualization: Create clear visual markers for key project milestones. Use distinctive shapes, colors, or icons that make these critical points stand out in your timeline view.
Real-World Application: I worked with a marketing team launching a new product where we created a visual timeline that showed not just when tasks were due, but also when content needed to be created, reviewed, approved, and published. The visual flow helped identify a two-week gap between content creation and final approval that would have delayed the launch. By seeing this visually, we were able to adjust the timeline and still hit our target date.
Step 4: Establish Visual Workflow and Process Management
Effective visual project management requires clear, visual representations of how work actually gets done. This step focuses on mapping and optimizing your team’s workflows.
Process Flow Documentation: Create flowcharts that show exactly how work moves through your team. Include decision points, approval processes, and hand-off procedures. This visual documentation becomes your team’s playbook for consistent execution.
Status Tracking Systems: Implement visual status indicators that everyone can understand at a glance:
- Red/Yellow/Green status indicators
- Progress bars for percentage completion
- Priority levels using visual symbols
- Workflow stage indicators (To Do, In Progress, Review, Complete)
Automation Integration: Map out where automated processes fit into your workflows. Visual representations help identify opportunities for automation and show team members what happens “behind the scenes.”
Quality Control Checkpoints: Visualize quality gates and approval processes within your workflow. This helps prevent work from moving forward before it meets standards and reduces rework later in the project.
Step 5: Implement Visual Communication and Collaboration
Visual project management isn’t just about creating charts—it’s about fostering better collaboration through visual means.
Real-Time Collaboration Features: Use platforms that allow team members to collaborate on visual documents simultaneously. Features like live cursors, real-time updates, and collaborative editing ensure everyone stays current with the latest project information.
Visual Feedback Systems: Implement comment systems that allow team members to provide feedback directly on visual project documents. This contextual feedback is more effective than separate email threads or meeting discussions.
Meeting Enhancement: Transform your project meetings using visual aids:
- Start with a visual project dashboard showing current status
- Use screen sharing to review and update project visuals collaboratively
- End meetings by updating visual documents with decisions and action items
Stakeholder Communication: Create different visual views for different audiences. Executives might need high-level dashboards, while team members need detailed workflow views. The same underlying data presented visually in different formats serves different needs.
Documentation and Knowledge Management: Visual project management creates a natural documentation system. Project decisions, changes, and progress are captured in visual formats that are easier to reference and understand than traditional text-based documentation.
Step 6: Monitor, Measure, and Optimize Through Visual Analytics
The final step involves creating systems for ongoing project monitoring and continuous improvement through visual data representation.
Performance Dashboard Creation: Build dashboards that show key performance indicators (KPIs) visually:
- Timeline adherence and schedule variance
- Budget utilization and forecasting
- Resource allocation and utilization rates
- Quality metrics and defect tracking
- Team productivity and velocity measurements
Predictive Analytics Visualization: Use visual trend analysis to predict potential issues before they become problems. Charts showing velocity trends, resource burndown rates, and milestone progress can highlight areas needing attention.
Retrospective Analysis: At project completion, create visual summaries that capture lessons learned, successful strategies, and areas for improvement. These visual retrospectives become valuable resources for future projects.
Continuous Improvement Integration: Establish regular review cycles where team members can suggest improvements to visual project management processes. Visual feedback collection (using techniques like dot voting on improvement ideas) makes this process more engaging and effective.
Essential Tools and Platforms for Visual Project Management
Based on my extensive experience with various platforms, here are the key capabilities you should look for in visual project management tools:
Core Platform Requirements
Collaborative Diagramming Capabilities Your platform should support multiple diagram types including flowcharts, organizational charts, mind maps, and network diagrams. Look for tools that offer extensive template libraries and the ability to create custom shapes and symbols.
Real-Time Collaboration Features Multiple team members should be able to work on the same visual documents simultaneously, with changes visible immediately. Features like live cursors, user presence indicators, and collaborative editing are essential.
Integration Capabilities The best visual project management platforms integrate with existing tools like project management software, communication platforms, and file storage systems. This integration prevents information silos and maintains workflow continuity.
Data Connectivity and Visualization Advanced platforms can connect to external data sources and create dynamic visual representations. This means your project visuals stay current with real-time data from other systems.
Specific Feature Recommendations
Template Libraries and Customization Look for platforms offering extensive template libraries for common project management scenarios. The ability to create custom templates based on your organization’s specific needs is equally important.
Version Control and History Visual documents evolve throughout a project. Platforms with robust version control allow you to track changes, revert to previous versions, and understand how project plans have evolved over time.
Export and Sharing Options Your visual project documents should be easily shareable with stakeholders who may not have access to the primary platform. Look for tools that offer multiple export formats and public sharing options.
Mobile Accessibility Project management doesn’t stop when you leave your desk. Ensure your chosen platform offers mobile apps that maintain functionality for viewing and basic editing of visual project documents.
Common Visual Project Management Mistakes to Avoid
Through years of implementation experience, I’ve observed several recurring mistakes that can undermine visual project management effectiveness:
Over-Complicating Visual Representations
The goal is clarity, not complexity. Avoid creating visual documents that require extensive explanation. If team members can’t understand a diagram within 30 seconds, it’s probably too complex.
Neglecting Regular Updates
Visual project documents are only valuable when they reflect current reality. Establish clear processes for keeping visual information current, and assign specific individuals responsibility for updates.
Creating Information Silos
Don’t let visual project management become another separate system. Ensure your visual documents integrate with and enhance your existing project management processes rather than replacing them entirely.
Ignoring Team Training and Adoption
Even the best visual project management system fails without proper team adoption. Invest time in training team members on both the tools and the visual thinking principles behind effective visual project management.
Focusing on Tools Over Process
Remember that visual project management is fundamentally about improving communication and collaboration. Don’t let tool selection and configuration overshadow the underlying process improvements you’re trying to achieve.
Measuring Success: KPIs for Visual Project Management
To validate the effectiveness of your visual project management implementation, track these key metrics:
Time-Based Metrics
- Project delivery timeline adherence
- Time spent in project meetings
- Decision-making cycle time
- Issue resolution speed
Communication and Collaboration Metrics
- Reduction in clarification requests
- Increased team engagement in project activities
- Improved stakeholder satisfaction scores
- Decreased project change requests due to misunderstandings
Quality and Efficiency Metrics
- Reduction in rework and project errors
- Improved resource utilization rates
- Enhanced team productivity measurements
- Better project predictability and forecasting accuracy
Advanced Techniques for Complex Projects
For larger, more complex projects, consider these advanced visual project management techniques:
Multi-Level Project Visualization
Create hierarchical views that allow stakeholders to zoom in from high-level project overviews to detailed task information. This approach serves different information needs while maintaining overall project coherence.
Cross-Functional Workflow Integration
Visualize how your project interfaces with ongoing organizational processes. This broader view helps identify potential conflicts and optimization opportunities beyond your immediate project scope.
Risk Visualization and Scenario Planning
Develop visual risk assessment frameworks that show potential project scenarios and their impacts. Interactive risk visualization helps teams understand and prepare for various project outcomes.
Portfolio-Level Visual Management
For organizations managing multiple projects, create visual dashboards that show relationships and dependencies between projects. This portfolio view enables better resource allocation and strategic decision-making.
The Future of Visual Project Management
As artificial intelligence and automation continue evolving, visual project management is becoming even more powerful. AI-powered platforms can now automatically generate project visuals based on text descriptions, predict project outcomes through visual analytics, and suggest optimizations through intelligent visual recommendations.
The key is starting with solid visual project management fundamentals and then incorporating advanced capabilities as your team becomes more comfortable with visual thinking approaches.
Taking Action: Your Next Steps
Visual project management transformation doesn’t happen overnight, but the benefits begin immediately. Here’s how to start:
- Begin with your next project: Choose a medium-complexity project to test visual project management techniques without overwhelming your team.
- Start simple: Focus on basic visual representations before adding advanced features and integrations.
- Involve your team: Make visual project management adoption a collaborative effort rather than a top-down mandate.
- Measure and adjust: Track the metrics that matter to your organization and adjust your approach based on results.
- Scale gradually: As your team becomes comfortable with visual project management, expand to larger projects and more sophisticated techniques.
The shift to visual project management represents more than just a new tool or technique; it’s a fundamental change in how teams collaborate and communicate. When implemented thoughtfully, visual project management doesn’t just make projects faster; it makes them more engaging, more transparent, and more successful overall.
The teams that embrace this visual transformation today will be the ones setting the pace for project delivery tomorrow. The question isn’t whether visual project management will become standard practice, it’s whether your team will be leading the change or catching up later.
About the Author: Alex Carter is a digital solutions expert with extensive experience in AI-powered SaaS, programming, and automation. He specializes in helping teams leverage visual collaboration tools to streamline workflows and accelerate project delivery. Connect with Alex at https://www.booststash.com/alex-carter/ for more insights on digital transformation and project management optimization.