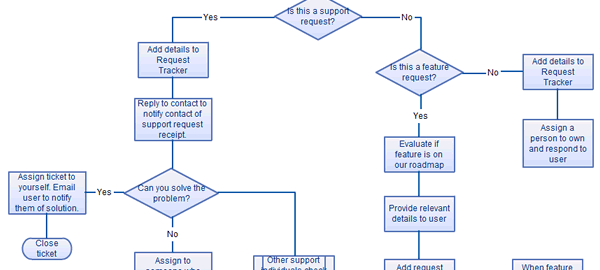
Whatever opinion you may have of Napoleon Bonaparte, the emperor did once say “Un bon croquis vaut mieux qu’un long discours,” or “A good sketch is better than a long speech”. We’re inclined to agree. I mean what do you… Read More


Whatever opinion you may have of Napoleon Bonaparte, the emperor did once say “Un bon croquis vaut mieux qu’un long discours,” or “A good sketch is better than a long speech”. We’re inclined to agree. I mean what do you… Read More
While the Dev team’s been busy on the next major release in a week’s time (which will include brand new collaboration features), I’ve compiled a massive set of easy-start templates that you can dig into right now. We know you… Read More

Flowcharting is all about drawing simple and easy-to-understand diagrams illustrating the logical sequence in a process. Flowcharts help you communicate and document how processes work; and mapping out the logical steps in a process also helps you figure out ways… Read More
At Creately we are all about increasing project efficiencies with Visual aids. We help other companies be more effective using visual tools, and now we are kicking off a series to share some insights. Over the next few weeks we… Read More

My mom is diabetic, and each time I take her to the clinic for her quarterly check-ups, the physician asks me to monitor her blood sugar levels regularly. She often tells us how serious diabetes is although it is very… Read More