Deployment diagrams are one of the Unified Modeling Language models. Deployment diagrams would illustrate a set of nodes and their respective relationships. These nodes are described as being physical entities where the components are deployed. Deployment diagrams are used for visualizing the… Read More
Category Archives for : Meeting & Visual Collaboration
Our users add thousands of diagrams to the community everyday and we frequently come across good diagrams that can become great diagrams with some simple tweaks. Do you want to create beautiful diagrams that stands out from the rest? Then keep… Read More
Although mostly used in mathematics there are many other usages for Venn diagrams. Everyday hundreds of Venn diagrams are created by our Venn diagram maker and below are some creative Venn diagrams from our diagramming community. One creative way to… Read More
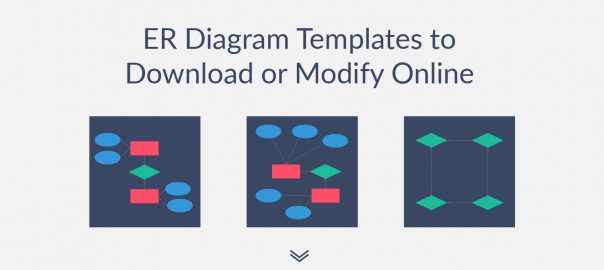
An ER diagram is a systematic way of describing and defining a business process. The process is modeled as components that are linked to each other by relationships that express the dependencies and requirements between them. The ER diagram templates below cover many… Read More
Fishbone (aka Cause and effect/Ishikawa) diagrams are great for analyzing processes and identifying defects in them. They are a great way to visualize causes and their effects. Fishbone diagrams are used in many industries but primarily they’re used in manufacturing,… Read More
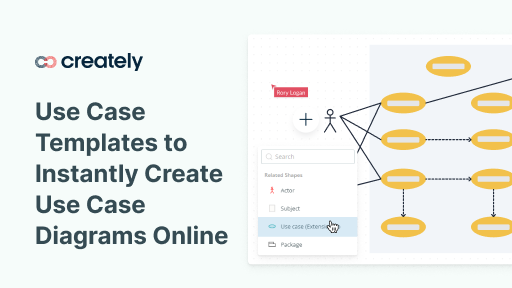
A use case diagram is a great way to visualize the different users involved in a system and how those users interact with the system. There are many use case templates covering many scenarios listed down in this article. Navigate… Read More