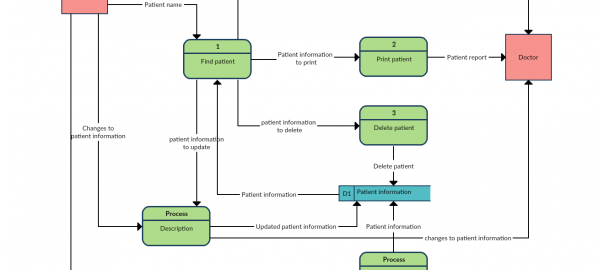
A data flow diagram (DFD) explains the relationship among different components of a system by showing the flow of data (from which external entities data is coming from, where data will go and where data will finally be stored in)… Read More
A data flow diagram (DFD) explains the relationship among different components of a system by showing the flow of data (from which external entities data is coming from, where data will go and where data will finally be stored in)… Read More
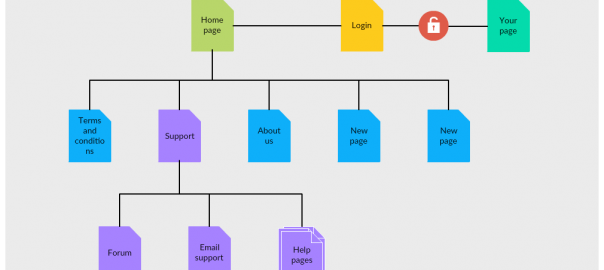
A sitemap is a tool that can be used to visualize the structure of a website. While it lists the web pages or the content of a website, it helps you identify the information your website should consist of, remove… Read More
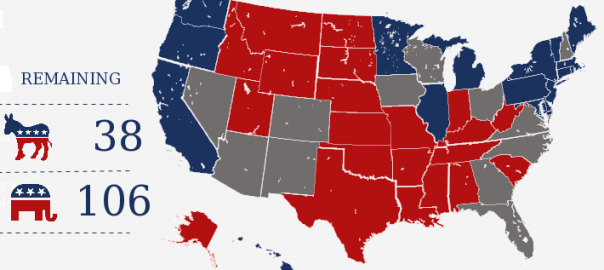
It’s an undisputed fact that the human brain processes images a lot faster than words and this is particularly true when it comes to illustrating complicated data. Visually representing large amounts of data in an infographic allows it to be… Read More
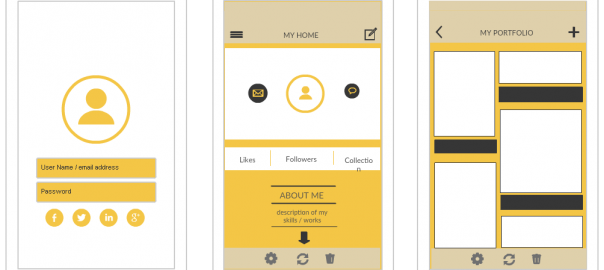
Have you tried our new iPhone mockup templates yet? Have a look at our new iPhone mockup tool to create professional looking prototypes. Creately has some unique and productive features that will help you create iPhone mockups amazingly fast. Whether you’re designing… Read More

Online meetings are a necessity nowadays as a plethora of companies have expanded their presence across the globe and offer flexible work-from-home and freelance positions. With teams spread out, online meetings are needed to ensure tasks that require collaboration like… Read More
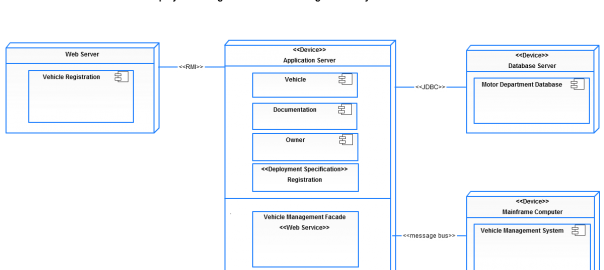
Deployment diagrams are one of the Unified Modeling Language models. Deployment diagrams would illustrate a set of nodes and their respective relationships. These nodes are described as being physical entities where the components are deployed. Deployment diagrams are used for visualizing the… Read More