How to Create Venn Diagrams Easily Using Creately
d

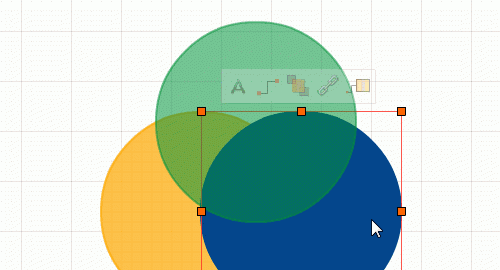
Venn diagrams are a great way to show relationships between sets. They are heavily used in maths but as of late have become a diagram of choice for memes as well. Creately has some excellent tools to help you create Venn diagrams with amazing ease.

If you are in a hurry, here’s a quick video on how to draw a Venn diagram in minutes. Start with these Venn diagram templates.

1. Creating the Venn Diagram

Let’s start drawing with a basic Venn diagram. Click on the below image and we’ll open the diagram for you in our online editor.

Venn-diagram-template
Click on the image to draw a Venn Diagram

Don’t worry about creating 3 circle Venn diagrams, 4 circle Venn diagrams, etc. because you can easily add more circles with Plus create or by just dragging and dropping.

Once you’re in the editor select the text boxes “Set A” and “Set B” and name them the way you want. Click on the circles to add text on them. You can add more data to your Venn diagram by adding more textboxes or by using shape data where you can as much additional information as needed including links, images, notes, etc. to your Venn diagram.

2. Adding Colors to the Venn Diagram

If you want to change the color of an object, select the object and click “Styles” on the contextual toolbar to instantly apply a color.

Additionally, you can also visit Shape Properties on the right-side panel and apply any custom color using the color picker. You can use rainbow colors, for classroom work or memes and flat colors for professional work. Sticking to one theme will give your Venn diagram a more professional look.

3. Adding More Circles/Sets

If you want to add more sets to your Venn diagram, click on the plus (+) icon on the sides of the shape to automatically add an additional circle to the diagram. You can also drag and drop a circle object from the “Simple Shapes” library to the left.

It should be the first library by default, but in case it’s not there, load it using the “Find More Items” on the shape panel.

When drawing logical relationships between finite sets, there are a few types of Venn diagrams you can use.

  • 2-set Venn diagram is made up of 2 overlapping circles. And they are used to visualize the relationship between two sets.
  • 3-set Venn diagram is made up of 3 overlapping circles. And they are used to visualize the relationship between three sets.
  • 4-set Venn diagram is drawn to visualize the relationship between four sets.

4. Use “No Fill” for Blank Circles

Sometimes, you don’t want fancy colors in your Venn diagram. You just want a blank Venn diagram to add your data. Don’t worry we got you covered. Click on the Style option on the contextual toolbar and select a line style instead of a color fill style and you’re good to go.

When you don’t want fancy colors and just want blank circles

5. Using “Fade” to Add Transparency

The image displays it well. You can use this to make an object transparent and show what’s behind that object. Notice how the colors of the intersections change when applying the fade? This allows you to show natural color combinations without picking and choosing colors for each intersection.

6. Create Venn Diagrams with Images

Venn diagrams are a popular choice for memes. Even if not for memes, adding images to your Venn diagram can enhance it further. With any other software, you need to find an image and then upload the image to add it to your diagram. With Creately it’s just a matter of dragging and dropping.

Search for any image in Google using the built-in Google image search option. You can search for your image by name and drag and drop it to your Venn diagram. The below image shows how it works.

Built-in Google Image Search

We sincerely hope you like our toolset provided to create Venn diagrams online. If you have any questions do ask them in the comments section or simply contact support. In the meantime, have fun creating awesome Venn diagrams.

Storyboard Templates with Unique Designs, Download for Free

Students love lessons with graphic organizers, and when the graphic organizer in question is a storyboard, they love it even more! They are naturally attracted to storyboards because they love drawing things. But they also help students organize their ideas and present them in an orderly manner. We added some colorful and eye-catching storyboard examples for students and kids to help you along the way.

A Completed Storyboard Template

Below is an already completed storyboard for kids. You can use it as a template and change the images and text. With our import features and integrated Google images search, creating a graphic rich storyboard is very easy and won’t take a long time.

Mickey the Mouse Storyboard
Click on the image to use this as your storyboard template (opens in new tab)

Storyboard Templates as PDF Downloads

We added some beautifully designed graphics rich storyboard examples for students here. But we understand that sometimes you just want to download a blank template and get it printed. That is why we have added two print-ready storyboard templates as PDF downloads. They are in A4 portrait and A4 landscape formats so no need of adjustments from your end. Right click on the link and choose “Save Link as..” to save it in your preferred location.

Storyboard Template ( A4 Landscape ) – PDF

Storyboard Template (A4 Portrait) – PDF

Colorful Storyboard Templates

Colors and fancy arrows make your storyboard attractive and encourage kids to contribute more. Below is a blank storyboard template that will help the kids start instantly. Prefer another color for your storyboard? With our 2-click styling function, it takes only seconds to change the colors.

Colorful Storyboard Templates
Colorful storyboard template available at Creately. You can change the colors in seconds using our 1-click styling feature.

Storyboard Templates with Attractive Images

A storyboard has two basic things; an area for visuals and some text lines to explain the visuals. A word document with boxes and lines will do the trick, but what it won’t do is, delight and excite students. That’s one reason why we added graphics to some of our storyboard templates. Also, the visual aids are in different sizes and shapes. No two visuals carry the same details, with Creately you can change the sizes to exactly fit your visual.

Storyboard template with graphics and different size visual boxes
Encourage participation by adding graphics to your storyboard template

Storyboard Template With a Difference

Storyboards are about organizing ideas and presenting them in an orderly manner. It doesn’t always have to be arrows pointing to boxes. So we came up with some unique storyboard layouts of our own. We sincerely hope you would love them.

Storyboard template with a unique layout
Template with a unique design and graphic

SpongeBob Squarepants Missing Identity Storyboard

Who doesn’t love SpongeBob SquarePants? This SpongeBob SquarePants’ storyboard template gives a brief summary of the episode where SpongeBob almost loses his mind over losing his identity tag. A storyboard like this is great to have by your side when you are relating a story to your students. It will help them follow the sequence of the story easily while enjoying it at the same time.

SpongeBob Squarepants Missing Identity Storyboard
SpongeBob Squarepants Missing Identity Storyboard (click on image to use as a template)

Storyboard template to translate an idea into a visual story

The best way to make sure that your students understood the lesson you just taught them is to get them to express the ideas they have about the topic. What better way to encourage them to express their ideas than to get the kids to translate the ideas into a visual story in a sequence.  A storyboard template like this is a great way to get them to be more excited about being expressive.

Storyboard templates to translate an idea
Storyboard template to translate an idea into a visual story (click to use as a template)

Storyboard template for students

Here is a simple storyboard template that you can use with your students. You can use this to test their knowledge on the lessons you taught them by getting them to visually express their ideas. Or you can also simply incorporate this in a little fun activity where you can encourage your students to tell a story. They all love telling stories!

Storyboard template for students
Storyboard template for students (click on image to modify online)

Woodcutter and His Axe Storyboard Template

Kids love to listen to stories just as much as they love to tell them. This storyboard for kids relates the story of the woodcutter and his axe. Using the Creately editor you can quickly change the images and the text and use the template to relate any other story you or your students like.

Woodcutter and His Axe Storyboard Template
Woodcutter and His Axe Storyboard Template (click on image to modify online)

Shown above are some of the storyboard templates available at Creately. Visit our diagram community to check out more Storyboard examples.

More Diagram Templates

The Power of Venn Diagrams

Ever thought of organizing complex relationships visually? One of our previous posts talked about Mind Maps for Effective Business Thinking. It discussed how helpful Mind Maps are for visual arrangement of ideas. If you haven’t read it yet, just read now.

This time, we thought we’d discuss something similar using the concept of Venn diagrams. With the help of Venn Diagrams you can arrange all your abstract ideas easily. They’re useful to make comparisons between groups of things. Venn diagrams are commonly used for solving Math problems which demand logical thinking and deductive reasoning, thus Venn acts as an important tool in K-12 Education. Venn doesn’t just restrict its use to classroom learning, but also used extensively in other disciplines. Its a great tool for organizing, evaluating and representing complex relationships visually; and an accepted practice too.

Venn is a type of graphic organizer which consists of overlapping circles. Some even refer to it as the Overlapping Circles Chart. Now, how easy is it to draw circles? Drawing circles is not real easy, it gets even harder when you have to keep re-drawing them large enough to accommodate text that fill in the circles and intersecting areas. But, we’ve got an amazing solution – an online Venn Diagram Maker.

Creately is a great tool for creating illustrative Venn diagrams in minutes. Creately is preloaded with ready to use Venn Diagram Templates, you can now simply pick your favourite template and start filling in the text to demonstrate logical relationships visually. Now, wait a minute… Are you not happy with the available ready-made templates? No problem, just make your overlapping circles chart in minutes by using the basic shapes from the Creately’s library. Don’t miss out Creately’s 1-click preset professional colour themes to give your Venn diagrams beautiful and presentable colours! We’ve compiled a collection of quick and simple Venn diagrams to illustrate logical relationships from various disciplines. Take a spin and let us know if this was useful!

1) Perspectives of a Project Failure

2) Understanding Slavery

3) Choosing a Blogging Platform

4) My School Life

5) Watch your Health

6) Tools for Diagramming

7) Math Euler Diagram

8 ) Student Interaction

9) Twitter Tools

10) Observing Student Behaviour

Creately Examples: Understanding Diabetes with a KWL Graphic Organiser
Colorful KWL chart template

My mom is diabetic, and each time I take her to the clinic for her quarterly check-ups, the physician asks me to monitor her blood sugar levels regularly. She often tells us how serious diabetes is although it is very common and manageable. However, I wondered if the physician was only exaggerating about the subject to make us more cautious.

Well, having a family member with diabetes, I thought its essential to expand my knowledge on this topic. Thus, I did a bit of self reading and figured out some interesting facts and figures about diabetes; I decided to pick a few important notes and presented them in this KWL (Know-Want-Learn) chart.

In Creately we have a whole bunch of ready-made graphic organizers which makes life so easy. Hence, I pulled out a KWL template from the Creately dashboard to present the information I thought is essential in understanding Diabetes.

Hope you find this interesting!

understanding-diabetes-KWL-graphic-organiser