Graphic organizers combine text and visuals, making them a scientifically proven tool for effective teaching and learning. They are highly beneficial for teachers and students alike, helping to create more engaging lessons and enhancing comprehension. Below, we’ve outlined different types of graphic organizers that you can use in various scenarios—whether it’s reading, writing, conducting research, or preparing for exams. The types of graphic organizers below include a ready-to-use template to get you started instantly.
What Is a Graphic Organizer?
A graphic organizer is a visual tool that helps organize information, making it easier to understand and remember. It shows how different ideas are connected, which helps learners of all ages. Graphic organizers are useful for simplifying complex ideas, encouraging deep thinking, and helping people connect new knowledge with what they already know. They support different learning styles and improve understanding and memory. Want to learn more? Dive into our complete guide on What is a Graphic Organizer for definitions, practical uses, steps, and ready-to-use templates.
How to Choose the Right Type of Graphic Organizer
Choose the organizer based on the task you want to support:
- Use compare-and-contrast organizers like double bubble maps and Venn diagrams when learners need to spot similarities and differences.
- Use sequencing organizers like sequence charts and timelines when order, chronology, or process matters.
- Use reading and writing organizers when learners need help breaking down stories, arguments, research, or essays.
- Use brainstorming organizers like mind maps, cluster diagrams, and KWL charts when the goal is idea generation and exploration.
- Use teaching and learning organizers when you want to simplify a concept, clarify relationships, or support retention.
Types of Graphic Organizers
Here we have listed 20 types of graphic organizers for teaching and learning. Based on their varied purposes, you can utilize them in reading, writing, researching, brainstorming, and analyzing.
Types of Graphic Organizers to Compare and Contrast
Types of graphic organizers for comparing and contrasting help students visually show the similarities and differences between two or more items, ideas, or concepts. These tools make comparison easier by organizing key details in a clear and structured way.
1. Double bubble map
A double bubble map is a type of graphic organizer used to compare and contrast two things. It looks similar to a Venn diagram but has a unique structure. Two main bubbles represent the topics being compared, with differences written in separate bubbles around each topic. Similarities are shown in bubbles that connect both topics in the middle.
Template


How to use a double bubble map
- Write the topics: Start by writing the two topics you’re comparing in two bubbles at the center.
- Add the differences: Think about how each topic is unique and list those differences in bubbles branching out from each main topic.
- Find the similarities: Identify what the two topics have in common and write those in bubbles that connect the two central bubbles.
Benefits of a double bubble map
- It helps organize similarities and differences in one place, making it easier to analyze two topics.
- The visual layout makes information more understandable, especially for complex ideas.
- It helps you think deeply about the relationships between two ideas.
- This tool is great for students, teachers, and even professionals who need to compare options or analyze data.
Who can use it
- Students – To compare and contrast two ideas, concepts, or topics.
- Teachers – To facilitate discussions and comparisons in class.
- Researchers – To analyze similarities and differences in data or theories.
- Writers – For organizing and contrasting different points of view or themes.
- Business professionals – To compare products, services, or strategies.
2. Venn diagram
A Venn diagram is a popular type of graphic organizer used to visually compare and contrast multiple topics. It uses overlapping circles to show relationships between different sets of information. Each circle represents a topic, with the overlapping areas showing what the topics have in common, while the non-overlapping parts highlight their unique traits. Unlike the double bubble map, you can create a Venn diagram to compare more than two topics.
Template

How to use a Venn diagram
- Draw and label the circles: Start by drawing two or more overlapping circles, depending on how many topics you are comparing. Write the name of each topic above its respective circle.
- Add unique traits: Inside each circle, in the sections that don’t overlap, list the traits or characteristics unique to that topic.
- Identify commonalities: In the overlapping areas of the circles, write the similarities or shared features between the topics.
Benefits of a Venn diagram
- It provides a clear way to see how topics are alike and how they are different, all in one visual representation.
- A Venn diagram can compare two or more topics, making it useful for various subjects, from school lessons to business strategies.
- By analyzing similarities and differences, users develop a deeper understanding of the relationships between ideas.
- The visual format makes it easier to process and remember information.
Who can use it
- Students – To compare and contrast different concepts or ideas.
- Teachers – To help explain similarities and differences in lessons.
- Researchers – For analyzing relationships between sets of data or variables.
- Writers – To explore and organize different themes or arguments.
- Business professionals – To compare market trends, products, or business strategies.
Types of Graphic Organizers for Writing
Graphic organizers for writing are tools that help students plan and organize their ideas before they start writing. These types of graphic organizers provide a visual structure for organizing thoughts, which makes the writing process clearer and more manageable.
3. Persuasion map
A persuasion map is a tool that helps students plan their persuasive writing. It guides them step by step, making sure their arguments are logical and supported by reasons and evidence. This map is useful for essays, speeches, or debates. It breaks down persuasive writing into simple steps, starting with the main argument and expanding into supporting reasons and evidence, leading to a conclusion. By organizing ideas visually, students can see how their points connect and spot any gaps in their arguments.
Template

How to use a persuasion map
- Choose a topic: Select a topic you’re passionate about or need to write about. Research the topic thoroughly to gather enough information to support your argument.
- State your claim: Begin your persuasion map by writing down the main argument or claim you want to make. This is the central idea of your essay or speech.
- Add supporting reasons: Around the claim, write down the key reasons that support it. These reasons should explain why your argument is valid or important.
- Provide evidence: For each reason, list facts, examples, data, or any other evidence that backs up your point. This strengthens your argument and makes it more convincing.
- Write the conclusion: End your map by summarizing your argument and reinforcing your claim with a strong conclusion.
Benefits of a persuasion map
- It provides a clear outline of your argument, making it easier to plan and write persuasively.
- The map encourages you to think critically about the connections between your claim, reasons, and evidence.
- By structuring your argument beforehand, you can ensure your essay or speech is coherent and compelling.
- With a clear plan in place, you can present your ideas more confidently in debates or discussions.
- The persuasion map works for essays, speeches, debates, and even presentations, making it a valuable tool for various scenarios.
Who can use it
- Students – To plan and organize persuasive essays or speeches.
- Teachers – To guide students in developing strong arguments and supporting evidence.
- Writers – To structure persuasive content or arguments effectively.
- Debaters – To outline points and counterpoints in a debate.
- Marketers – To plan persuasive marketing strategies or campaigns.
4. Sequence chart
A sequence graphic organizer is a visual tool used to arrange events, steps, or ideas in a specific order. It’s especially helpful when you need to understand or explain how a process unfolds or how events are connected over time. This type of organizer can take various forms, such as flowcharts, timelines, or step-by-step diagrams, depending on the type of information you’re organizing.
Template

How to use a sequence graphic organizer
- Identify the process or event: Choose the process or timeline you want to visualize. For example, it could be the life cycle of a butterfly, the steps of a recipe, or the events in a story.
- List the steps or events: Write down the key steps or events in the correct order. If necessary, research or gather information to ensure accuracy.
- Organize visually: Use a sequence chart or diagram to arrange the steps in chronological order or based on the flow of the process. Make sure each step connects logically to the next.
Benefits of a sequence graphic organizer
- Makes complex processes or timelines easier to understand by presenting information step by step.
- Great for lesson planning, essay writing, or outlining projects, helping organize ideas logically.
- The visual format helps learners remember the sequence of events or steps more effectively.
- Can be adapted for various uses, such as tracking historical events, brainstorming projects, or solving problems.
Who can use it
- Students – To outline steps in a process or events in a story.
- Teachers – To help students understand the order of events or procedures.
- Writers – To structure narratives or explain processes.
- Researchers – To organize steps in research or experiments.
- Business professionals – To plan project steps or workflows.
Types of Graphic Organizers for Reading
Graphic organizers for reading help students understand and analyze texts better. These types of graphic organizers offer visual ways to organize information, making key ideas and details easier to grasp. These organizers break down information, highlight relationships, and help students remember key points, boosting reading comprehension.
5. Story map
A story map graphic organizer is designed to help readers break down and understand the key elements of a story. It visually represents aspects like characters, plot, themes, setting, conflicts, and resolutions, making it easier to analyze and comprehend a book or narrative. Story maps are often used in classrooms as an interactive tool that engages students and encourages them to think critically about the stories they read.
Template

How to use a story map
- Read and understand the story: Start by reading the book or story carefully. Make sure you grasp the main ideas and events.
- Identify key elements: Discuss the significant components of the story, such as the characters, setting, problem, solution, themes, and techniques. Write these down in the relevant sections of the story map.
- Fill in the map during discussions: As you explore the story, jot down details in the story map. For example, list characters and their roles, describe the setting, outline the plot, and highlight the main conflict and resolution.
- Discuss each element in depth: Once the map is complete, go over each section. Analyze how these elements contribute to the overall story and connect to each other.
Benefits of a story map
- Breaking down a story into key parts helps students understand its meaning.
- Students learn to see how characters, plot, and themes work together.
- Visual maps help students remember story details and structure.
- Story maps can kick-start group discussions and analysis.
- They can be simplified for younger students or made more complex for older ones, making them a flexible tool.
Who can use it
- Students – To organize and understand story elements like characters, setting, plot, and conflict.
- Teachers – To guide students in analyzing and understanding the structure of stories.
- Writers – To outline and plan the key elements of a story.
- Literary analysts – To break down and analyze different parts of a narrative.
- Storytellers – To plan and structure oral or written stories.
6. Biography graphic organizer
A biography graphic organizer is a helpful tool for understanding and analyzing the life of a person—whether it’s a character from a novel, a historical figure, or someone featured in an autobiography or movie. It organizes key details about their life, achievements, challenges, and impact, making it easier to connect the dots and gain a deeper appreciation of their story. This visual tool is particularly useful for students and researchers who want to break down complex information and present it clearly.
Template

How to create it
- Gather information: Collect details from books, articles, online sources, or experts.
- Highlight key facts: Focus on important or unique aspects of the person’s life, such as milestones and achievements.
- Organize visually: Use the graphic organizer to structure the information, with sections for key details, achievements, challenges, etc. Add images or symbols for clarity.
Benefits of a biography graphic organizer
- Breaking down a person’s life into sections helps students understand key events and their impact.
- Analyzing milestones and challenges shows how decisions shaped their life.
- Visual organization makes complex details easier to understand and connect.
- Adding images makes the process more engaging and enjoyable for learners.
Who can use it
- Students – To organize and present key facts and events in someone’s life.
- Teachers – To help students outline and structure biography projects.
- Researchers – To collect and organize biographical data for research purposes.
- Writers – To map out important milestones and achievements in a person’s life for writing purposes.
- Historians – To organize historical figures’ life events for analysis or presentation.
7. KWL chart
The KWL chart is a helpful graphic organizer that helps students connect what they already know to new information. It has three columns: “K” for what they Know, “W” for what they Want to know, and “L” for what they Learn after studying the material. Creating a KWL chart helps students set learning goals and reflect on what they have learned once the lesson is complete.
Template

How to use it
- Brainstorm what you already know (K column): Have students think about what they already know about the topic. This allows them to tap into their prior knowledge and begin the lesson with a sense of confidence.
- Generate questions about what you want to know (W column): Ask students to write down questions they have about the topic or what they are curious to learn. This sets clear goals for the lesson and piques their interest.
- Reflect on what you’ve learned (L column): After completing the lesson or reading, students answer the questions from the W column and fill in the L column with the new information they’ve gained. This helps them consolidate their learning and see how much they’ve progressed.
Benefits of a KWL chart
- The K column helps students remember what they already know, making it easier to connect with new information.
- The W column sets clear learning goals and sparks curiosity, giving students something to focus on.
- The L column lets students reflect on what they’ve learned, helping them spot any gaps in knowledge.
- By writing their thoughts and questions, students become more involved in their learning.
- The KWL chart can be used at the start, middle, and end of a lesson, making it flexible for different learning needs.
Who can use it
- Students – To organize what they know, want to know, and learn about a topic.
- Teachers – To assess prior knowledge and track learning progress.
- Parents – To guide children’s learning at home by identifying what they’ve learned.
- Researchers – To structure initial ideas and refine focus areas for a study.
- Educators – To engage students in active learning and reflection.
Types of Graphic Organizers for Teaching
Graphic organizers for teaching are visual tools that help educators plan and present lessons more effectively. These types of graphic organizers provide a structured way to organize information, making it easier for teachers to convey concepts clearly and for students to understand and engage with the material.
8. Learning map
Learning maps are useful tools that visually show the main concepts, skills, and ideas students need to understand from a lesson or course. They give an overview of the material, showing how different topics connect. By mapping out these connections, learning maps help students see how everything fits together. These maps help teachers organize lessons and also assist students in taking notes and remembering key information.
Template

How to use it
- Write the main topic in the center: Start by placing the main theme or topic in the middle of the learning map template. This is the starting point for everything related to the lesson.
- Brainstorm related ideas: Think of key ideas or subtopics related to the main topic. Write them on branches extending from the center. Arrange them logically for easy understanding.
- Connect the ideas: Use lines or arrows to link related ideas and label the connections to show how they are related (e.g., main ideas to supporting details, causes to effects).
Benefits of learning maps
- Learning maps show how concepts are connected, helping students understand the relationships between ideas.
- Breaking lessons into smaller, visual sections makes it easier to learn and remember complex material.
- Students can use learning maps to take notes, capturing key ideas and their connections without feeling overwhelmed.
- Visual aids help memory. By linking ideas, learning maps help students remember content long-term.
Who can use it
- Students – To visualize and organize their understanding of a topic.
- Teachers – To structure lessons and assess student progress.
- Researchers – To map out ideas and concepts for studies or projects.
- Educators – To facilitate active learning and improve concept retention.
- Parents – To help children with structured learning and concept reinforcement.
9. Analogy graphic organizer
An analogy graphic organizer helps students understand new concepts by comparing them to something they already know. This approach makes complex ideas more relatable and easier to grasp. By identifying similarities and differences between the two concepts, students can create connections, making the new material easier to understand and remember.
Template

How to use it
- Select a familiar topic: Choose a topic students know well, which shares characteristics with the new concept.
- Introduce the new concept: Present the new topic, providing background information for discussion.
- Brainstorm similarities and differences: Have students compare and contrast the two concepts using the organizer.
- Write a description: After completing the organizer, ask students to write a brief description of the new topic.
Benefits of analogy graphic organizers
- Builds connections by linking new ideas to familiar concepts, aiding understanding.
- Enhances critical thinking through comparison and analysis.
- Simplifies complex ideas by relating them to known topics.
- Improves memory retention by associating new information with familiar knowledge.
- Encourages engagement through active brainstorming and reflection.
Who can use it
- Students – To compare and contrast concepts by drawing analogies.
- Teachers – To help students understand complex ideas by relating them to familiar ones.
- Writers – To develop ideas or clarify concepts through analogies.
- Researchers – To illustrate relationships between different sets of data or concepts.
- Educators – To enhance critical thinking and make learning more relatable.
10. Vocabulary graphic organizer
A vocabulary graphic organizer is a helpful tool for teaching and learning new words. It allows students to break down and understand a word’s meaning by including key elements such as definitions, synonyms, and usage in context. This organizer can be used to strengthen vocabulary knowledge and deepen understanding, making it easier for students to remember and use new words effectively.
Template

How to use it
- Identify the vocabulary word: Write the word to be learned in the central space of the organizer.
- Define the word: Have students write the word’s definition in the “Definition” box.
- Provide synonyms: Offer synonyms of the word to build a deeper understanding of its meaning.
- Use in sentences: In groups, encourage students to create sentences using the word to practice applying it.
- Draw a picture: Allow students to draw an image related to the word or sentence to reinforce learning visually.
Benefits of vocabulary graphic organizers
- Promotes deeper understanding by breaking down a word’s meaning and its synonyms.
- Encourages active engagement through sentence creation and drawing.
- Enhances retention by connecting words with visuals and context.
- Improves communication skills as students practice using new vocabulary in sentences.
- Boosts confidence in using newly learned words in everyday conversation and writing.
Who can use it
- Students – To expand and reinforce their vocabulary through definitions, synonyms, and examples.
- Teachers – To help students learn and retain new words effectively.
- Language learners – To organize and remember new words in context.
- Writers – To find appropriate synonyms and better understand word meanings.
- Educators – To improve word comprehension and retention in various subjects.
11. Problem-solving organizer
A problem-solving graphic organizer is a tool that helps students break down and solve problems step by step. It guides them in identifying the problem, exploring different solutions, and evaluating the best course of action. This organizer allows students to visually map out their thought process, helping them make decisions based on logic and reasoning rather than just guessing.
Template

How to use it
- Identify the problem: Write the problem clearly in the problem box at the start of the organizer.
- Explain why it’s a problem: Have students describe why they think the issue is a problem, allowing them to better understand its impact.
- Brainstorm solutions: Students should list possible solutions along with their pros and cons. This helps them weigh the advantages and drawbacks of each option.
- Evaluate consequences: After selecting the best solution, students should identify potential consequences of that choice, which helps them anticipate any challenges.
- Suggest improvements: Encourage students to think about how they could improve their solution, making it stronger or more effective.
Benefits of using a problem-solving organizer
- Helps students approach problems systematically, breaking them down into manageable steps.
- By listing pros, cons, and consequences, students can make more informed decisions.
- The process encourages students to think critically, evaluate different solutions, and consider outcomes before acting.
- As students practice using the organizer, they develop stronger problem-solving skills that can be applied in various situations.
Who can use it
- Students – To break down problems into manageable parts and find solutions step by step.
- Teachers – To guide students through structured problem-solving processes.
- Managers – To organize and solve workplace challenges efficiently.
- Team leaders – To facilitate collaborative problem-solving in group settings.
- Researchers – To structure problem statements and develop solutions in studies.
12. Math graphic organizer
A math graphic organizer is a visual tool used to break down mathematical concepts, making them easier to understand. It helps students organize information, see patterns, and solve complex problems step by step. These organizers can be charts, diagrams, or maps that guide learners through calculations, equations, and word problems.
Template

How to use it
- Choose the math problem: Identify the concept or problem you need help with and pick a suitable math graphic organizer, such as a number line, flowchart, or equation organizer.
- Organize the information: Write down key numbers, operations, and steps in the graphic organizer to visually structure the problem.
- Solve step by step: Use the organizer to break down the problem logically, helping you analyze and solve it efficiently.
Benefits of using a math graphic organizer
- Breaks down difficult math concepts into manageable parts.
- Provides a clear structure for tackling equations and calculations.
- Helps students remember steps and patterns in math operations.
- Works well for visual learners who benefit from structured layouts.
- Can be used in group work to brainstorm and solve problems together.
Who can use it
- Students – To visualize and simplify complex math problems.
- Teachers – To explain mathematical concepts in an engaging way.
- Tutors – To guide students through step-by-step problem-solving.
- Parents – To help children understand math at home.
- Researchers – To organize and analyze mathematical data effectively.
Types of Graphic Organizers for Learning
Graphic organizers for learning are visual tools that help students understand, organize, and remember information more effectively. These types of graphic organizers help break down complex material into manageable parts, illustrate relationships between ideas, and improve memory retention. By using these tools, students can improve their comprehension, organize their thoughts, and engage more effectively with their learning material.
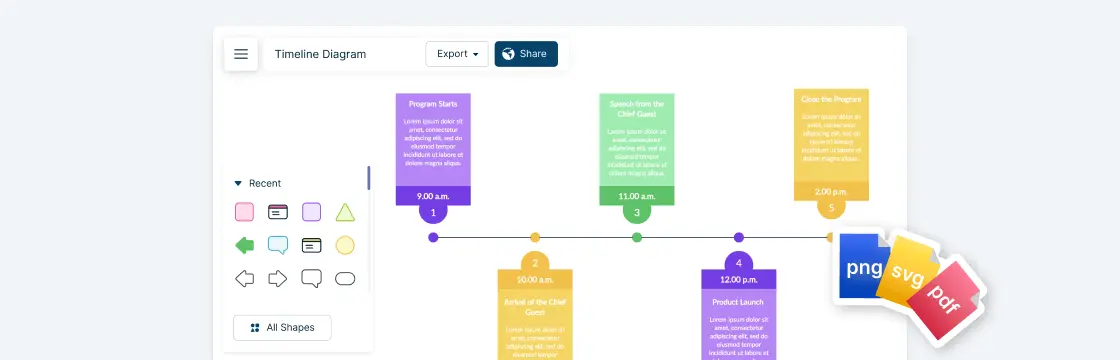
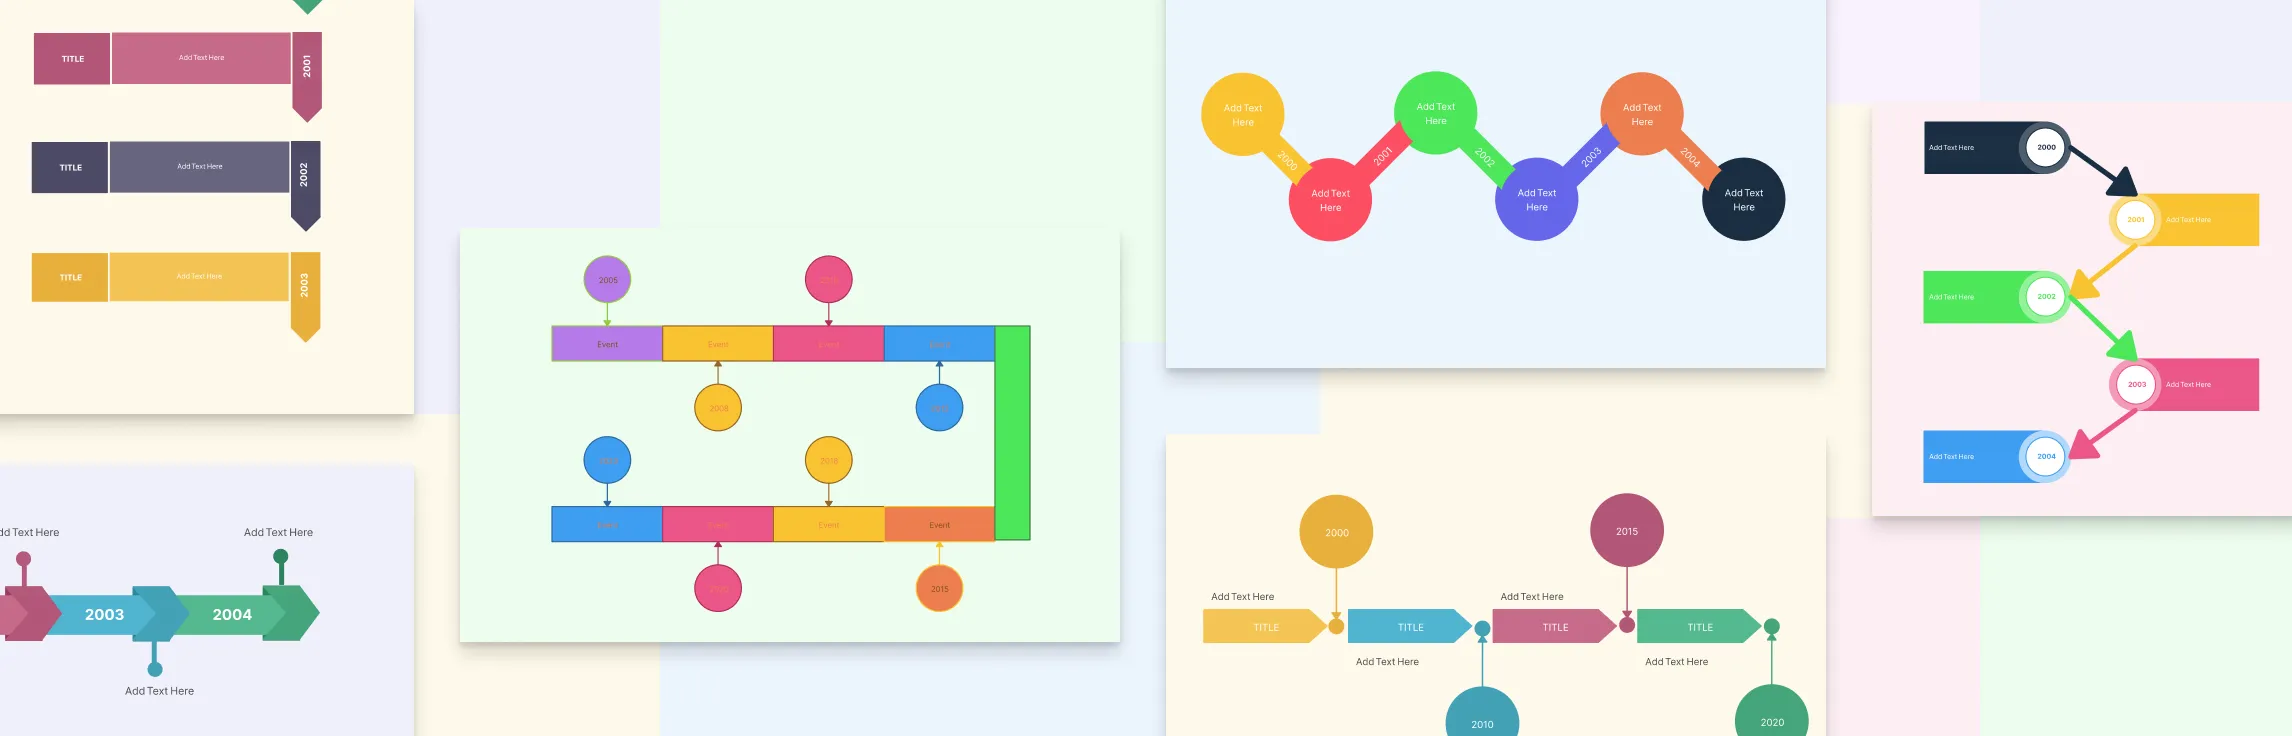
13. Timeline graphic organizer
Timeline diagrams are a type of graphic organizer that shows a sequence of events in chronological order. They come in handy when studying history as you can use it to display major historical events that occurred during a period of time along with important details such as dates and locations in which they took place. In addition, timeline charts can also be used to show the progress of something (i.e. growth of a business) or changes.
Template

How to use it
- Identify events – To create a timeline, list key events or milestones, focusing on those that are important to the topic.
- Arrange chronologically – Organize events in the correct order, from earliest to latest or vice versa.
- Add key details – Include dates, locations, and brief descriptions for each event. Optionally, add images or symbols.
Benefits of timeline graphic organizers
- Timelines show the order of events, making it easier to understand their connections.
- Track changes or growth over time, such as in history or business.
- Visual organization helps remember details and grasp the bigger picture.
- Breaks down complex events into easy-to-follow steps, reducing confusion.
Who can use it
- Students – To study historical events, processes, or sequences of events in a clear order.
- Teachers – To help students understand timelines in history, literature, or other subjects.
- Researchers – To visualize the chronology of events or project milestones.
- Project managers – To plan and track project timelines and deadlines.
- Writers – To organize the sequence of events in a story or narrative.
14. T chart
A T chart is a simple graphic organizer that helps students compare two aspects of a topic side by side. It’s typically used to explore two opposing ideas, like pros and cons, advantages and disadvantages, or differences and similarities. By separating information into two columns, students can easily analyze the connections and distinctions between each side.
Template

How to use it
- Draw a T chart: Draw a “T” on paper or a whiteboard. Label the two columns with the topics you’re comparing, like “Pros” and “Cons.”
- Brainstorm ideas: Write down key points in each column. List the positive aspects in one column and the negative aspects in the other.
- Organize and analyze: Review the list and look for connections or patterns between the points. This helps you see the bigger picture.
- Draw conclusions: Use the T chart to make decisions or conclusions based on the information you’ve listed. It helps you weigh the pros and cons clearly.
Benefits of using a T chart
- Helps students organize two sides of a topic, making it easier to compare and contrast.
- Students analyze both sides, which encourages deeper thinking and understanding.
- By weighing both options in an organized format, students can make more informed decisions.
- The simple layout helps students easily absorb and retain the information.
Who can use it
- Students – To compare and contrast ideas, concepts, or arguments (e.g., pros vs. cons).
- Teachers – To help students analyze similarities and differences in a structured way.
- Researchers – To evaluate and compare different theories, perspectives, or data.
- Writers – To organize different viewpoints, themes, or plot elements.
- Business professionals – To assess options, decisions, or strategies for comparison.
15. Hierarchy chart
A hierarchy chart is a visual organizer that shows how different parts of a system, organization, or concept are ranked or related. It starts with the most important element at the top and branches down to show subcategories or smaller components. It helps students break down complex topics by showing the structure and relationships between different levels of information.
Template

How to use it
- Identify the main topic: To create a hierarchy chart, start by identifying the most important element or the central concept. Write this down at the top of the hierarchy chart.
- Add subcategories: Below the main topic, list the second-level elements that relate to it. Continue adding layers if necessary to show additional subcategories.
- Connect with lines: Use lines to connect each layer, showing the relationship between the higher and lower elements in the hierarchy. This helps visualize how everything fits together.
Benefits of using a hierarchy chart
- It breaks down complex ideas into simple levels, showing how parts fit together.
- Helps students arrange information logically, making it easier to understand.
- Clearly shows how each part is related to the main topic and others.
- Encourages students to think about how information is structured and its importance.
- The visual format helps students remember and recall information better.
Who can use it
- Students – To understand the structure of systems, organizations, or concepts.
- Teachers – To teach about relationships between main ideas and supporting details.
- Business professionals – To map out organizational structures or workflows.
- Project managers – To organize tasks or team responsibilities.
- Researchers – To categorize and visualize data in a hierarchical structure.
16. Star diagram
A star diagram is a visual tool used to organize the characteristics of a specific topic. It helps break down complex ideas into key traits or attributes and makes it easier to explore and brainstorm different aspects of a subject. The central idea is placed in the middle, and related traits or features are listed around it, creating a star-like shape. This layout helps students see connections and relationships between various aspects of a topic.
Template

How to use it:
- Select the topic: Write the main topic or idea in the center of the star diagram template.
- Identify related characteristics: Brainstorm the key attributes, features, or components related to the topic and write them on each point of the star.
- Adjust the diagram: If necessary, add more points to the star to fit all the relevant characteristics.
Benefits of using a star diagram:
- It helps break down the topic into key characteristics, making it easier to understand.
- It helps explore all aspects of a topic, sparking ideas and critical thinking.
- It shows how traits connect to the main idea, making connections clearer.
- The visual layout makes information easier to remember.
- Writing and organizing ideas helps students engage with the material.
Who can use it
- Students – To explore and organize characteristics of a topic.
- Teachers – To encourage brainstorming and critical thinking.
- Researchers – To break down complex ideas into manageable traits.
- Writers – To structure ideas for creative or academic work.
- Business professionals – To analyze key aspects of a product or service.
Types of Graphic Organizers for Brainstorming
Graphic organizers for brainstorming are tools that help students and teams generate, organize, and explore ideas. These types of graphic organizers help individuals and teams generate and organize ideas more effectively. They provide a clear visual structure for exploring various aspects of a topic, making it easier to capture and evaluate creative thoughts. By using these tools, users can improve creativity, streamline idea generation, and better organize their brainstorming sessions.
17. Cluster diagram
A cluster diagram is a visual tool that helps in brainstorming and idea generation. It is used to explore a central topic by branching out into related sub-topics and ideas. This diagram is especially useful for organizing thoughts, generating new ideas, and exploring a subject from different angles. By connecting related concepts visually, students can easily understand how ideas are linked and develop a deeper understanding of the main topic.
Template

How to use it
- Step 1: Start by choosing the main topic you want to explore. Write this topic in the center of the cluster diagram template.
- Step 2: Brainstorm related sub-topics and write them around the central topic. These could be different aspects of the main idea.
- Step 3: Next, brainstorm around each sub-topic and add any related ideas or details.
- Step 4: Continue adding layers if needed, connecting more related ideas. You can use colors or lines to separate different branches of thought to make it easier to follow.
Benefits of using a cluster diagram
- It helps generate a variety of ideas and viewpoints on a topic.
- By connecting ideas, it makes complex topics easier to understand and navigate.
- It acts as a brainstorming tool, helping students come up with multiple ideas related to a topic.
- It visually represents how different ideas or concepts relate to each other, enhancing comprehension.
- Cluster diagrams allow students to explore a topic from various angles and develop a more comprehensive understanding.
Who can use it
- Students – For brainstorming and organizing ideas around a central topic.
- Teachers – To help students explore and understand concepts.
- Researchers – For structuring and exploring connections between ideas.
- Writers – To organize thoughts and structure writing projects.
- Business professionals – To analyze relationships and generate ideas for planning or strategy.
18. Lotus diagram
A lotus diagram is a visual tool that helps break down complex topics into smaller, more manageable components. It’s especially useful for brainstorming and organizing information. By dividing a broad topic into smaller parts, students can better understand the details and connections between ideas. It’s a great way to explore various aspects of a subject and can be used for studying or idea generation.
Template

How to use it
- Create the center grid: Draw a 3x3 grid and write the main topic in the middle square. Or you can start with a lotus diagram template.
- Add sub-topics: Write related sub-topics around the main topic in the surrounding squares.
- Expand with facts or ideas: Draw 8 more 3x3 grids around the center and write facts or ideas related to each sub-topic in the surrounding grids.
Benefits of using a lotus diagram
- The lotus diagram simplifies large subjects by breaking them into smaller, more understandable parts.
- It helps students logically organize their ideas and see connections between sub-topics.
- By creating separate spaces for sub-topics, students can generate more ideas and expand their understanding.
- The diagram’s structure makes it easier to visualize how different aspects of a topic fit together.
Who can use it
- Students – To break down complex topics into smaller, manageable parts.
- Teachers – For helping students organize thoughts and analyze subjects.
- Researchers – To explore different aspects of a topic in depth.
- Writers – For brainstorming and organizing writing ideas.
- Business professionals – For mapping out ideas and problem-solving strategies.
19. Cause and effect graphic organizer
A cause and effect graphic organizer helps to visually represent the relationship between an event and its causes or effects. It shows how one event leads to another, making it easier to understand how different factors are connected. This organizer is especially useful when studying problems or analyzing the outcome of certain events.
Template

How to use it
- Identify the cause(s) – To create a cause and effect diagram, write down the event or reason that starts the chain of events in your graphic organizer.
- Identify the effect(s) – Write down the results or outcomes that happen as a result of the cause(s).
- Organize the events – Use arrows or lines to show how causes lead to effects. You can show one cause leading to multiple effects, one cause leading to another cause, or several causes leading to one effect.
Benefits of using a cause and effect graphic organizer:
- Helps students see how events are linked by causes and effects.
- Makes it easier to understand how multiple factors contribute to outcomes.
- Encourages analyzing the reasons behind events and their consequences.
- The visual structure makes it easier to remember how events unfold.
Who can use it
- Students – To understand relationships between events and their outcomes.
- Teachers – For explaining cause-and-effect relationships in lessons.
- Writers – To structure arguments or narrative sequences.
- Researchers – To analyze patterns and connections in data.
- Business professionals – For evaluating problems and solutions in processes.
20. Mind map
A mind map is a visual tool that helps organize and connect ideas around a central topic. It captures the free flow of thoughts, making it perfect for brainstorming and structuring complex information. With branches extending from the central theme, you can quickly organize ideas, explore new concepts, and deepen your understanding of a topic.
Template

How to use a mind map
- Start with the main topic: To create a mind map, write the main topic in the center of the page.
- Add related ideas: Draw branches from the center and write down related ideas on them.
- Expand with more details: For each branch, add more facts or ideas to explain or support the main idea.
- Use colors or images (optional): Add colors or pictures to make it easier to understand and remember.
Benefits of using a mind map
- Helps students break down complex topics and organize them into manageable pieces.
- Encourages free-flowing ideas, making it easier to generate new thoughts and solutions.
- The visual format helps students see how different ideas and concepts are connected.
- By organizing information in a clear, structured way, mind maps make it easier to remember key concepts.
- Makes it easy to explore a topic from multiple angles and generate ideas without feeling overwhelmed.
Who can use it
- Students – For brainstorming ideas and organizing thoughts on any topic.
- Teachers – To plan lessons and visualize concepts.
- Writers – For organizing content and outlining projects.
- Professionals – To map out strategies, projects, and business plans.
- Creative individuals – For exploring new ideas and solving problems.
Conclusion: Types of Graphic Organizers
Understanding the types of graphic organizers can greatly enhance how students approach learning. These tools help organize thoughts, visualize relationships, and break down complex ideas into manageable pieces. Whether you’re using a mind map for brainstorming, a T-chart for comparing, or a cause and effect diagram to explore connections, each type of graphic organizer has its unique benefits. By choosing the right one for the task at hand, students can improve comprehension, retention, and engagement with their learning. So, explore the various types of graphic organizers and find the best fit for your study needs!
FAQs on Types of Graphic Organizers
What are the 6 types of graphic organizers?
What is the easiest graphic organizer?
How do I choose the right type of graphic organizer?
Can graphic organizers be used in all subjects?
What is a 5 W’s graphic organizer?