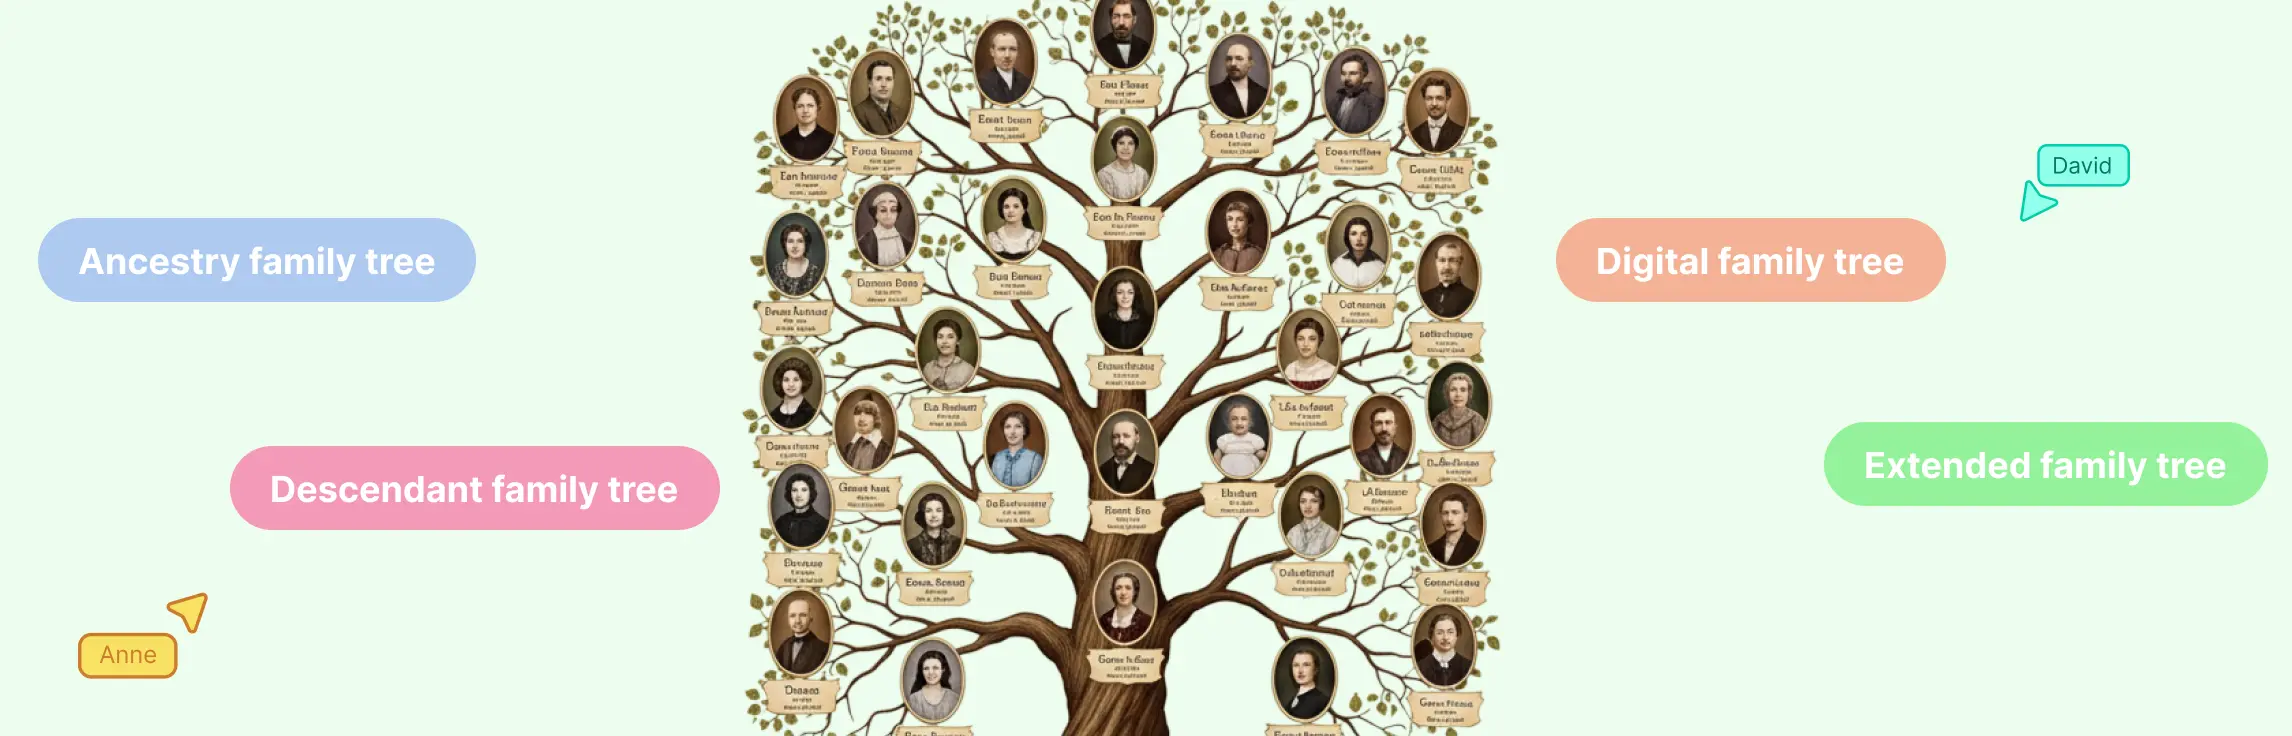
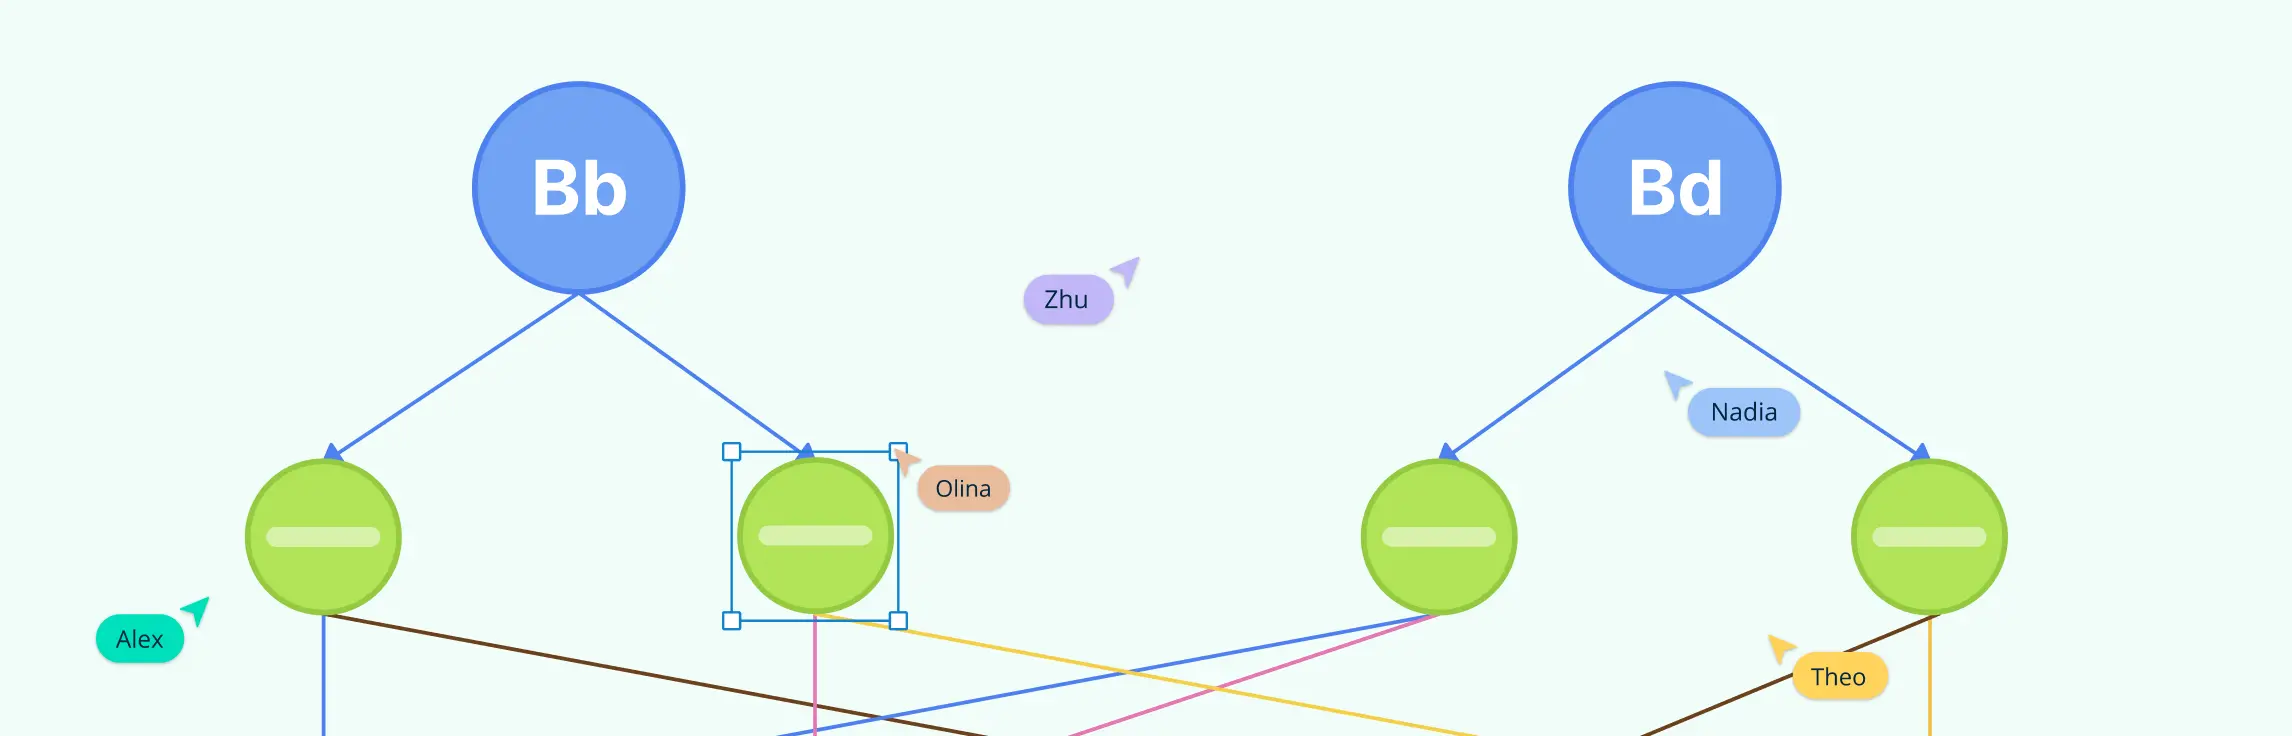
Family trees help people understand family connections, preserve family history, and see how generations are linked over time. Whether you are exploring your ancestry, organizing family information, or simply learning more about your roots, understanding what a family tree is can make the bigger picture much clearer. In this guide, you’ll learn what is a family tree, what it shows, why it matters, and how it is different from other family diagrams like pedigree charts and genograms.
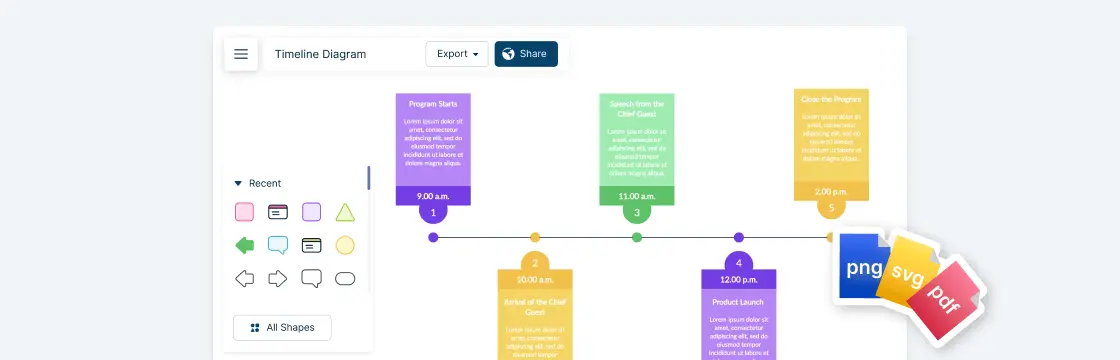
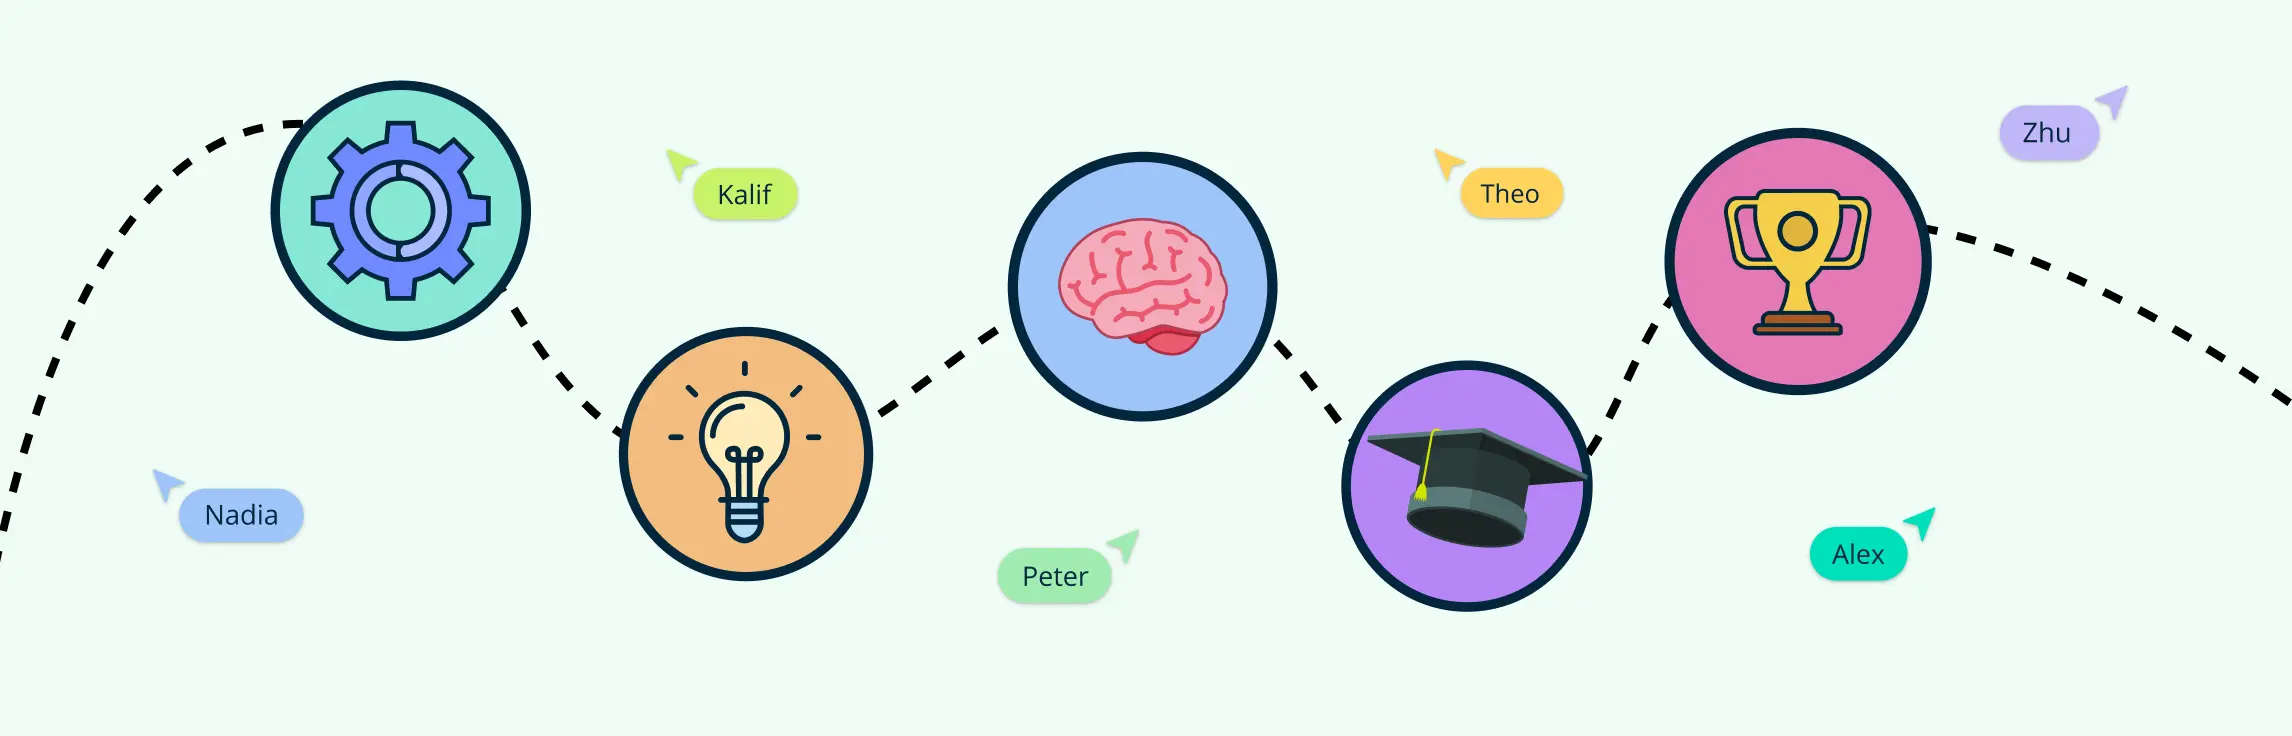
A timeline is a simple but powerful way to show how events unfold over time, whether you’re mapping a project plan, telling a historical story, or tracking milestones for a presentation. By laying information out in chronological order, timelines make complex sequences easier to follow at a glance. In this guide, we’ll walk you through everything you need to know on how to make a timeline. From gathering your information to choosing the right layout and styling your timeline for impact, you’ll learn step by step how to make your timelines both informative and easy to understand. This guide will help readers turn scattered dates and milestones into a timeline that is clear, useful, and easy to follow.
You can make a mind map in Excel by placing a central idea on a blank worksheet, adding branch shapes around it, and connecting the ideas with lines or arrows. This guide shows the exact Excel steps, explains where Excel becomes limiting, and points you to free mind map templates when you need a faster option.
You can make a mind map in PowerPoint with SmartArt, shapes, text boxes, and connectors. This guide walks through the steps, explains when PowerPoint works well, shows where it becomes limiting, and offers editable mind map templates when you need a faster way to organize ideas.
When it comes to understanding sets, relationships, and overlaps, symbols are your secret weapon. They turn complex concepts into something visual, clear, and even fun to work with. This guide dives deep into all the key Venn diagram symbols, showing you not just what they mean, but how to use them confidently in diagrams, exercises, and real-world examples.
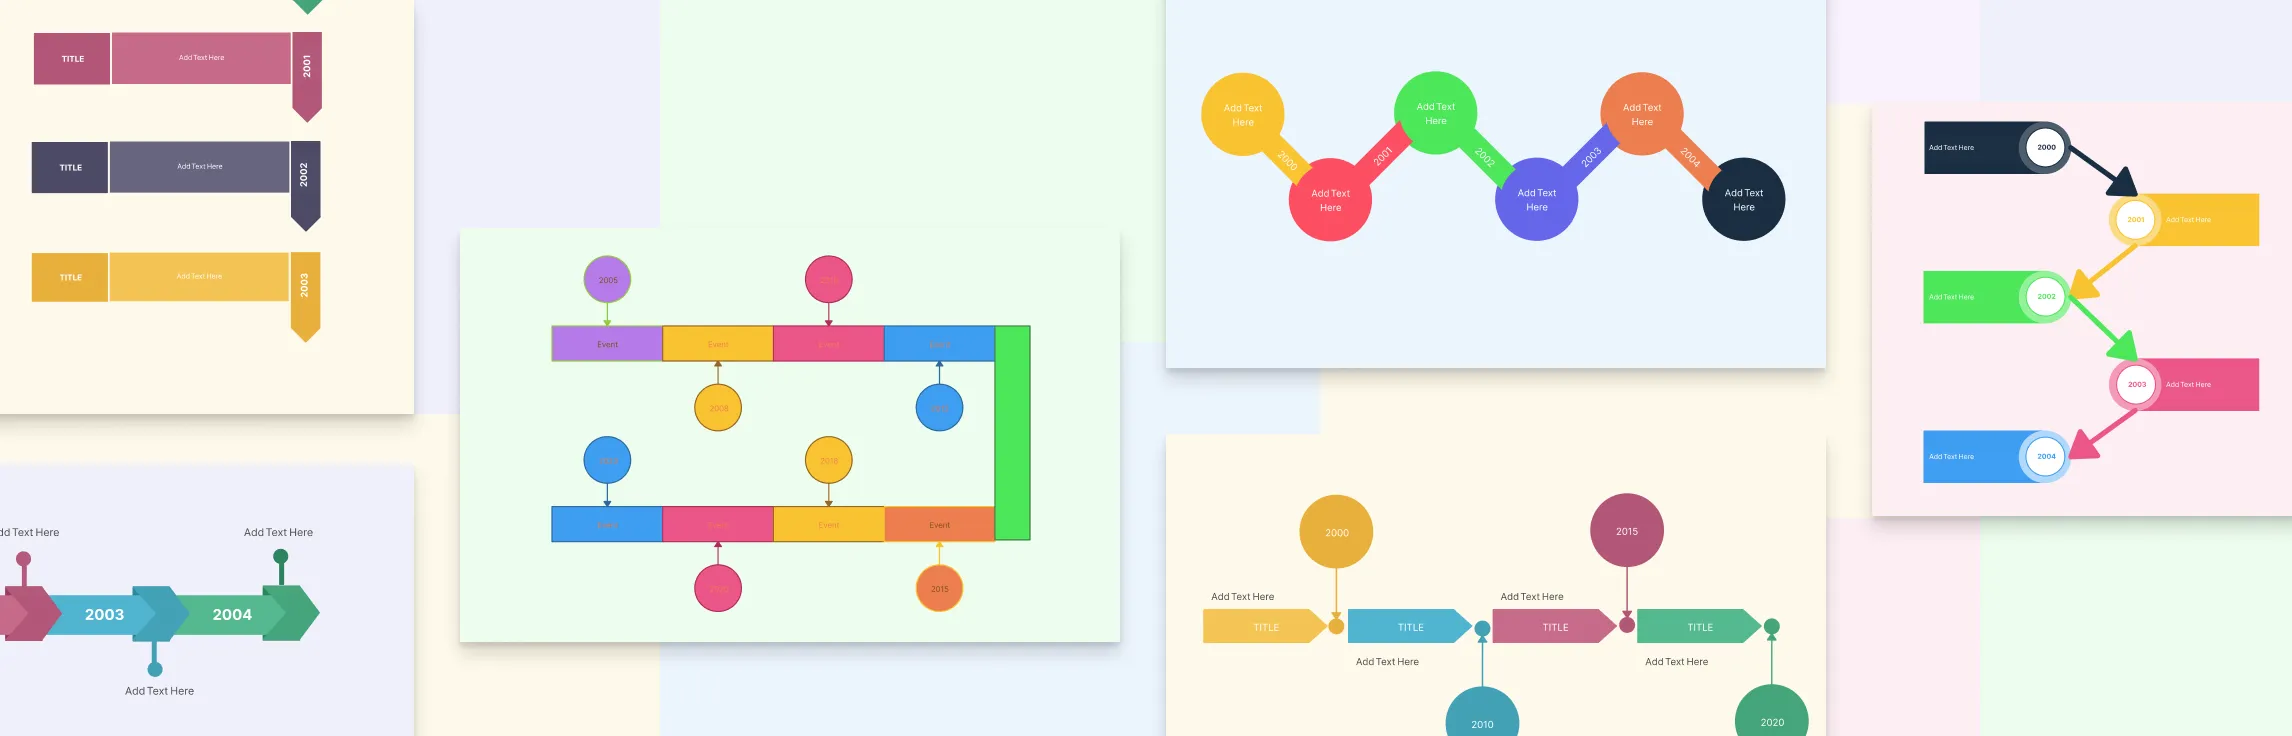
A timeline is a visual way to display events or tasks in the order they occur, helping you quickly understand how things progress over time. Whether you’re mapping historical events, planning a project, or organizing ideas, knowing the different types of timelines can make your work clearer and more effective. In this guide, we’ll explore the main types of timelines, their uses, and how you can easily create them using a visual tool like Creately.
A timeline diagram is a simple but powerful way to show how events unfold over time. Whether it’s used to track project milestones, visualize historical events, or map a product’s journey, timelines make it easy to see progress and relationships at a glance. In this guide, we’ll explain the timeline meaning, its key elements, and why it’s such a useful tool for organizing information clearly.
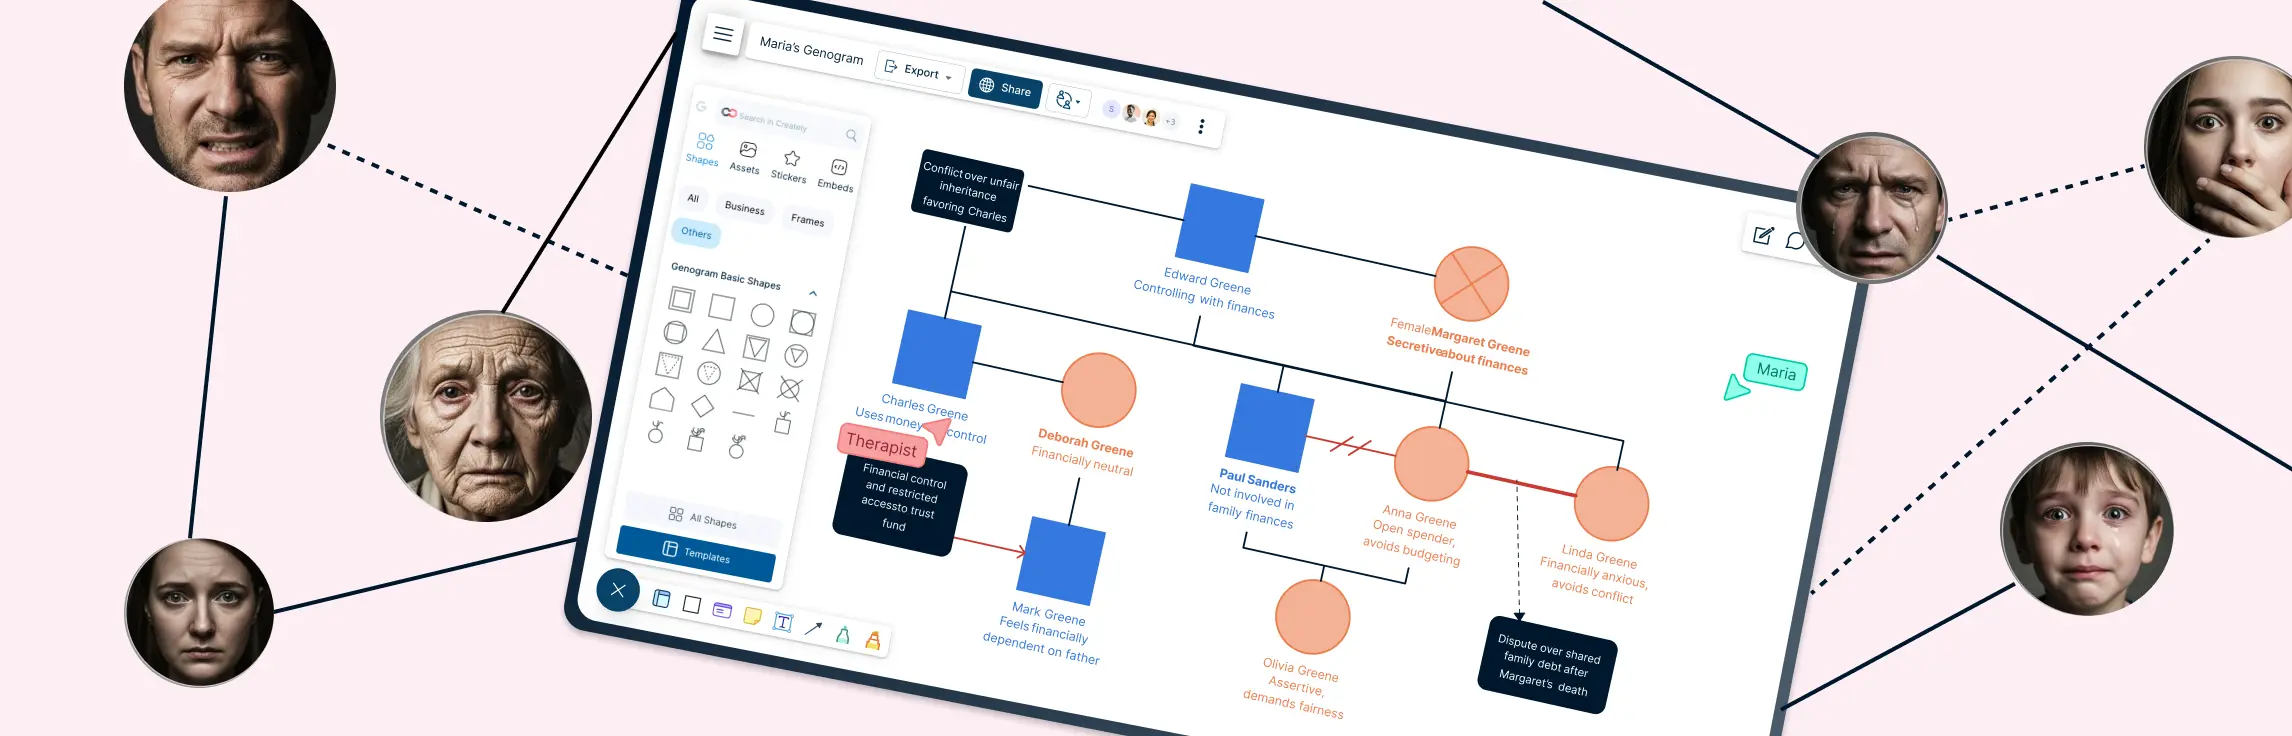
Trauma can affect individuals, families, and entire communities—shaping relationships, behaviors, and emotional well-being across generations. Understanding how trauma is passed down or shared helps professionals design more effective pathways for healing and recovery. trauma mapping offers a visual way to trace these emotional and psychological patterns, and when combined with genograms, it becomes a powerful tool for identifying connections between experiences, stress responses, and resilience over time.
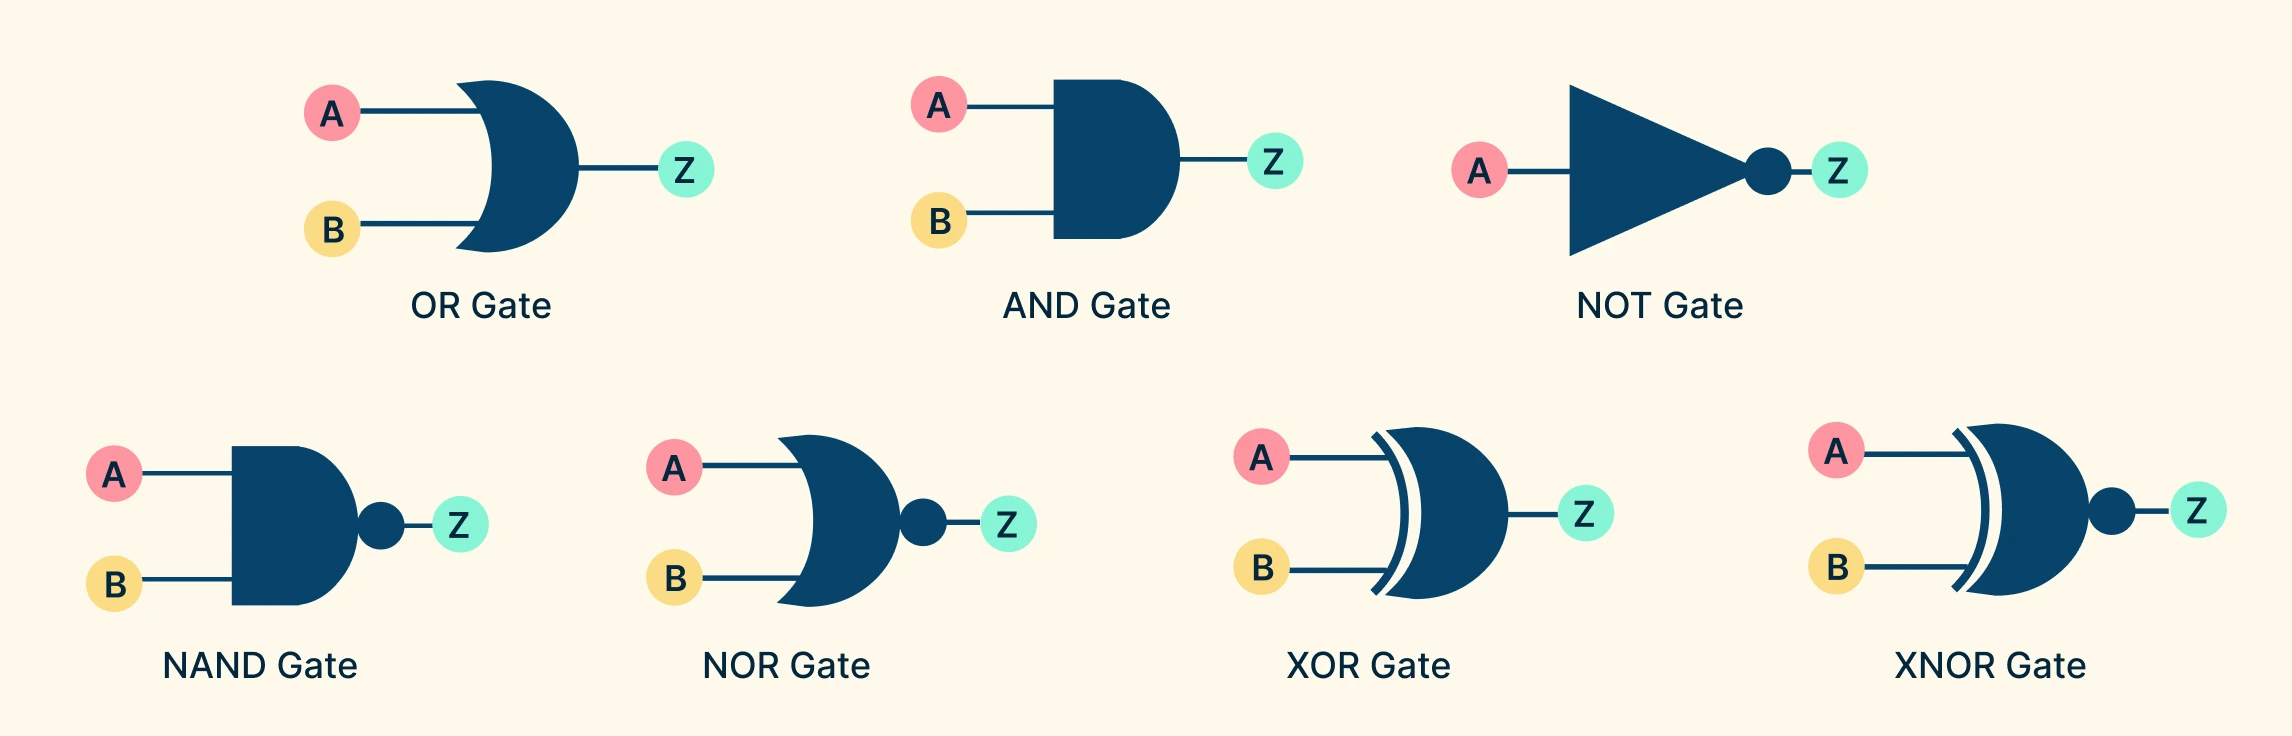
Logic gates are tiny electronic devices that take one or more input signals and produce a single output based on logical rules such as AND, OR, and NOT. By combining these gates in different ways, engineers can design everything from simple calculators to complex processors that power modern computers. In this guide, we’ll explore the different logic gate types, the symbols that represent them in logic gate diagrams, and the ways they can be combined to form more complex integrated circuits.
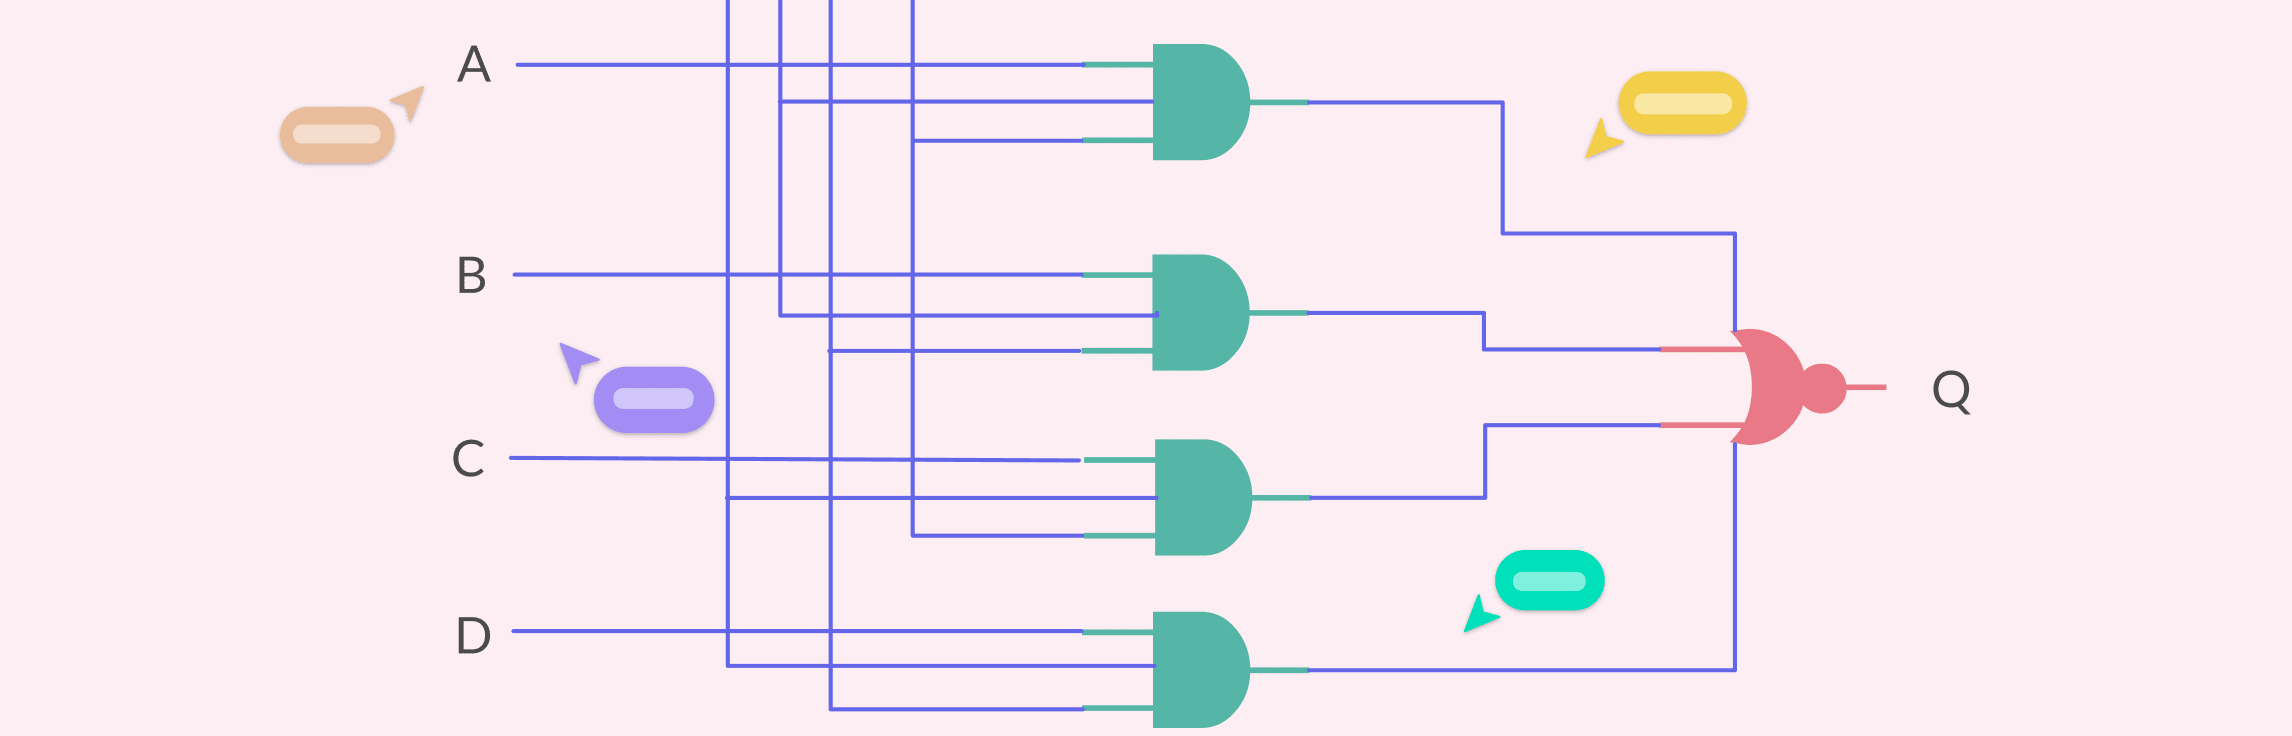
Definition of a Logic Gate Diagram A logic gate diagram is a visual representation of how different logic gates are connected in a digital circuit. Instead of describing logical operations with words or equations, the diagram uses standardized symbols and lines to show how signals flow between them. In short, a logic gate diagram acts as a blueprint for digital decision-making, showing how simple logic gates come together to form complex systems like adders, comparators, memory units, and processors.
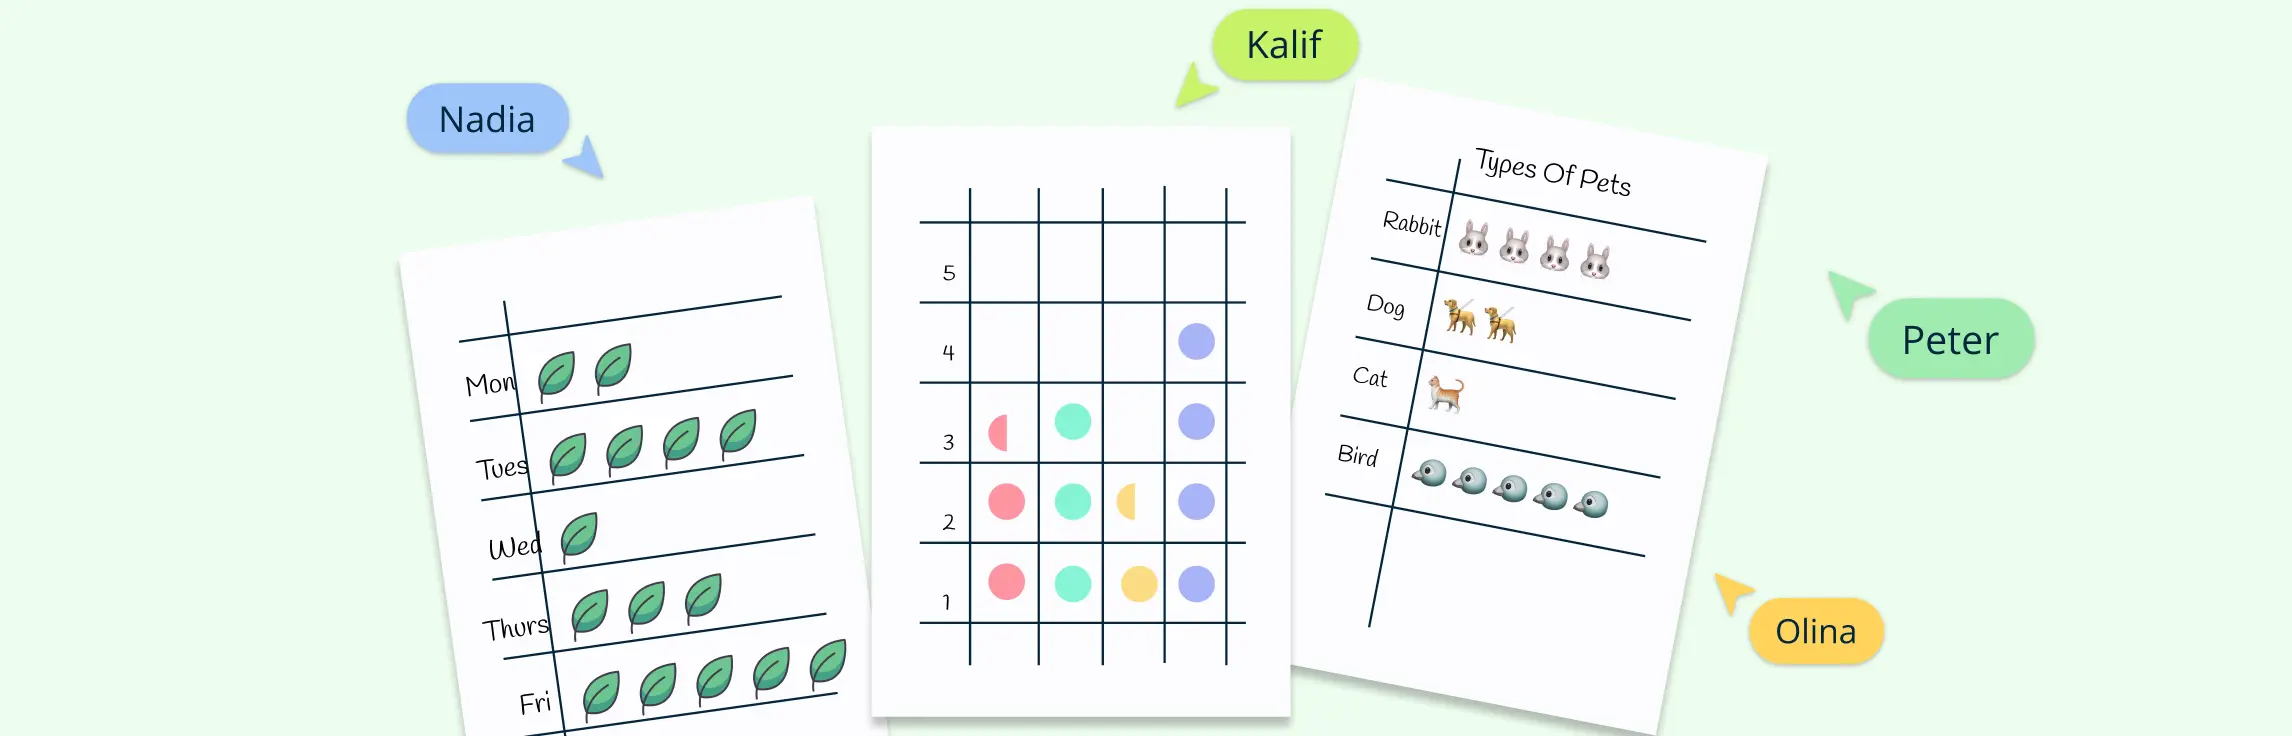
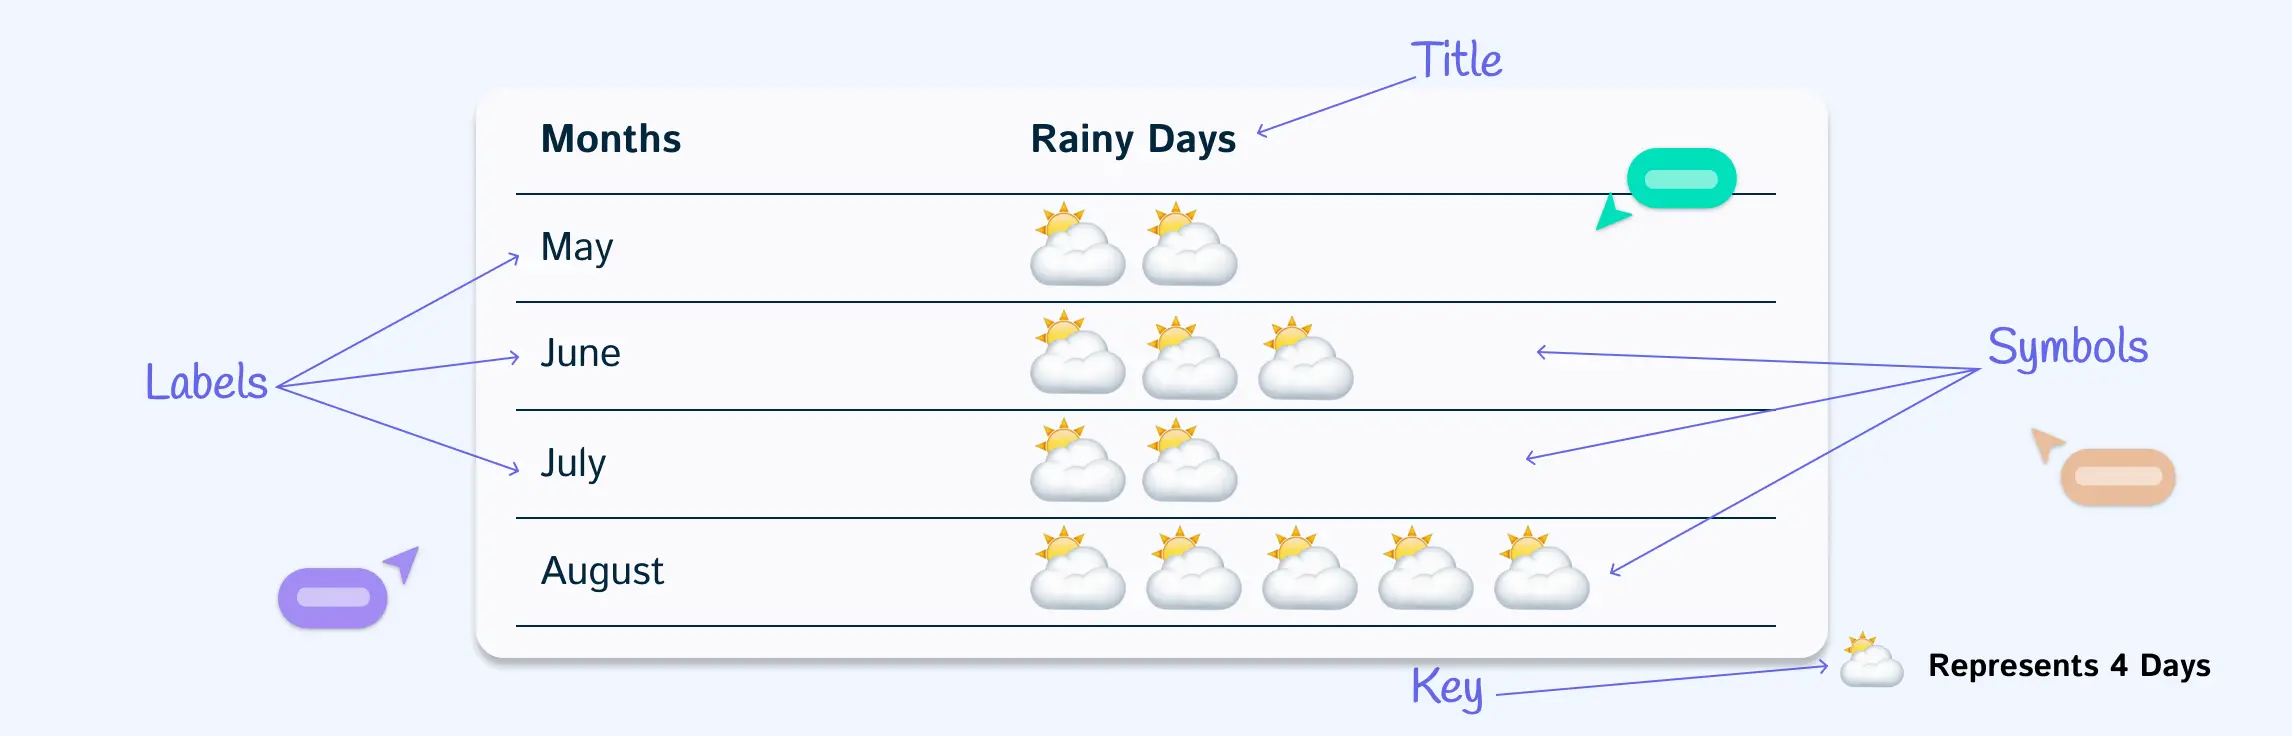
Pictographs turn numbers into pictures, making data easier to read, compare, and explain. Instead of showing only figures, they use icons such as apples, trees, animals, sports equipment, or people to represent quantities.
This guide will explain what a pictograph is and break down its key parts. You’ll also learn how to read pictograms, when to use them, and the advantages and disadvantages of using pictograms for visualizing data.
A KWL graphic organizer is a powerful visual tool that supports active learning by helping students track what they Know, Want to know, and Learned about a topic. Whether you’re teaching science, history, or reading comprehension, KWL charts promote structured thinking, engagement, and better knowledge retention.
Ever faced a room full of blank stares before starting a new topic? The KWL reading strategy turns that uncertainty into curiosity. By helping learners tap into what they already know, define what they want to learn, and reflect on what they’ve discovered, this simple three-column method transforms reading into a focused, purpose-driven experience.
Ever wish your students were more curious, more engaged, and more reflective in their learning? That’s exactly what KWL teaching strategies are designed to spark. By asking students what they Know, what they Want to know, and later, what they’ve Learned, the KWL method turns passive learners into active participants. Whether you’re teaching science, history, or literature, a well-crafted KWL chart can structure lessons, personalize instruction, and fuel meaningful classroom conversations.
A concept map graphic organizer helps students and teachers connect ideas visually so information is easier to understand, remember, and discuss. It works well for reading comprehension, lesson planning, brainstorming, research, and subject review because it shows relationships instead of listing facts.
Concept maps aren’t just about connecting words with lines they can be creative, engaging, and even fun! When designed thoughtfully, they encourage deeper thinking and boost comprehension. In this guide, we’ll explore creative concept map examples for teachers and students.
Biology is full of fascinating ideas, but sometimes, all the terms and concepts can feel overwhelming. That’s where biology concept maps come in! Instead of just memorizing facts, you’ll be able to understand how things fit together—like how photosynthesis fuels life or how DNA determines our traits.
Concept map examples help students turn lessons, readings, and exam topics into clear visual relationships. Instead of memorizing isolated facts, students can map key ideas, label how they connect, and review the structure before assignments, projects, or tests.
Concept map ideas help you decide what to map and how to structure it. You can use concept maps for studying, brainstorming, project planning, decision-making, research, productivity, and explaining complex topics at work or school.
Instead of memorizing isolated facts, concept maps in education allow learners to visualize relationships between different topics, making it easier to understand and retain information. In this guide, we’ll explore how to create and use concept maps in education effectively.
In today’s fast-paced digital world, organizations generate vast amounts of knowledge daily. However, without a structured approach to managing this knowledge, valuable insights can be lost, leading to inefficiencies and missed opportunities. Knowledge management is the systematic process of capturing, organizing, sharing, and utilizing information to enhance decision-making, innovation, and overall business performance.
In today’s rapidly evolving business landscape, effective knowledge management (KM) is crucial for driving innovation, improving efficiency, and enhancing decision-making. At the core of a successful KM strategy is the understanding that not all knowledge is the same. Knowledge within an organization can take many forms, from structured data and documented processes to personal expertise and intuitive insights. To harness the full potential of knowledge, organizations must recognize and manage different types of knowledge effectively.
A knowledge management process is more useful when people can connect information capture, review, and reuse to the workflows where that knowledge matters. Creately Process helps teams map how operational knowledge is created and maintained, record process ownership, and keep living documentation connected to the work it supports.
A brace map is a powerful visual tool that helps break down complex concepts into smaller, manageable parts. Whether you’re in education, business, or problem-solving, brace maps allow you to clearly understand relationships by visualizing components in a structured way. In this guide, we’ll dive into what a brace map is, how to create one, and how you can use brace maps to organize your thoughts and ideas. Let’s explore how this tool can enhance your workflow with Creately’s versatile platform.
Knowledge management (KM) is a systematic approach to capturing, organizing, sharing, and analyzing an organization’s knowledge to enhance its overall efficiency and effectiveness. It involves leveraging organizational knowledge as a strategic asset to improve decision-making, collaboration, and innovation. In this comprehensive guide, we delve into the definition, process, examples, strategies, and best practices associated with knowledge management.
Have you ever wondered why some kids inherit their mother’s curly hair while others take after their father’s straight hair? The answer lies in genetics—the science of how traits are passed down from parents to their children.
Have you ever felt overwhelmed by information? Or struggled to connect the dots between what you know and what you need to do? That’s where knowledge mapping comes in. Think of it as a way to visually organize your ideas, information, and insights into one easy-to-follow map.
A mind map for studying turns class notes, chapters, and exam topics into a visual structure that is easier to review and remember. Students can use mind maps for lecture notes, revision plans, essay outlines, research summaries, and complex subjects where relationships matter. This guide explains how the study method works, when to use it, and how to create study mind maps with templates.
In an era where educational paradigms are rapidly evolving, understanding and implementing effective learning methodologies has become more crucial than ever. The digital revolution has transformed how we process and absorb information, making visual learning a cornerstone of modern education. As our world becomes increasingly visual-centric, with information constantly bombarding us through screens, graphics, and multimedia, the ability to learn through visual means has evolved from a preference to a necessity. This shift in learning dynamics calls for a deeper understanding of visual learning methodologies and their implementation in educational settings. By exploring the intricate relationship between visual perception and cognitive processing, we can better appreciate how visual learning styles and strategies can revolutionize education, making it more accessible, engaging, and effective for learners of all ages and backgrounds.
Mind maps for note-taking help you capture the main topic, key ideas, and supporting details in a visual structure instead of a long linear list. They are useful for lectures, meetings, reading notes, exam revision, and study summaries because they make relationships easier to see and remember. This guide shows how to take notes with mind maps, when to use them, and which templates can help you start faster.
To make a mind map, start with one central idea, add main branches for key themes, expand each branch with supporting details, and use keywords, colors, icons, and connections to make the structure easy to scan. This guide walks through the full process step by step so you can create a mind map for brainstorming, planning, studying, note-taking, or problem-solving.
Mind mapping techniques are practical methods for turning scattered ideas into a visual structure. Use them to brainstorm, plan projects, solve problems, study complex topics, compare options, or generate creative ideas. This guide explains when to use each mind mapping method, how it works, and how to apply it with editable templates.
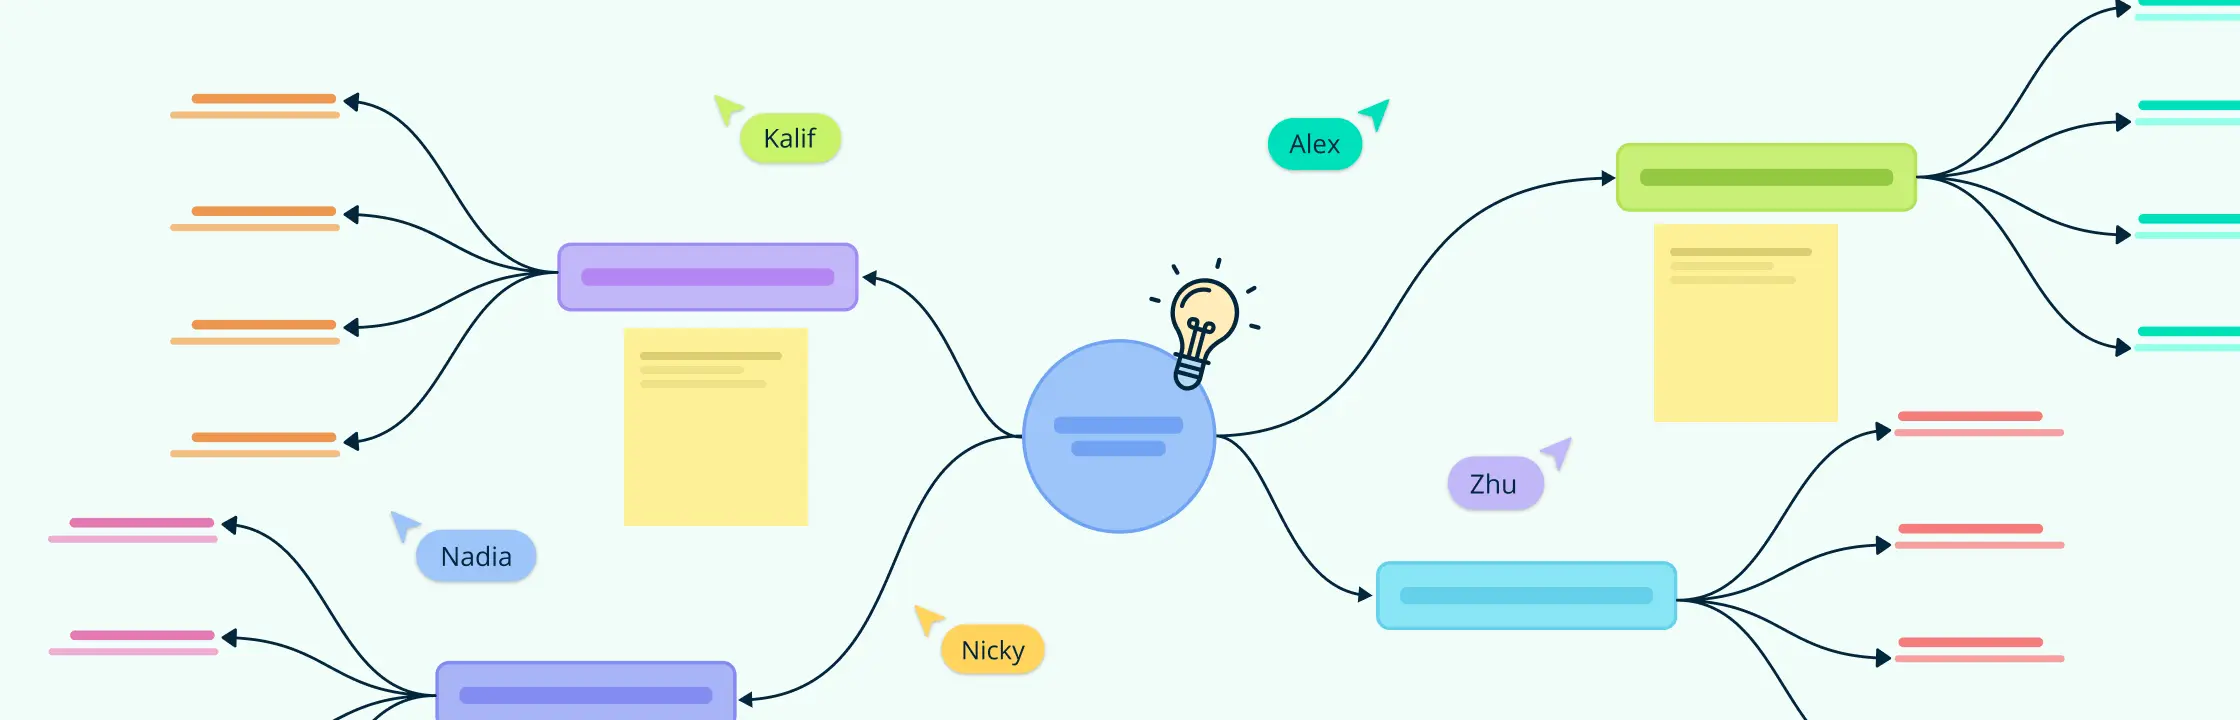
Mind maps are visual diagrams that organize ideas around a central topic. They use branches, keywords, colors, and images to show how information connects, making them useful for brainstorming, studying, planning, note-taking, and problem-solving. This guide explains what a mind map is, how mind mapping works, common types, benefits, examples, and when to use one.
Collaborative learning is all about students working together to achieve shared goals. It’s not just about group work—it’s about meaningful interaction that helps students learn better. When students collaborate effectively, they engage more with the material and with each other, which leads to better outcomes for everyone. This guide will show you how to use collaborative learning strategies to improve classroom interaction and make learning more engaging and effective.
A family tree is one of the easiest ways to see how people in your family are connected across generations. Whether you’re making one for a school project, personal research, a family event, or just to preserve family history, the key is to keep it clear, organized, and easy to update.
Introduction to Brainstorming Brainstorming is a structured way to generate and develop ideas for a problem, plan, product, or story. This guide covers the brainstorming process, useful techniques, and practical ways to move from an open list of ideas to actionable next steps.
Graphic organizers combine text and visuals, making them a scientifically proven tool for effective teaching and learning. They are highly beneficial for teachers and students alike, helping to create more engaging lessons and enhancing comprehension. Below, we’ve outlined different types of graphic organizers that you can use in various scenarios—whether it’s reading, writing, conducting research, or preparing for exams. The types of graphic organizers below include a ready-to-use template to get you started instantly.