We thought of breaking up the usual string of UML diagram posts with a simple post on flowchart basics. We will cover the flowchart symbols, best practices to follow and some simple templates for you get started fast. For a more detailed look at flowcharts check our flowchart tutorial.
What is the purpose of a flowchart?
Flowcharts are probably the most popular diagram type in the world. So it pays to know how to read a flowchart. You can use them to
- Improve your processes by identifying bottlenecks and defects
- Communicate/explain a process to someone
- Easily visualize complex processes
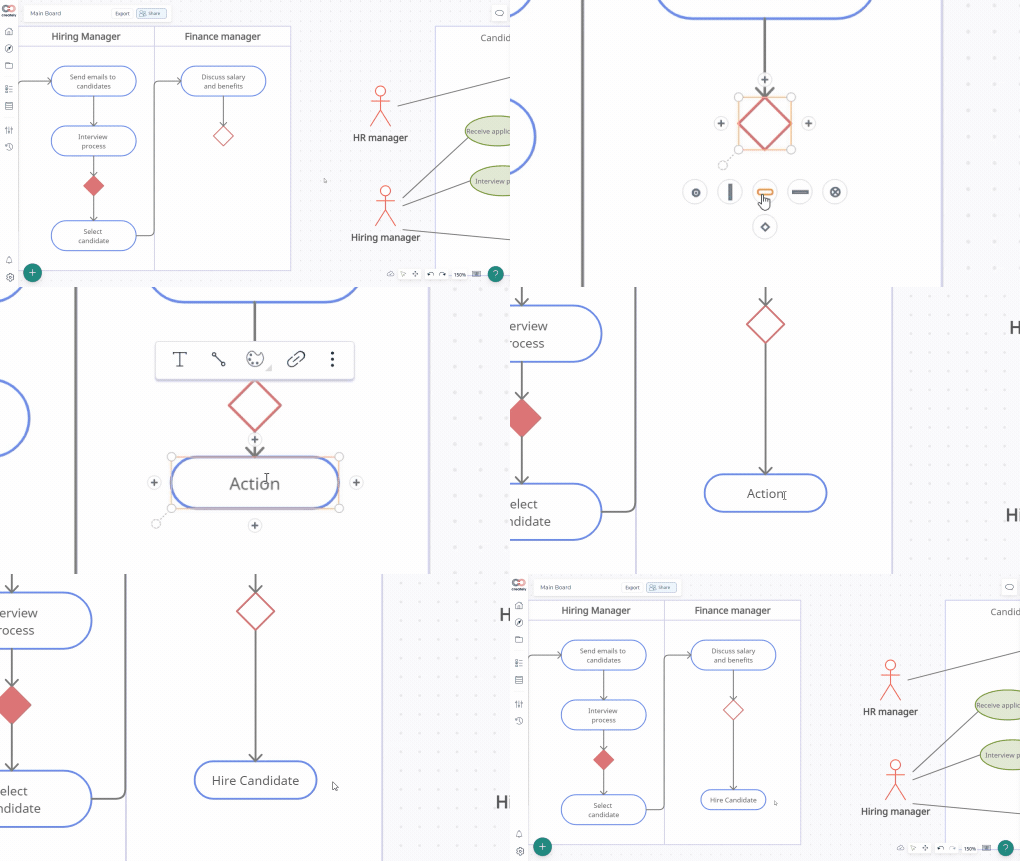
Since we know most of you like to draw them we took an extra effort to make creating flowcharts as easy as possible. Our flowchart software has some powerful features like 1-click create and connect which makes drawing them a breeze. Plus we have some professionally designed templates for you to get started fast.
What are the symbols used in flowcharts?
Misunderstanding flowchart symbols are certainly something that could leave you in a quandary. The basic flowchart symbols are diamonds and rectangles. However, there are much more symbols you can use to add more meaning to your flowchart.
While there is no strict protocol as such when it comes to using boxes, circles, diamonds or such symbols in drawing a flowchart, they do help you to illustrate and make sense of the types of events in the chart with more clarity. Described below are standard symbols along with a visual representation right below.
- Data object – The Data object, often referred to as the I/O Shape shows the Inputs to and Outputs from a process.
- Rectangle – This is used to represent an event which is controlled within the process. Typically this will be a step or action which is taken.
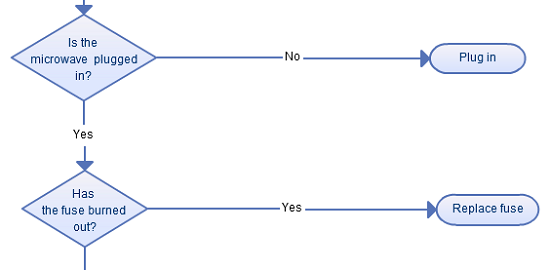
- Diamond – Used to represent a decision point in the process. Typically, the statement in the symbol will require a `yes’ or `no’ response and branch to different parts of the flowchart accordingly.
- Document – The Document object is a rectangle with a wave-like base. This shape is used to represent a Document or Report in a process flow.
- Rounded box – This is used to represent an event which occurs automatically. Such an event will trigger a subsequent action, for example, receiving a telephone call, or describing a new state of affairs.
- Stored data – This is a general data storage object used in the process flow as opposed to data which could be also stored on a hard drive, magnetic tape, memory card, of any other storage device.
- Manual input – This object is represented by a rectangle with the top sloping up from left to right. The Manual Input object signifies an action where the user is prompted for information that must be manually inputted into a system.
- Direct data – Direct data object in a process flow represents information stored which can be accessed directly. This object represents a computer’s hard drive.
- Circle – Used to represent a point at which the flowchart connects with another process. The name or reference for the other process should appear within the symbol.
- Internal storage – This is an object which is commonly found in programming flowcharts to illustrate the information stored in memory, as opposed to on a file.
- Predefined process – This allows you to write one subroutine and call it as often as you like from anywhere in the code.
A few Best Practices in Flowcharting
While learning the various symbols that are associated with flowcharts are rather important, you need to also remember that there are certain guidelines in flowcharting that deserves some respect as well. The following are some guidelines in flowcharting:
1. Proper Form is Essential: In drawing a proper flowchart, all necessary requirements should be listed out in a logical order.
2. Clarity is Paramount: The flowchart should be clear, neat and easy to follow. There should not be any room for ambiguity in understanding the flowchart.
3. Stick to the Right Direction: The usual direction of the flow of a procedure or system is from left to right or top to bottom.
4. The standard for Flow Lines: Ideally just one flow line should come out from a process symbol. While only one flow line should enter a decision symbol, around three flow lines (depending on the answer) should leave the decision symbol. Additionally, only one flow line is utilized together with a terminal symbol.
5. Be Concise, not Copious: Write within standard symbols briefly.
6. Logic precedes Everything: If you are dealing with a complex flowchart then use connector symbols to minimize the number of flow lines. Ditch the intersection of flow lines to ensure effectiveness and better communication. It is imperative that your flowchart has a logical start and finish.
Flowchart Examples
Here are some simple flowchart templates to get going.
Drawing from scratch can be painful. So we’ve come up with simple flowcharts for you to get started immediately. Click on the image to directly modify the below flowcharts using our flowcharting tool.
Here’s another simple one with a bit more processes.
These are some of the simple ones. You can find much more by browsing our flowchart templates.
Your Thoughts on the Flowchart Basics Guide
That wraps up this post and I hope you can create a simple flowchart by now. This only covers the flowchart basics. To learn about flowcharts in details check out our flowchart tutorial. Happy Diagramming!.



This is a good overview of flow charts. I use Omnigraffle and Google Draw when making flow charts. I will have to take a look at Creately.
Can I download?:)
“When it comes to wireframe the first comer has a huge advantage and all the fans create a huge wall for the late comers. I wonder how long the fans are going to resist
MockupTiger? Once you use it you will fall in love!”