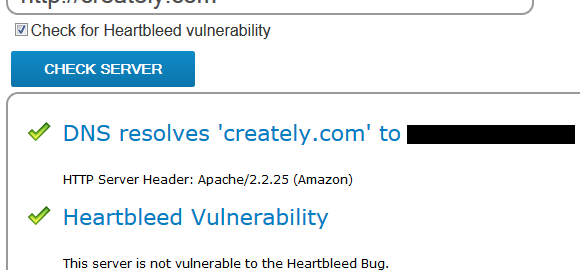
I’m sure most of you have heard about the heart bleed bug now. If not it’s a new security bug that has left the sensitive data of millions across the web vulnerable. But the good news is Creately users are… Read More


I’m sure most of you have heard about the heart bleed bug now. If not it’s a new security bug that has left the sensitive data of millions across the web vulnerable. But the good news is Creately users are… Read More

Creately is proud to be the software partner for the FUTURES – Social Innovation Forum organized by the British Council of Sri Lanka (BC). The event will be held on 21st Friday and 22nd Saturday at the Hilton Colombo. For the… Read More

Flowcharts and Gantt charts are both effective tools to plan projects. However, when it comes to project execution, both have different uses and applications. For a complex plan with a longer duration, a Gantt chart is better, and for short… Read More

Fishbone diagrams, aka Ishikawa diagrams are used across various industries to analyze causes and their effect. Because of this, they are referred to as cause and effect diagrams too. It provides a systematic approach to deeply analyze a problem when… Read More

What is a Venn Diagram? Venn diagrams define all the possible relationships between collections of sets. The most basic Venn diagrams simply consist of multiple circular boundaries describing the range of sets. The overlapping areas between the two boundaries describe… Read More

Ask any student – essay writing is one of the most despised tasks of their educational career. Perhaps there is so much displeasure associated with the task because it’s perceived as too linear – there isn’t enough visual and creative… Read More