Easily visualize your processes and workflows with smart automation.
Create visual organizational structures with images and detailed profiles.
Visualize concepts and their relationships on an infinite visual canvas.
Map family history and understand the relationships with detailed genograms.
Visualize relationships between entities using Crows Foot or Chen notation.
Visualize your network infrastructure. Support AWS, CISCO, Azure and more.
Visualize and expand your ideas using our powerful mind mapping tool.
Easily create family trees with our professionally designed templates.
Infinite canvas to add diagrams, images, sticky notes and more.
Run collaborative meetings, workshops or brainstorming sessions.
Collaborative diagramming for educators and students at discounted rates.
Log In
Sign Up Free
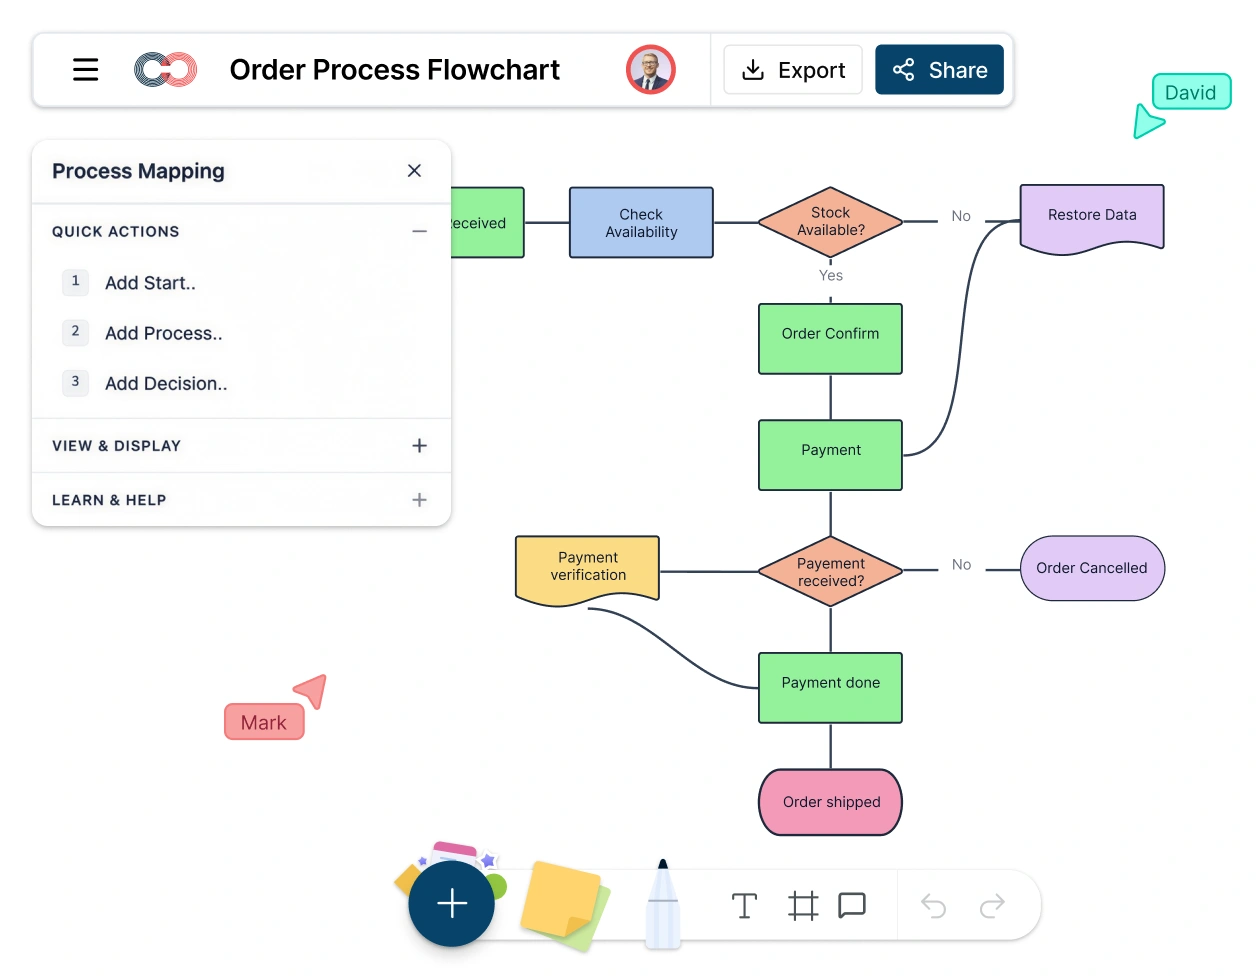
Creately’s process mapping tool is designed for operations, BPM, and cross-functional teams to map workflows, find bottlenecks, standardize processes, and document SOPs in one shared workspace.
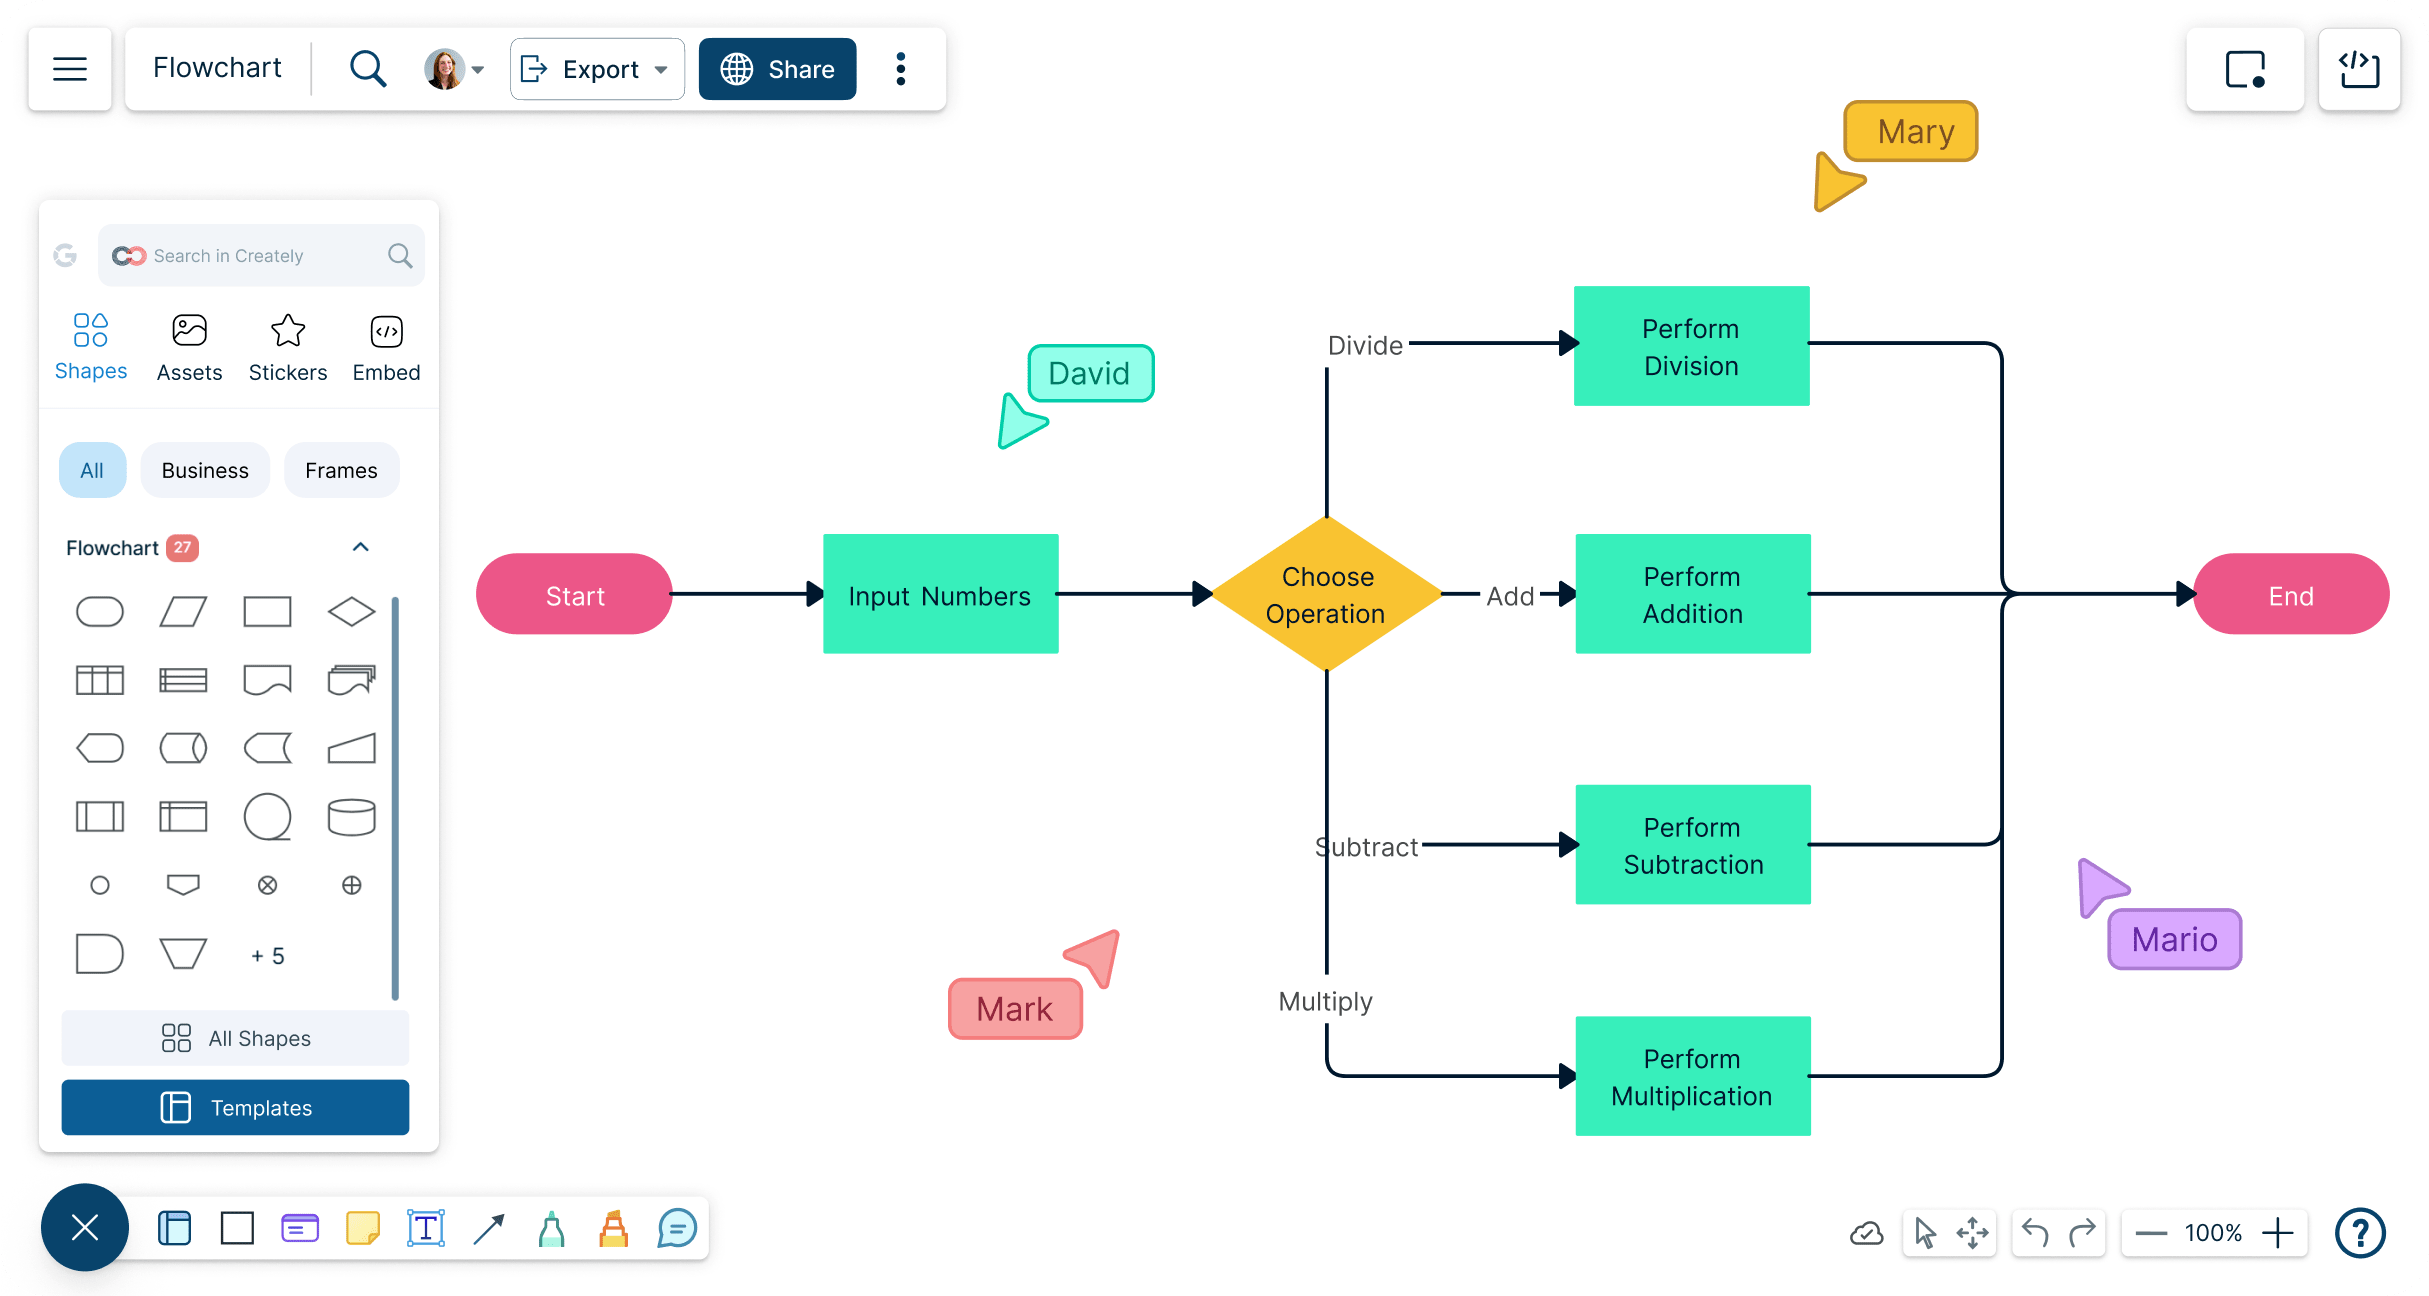
Collaboratively map processes and workflows with Creately’s flowchart software for Mac, delivering a smooth, optimized experience on Safari, Chrome, and other macOS browsers.
Create clear workflow diagrams in minutes — map processes, assign owners, and turn diagrams into action-ready playbooks that your team can follow and improve.
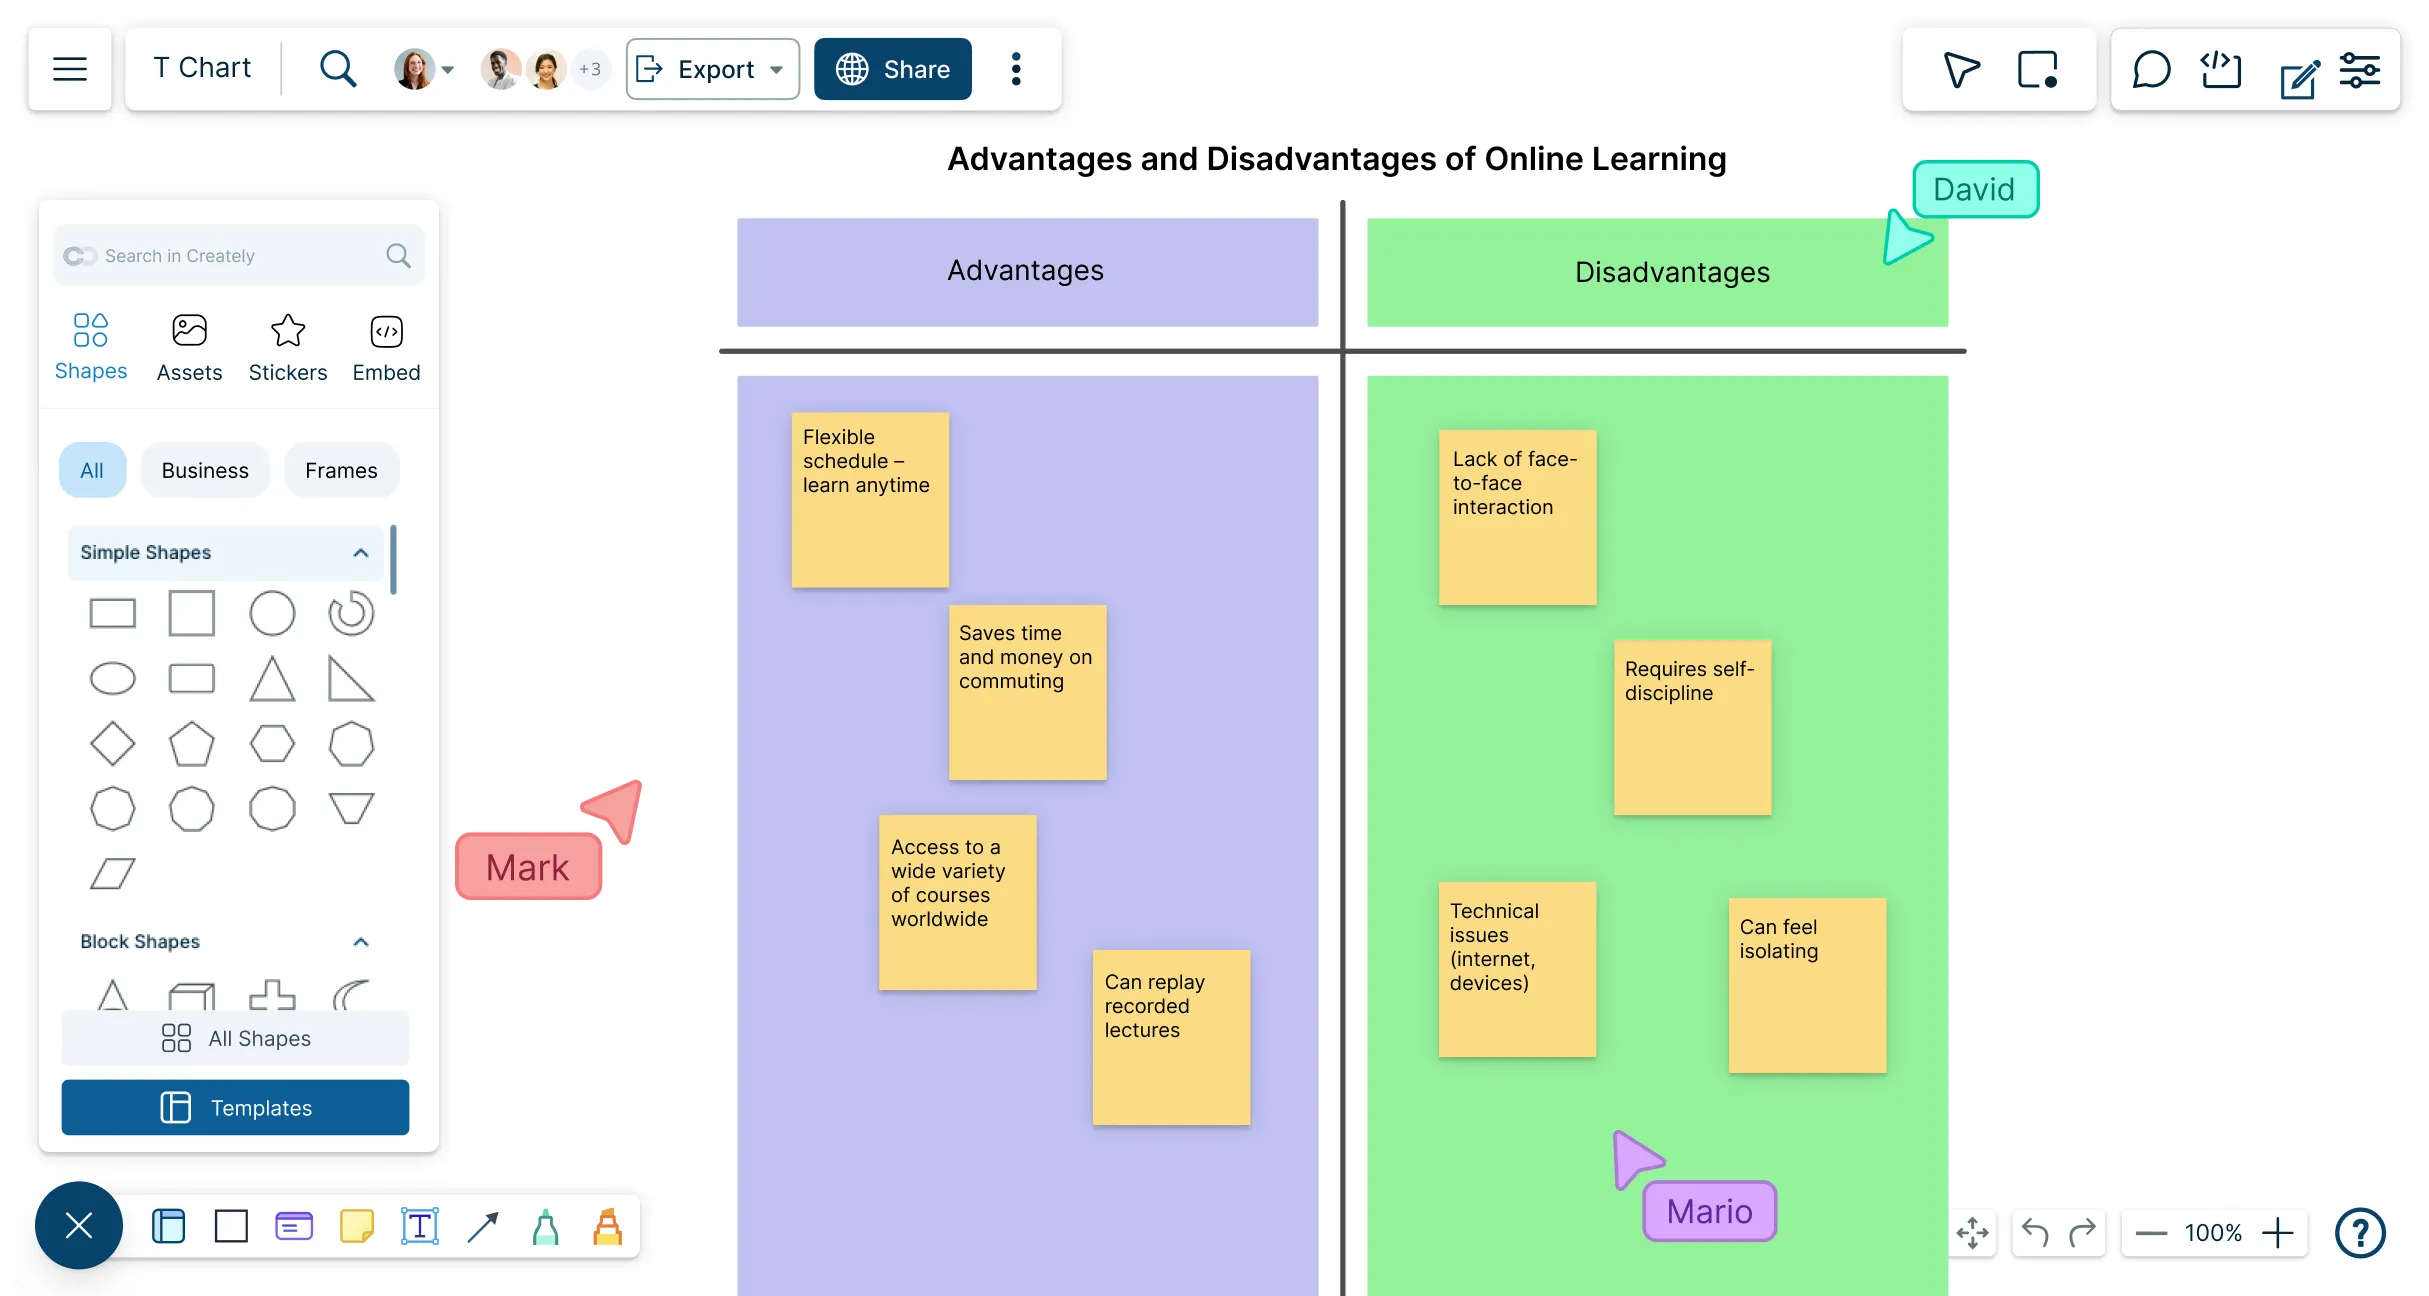
Compare and contrast opposing views, including facts vs. opinions, advantages vs. disadvantages or strengths vs. weaknesses, with our free intuitive T chart creator.
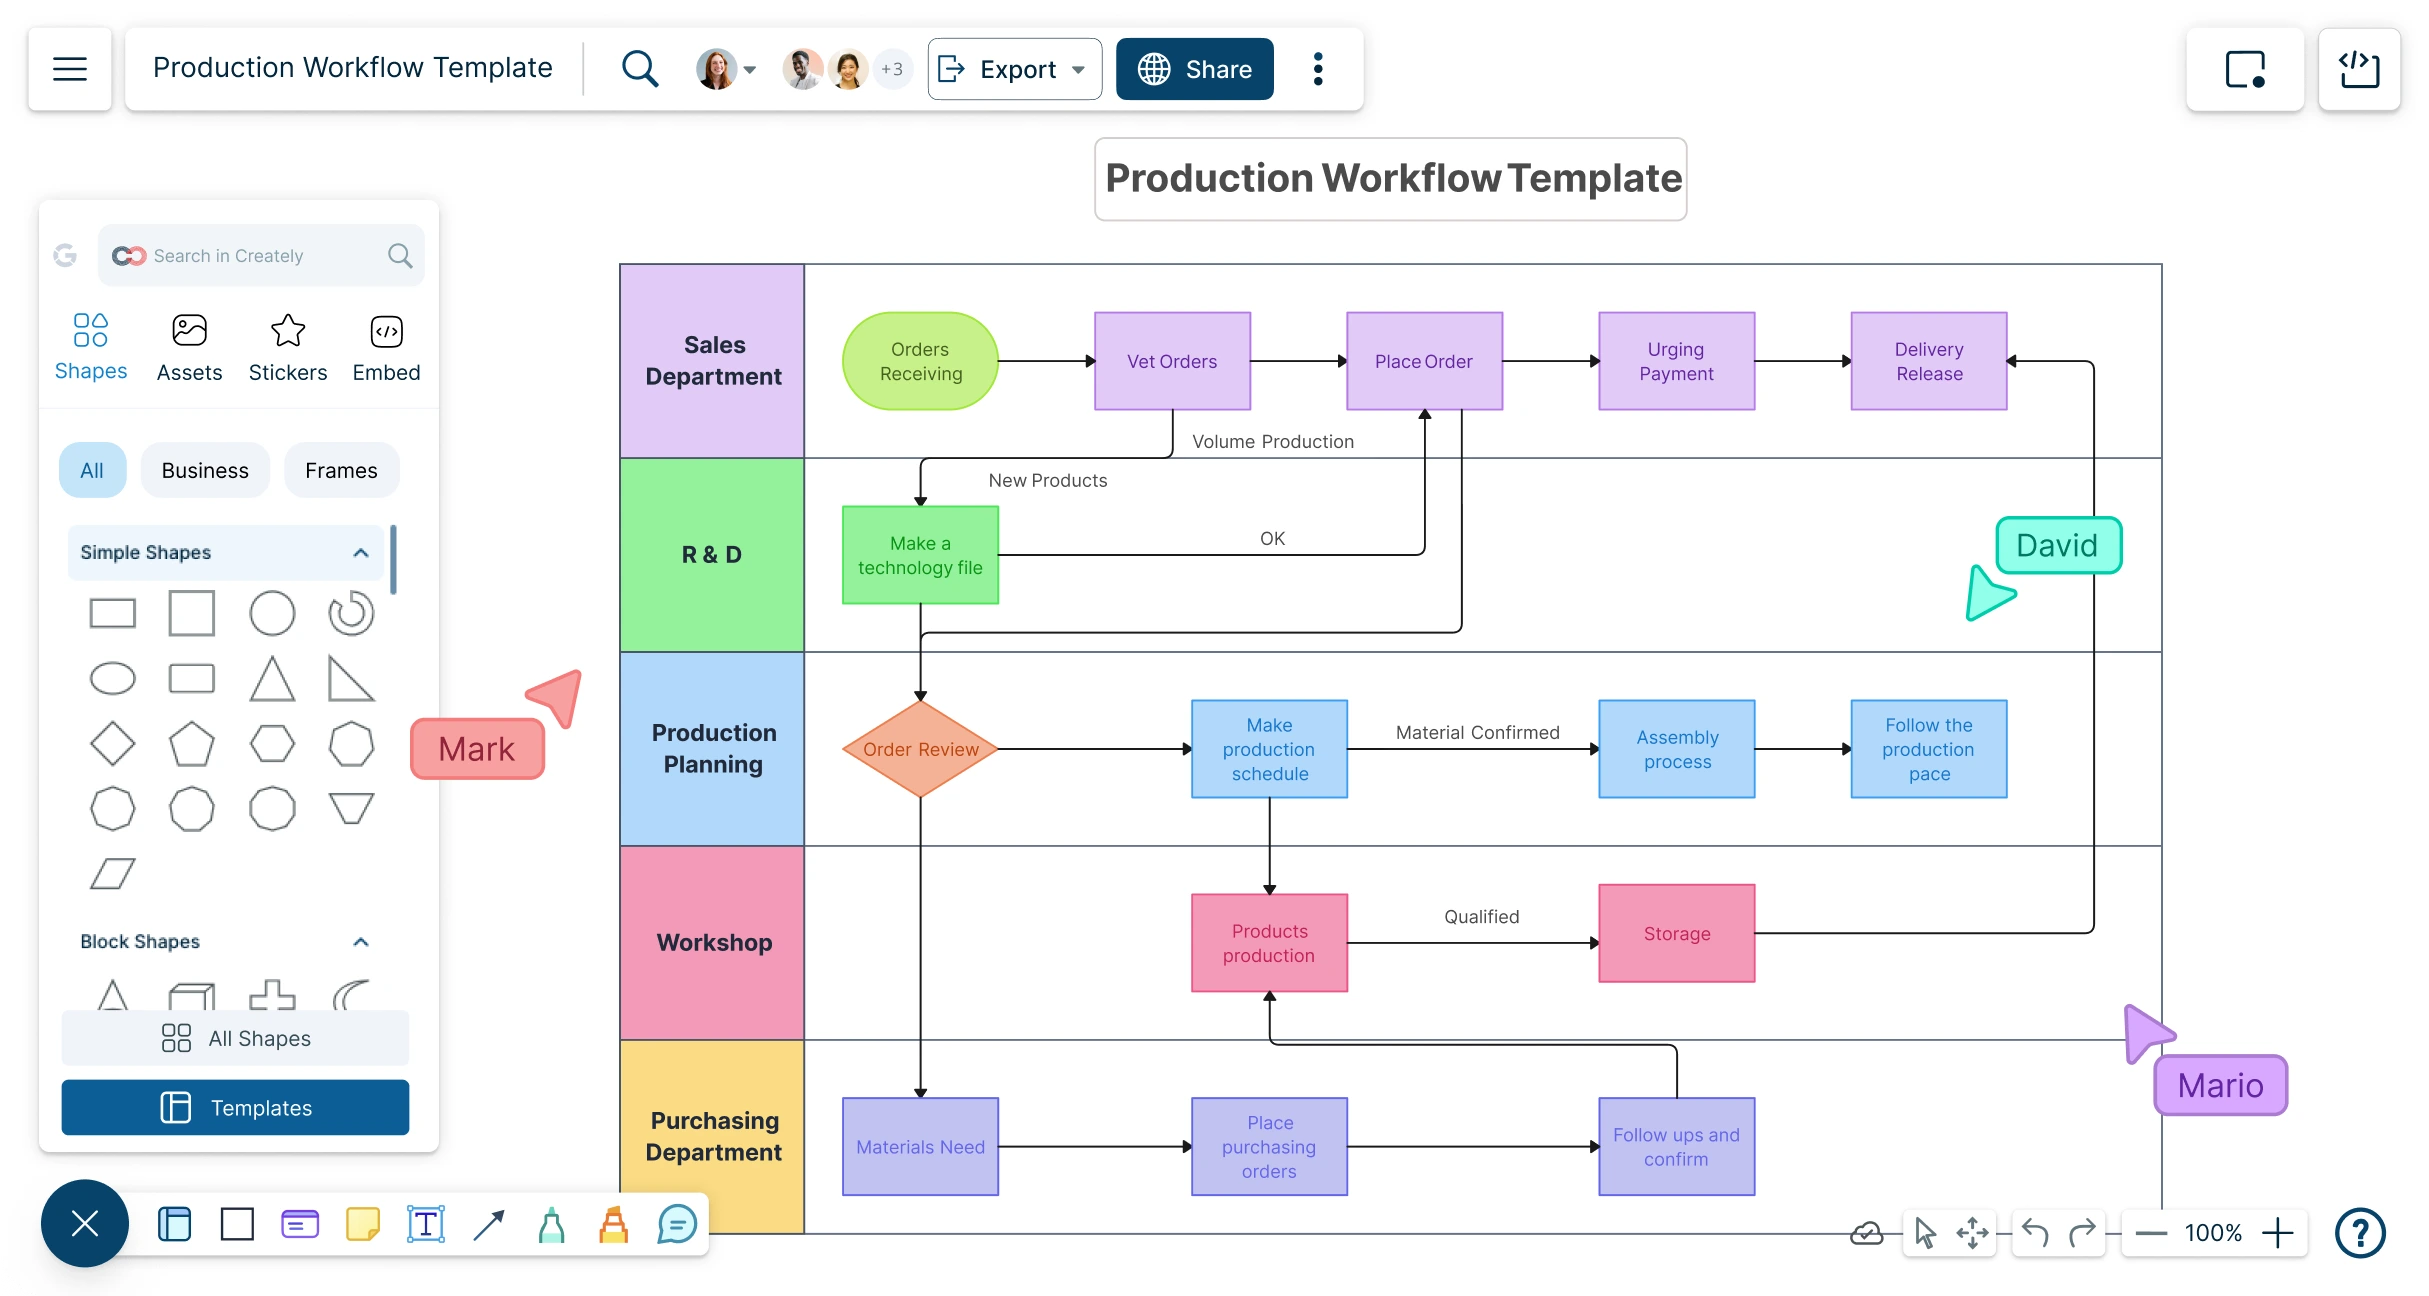
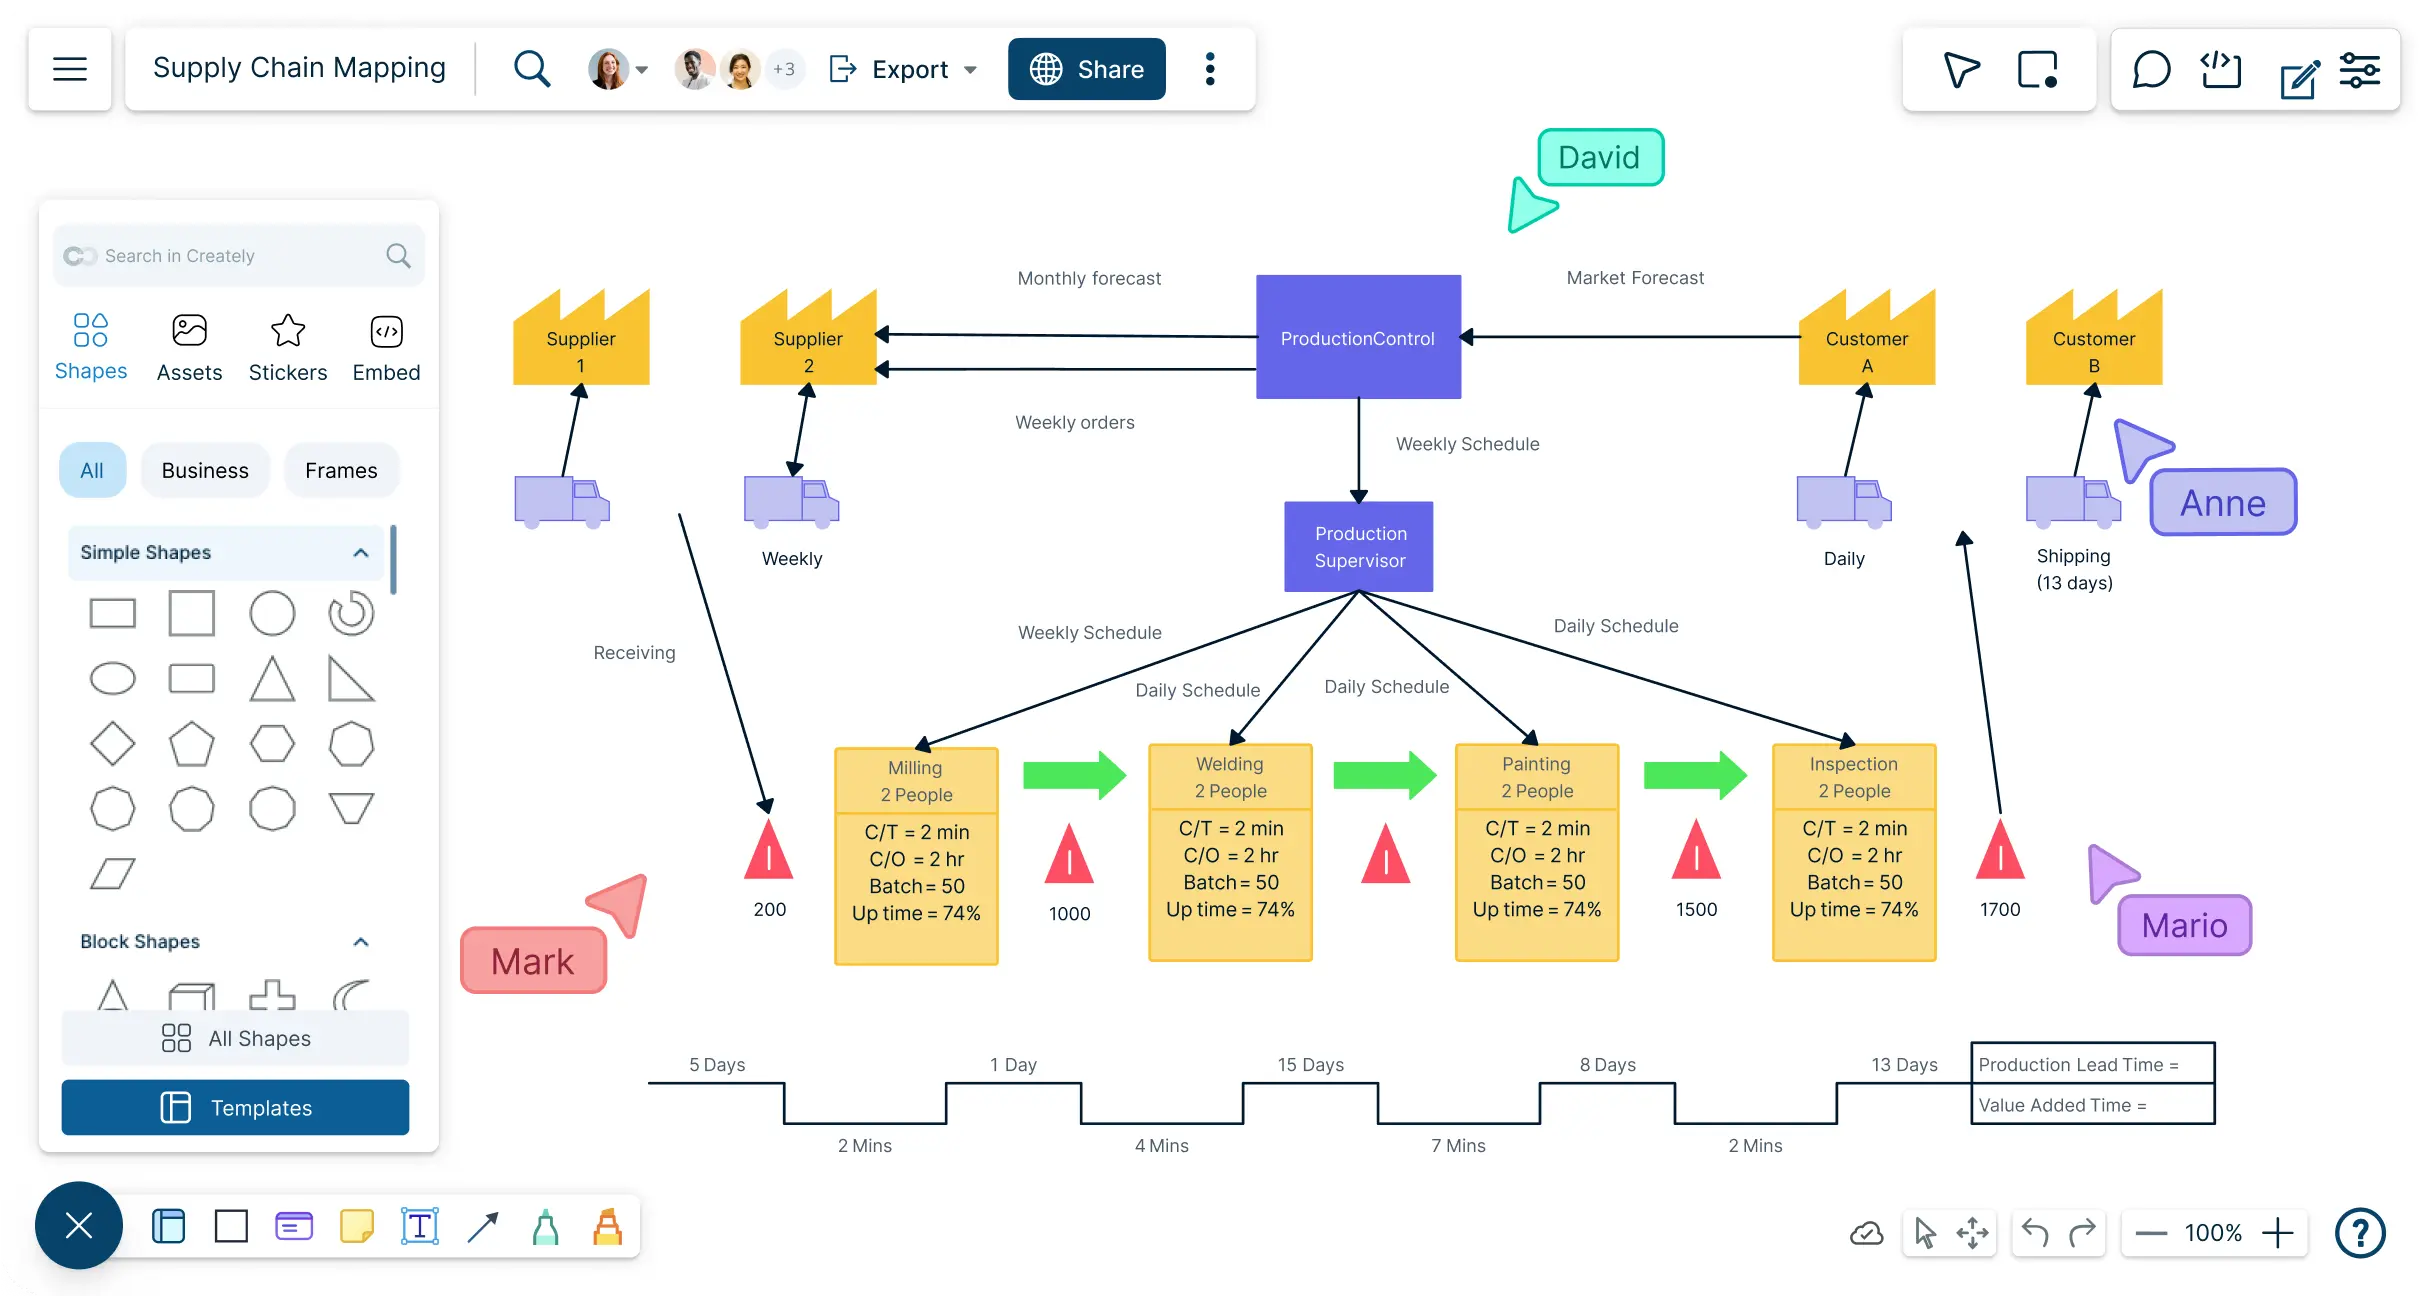
Map, analyze, and optimize your supply chain to identify inefficiencies, collaborate, and create charts that drive smarter decisions.
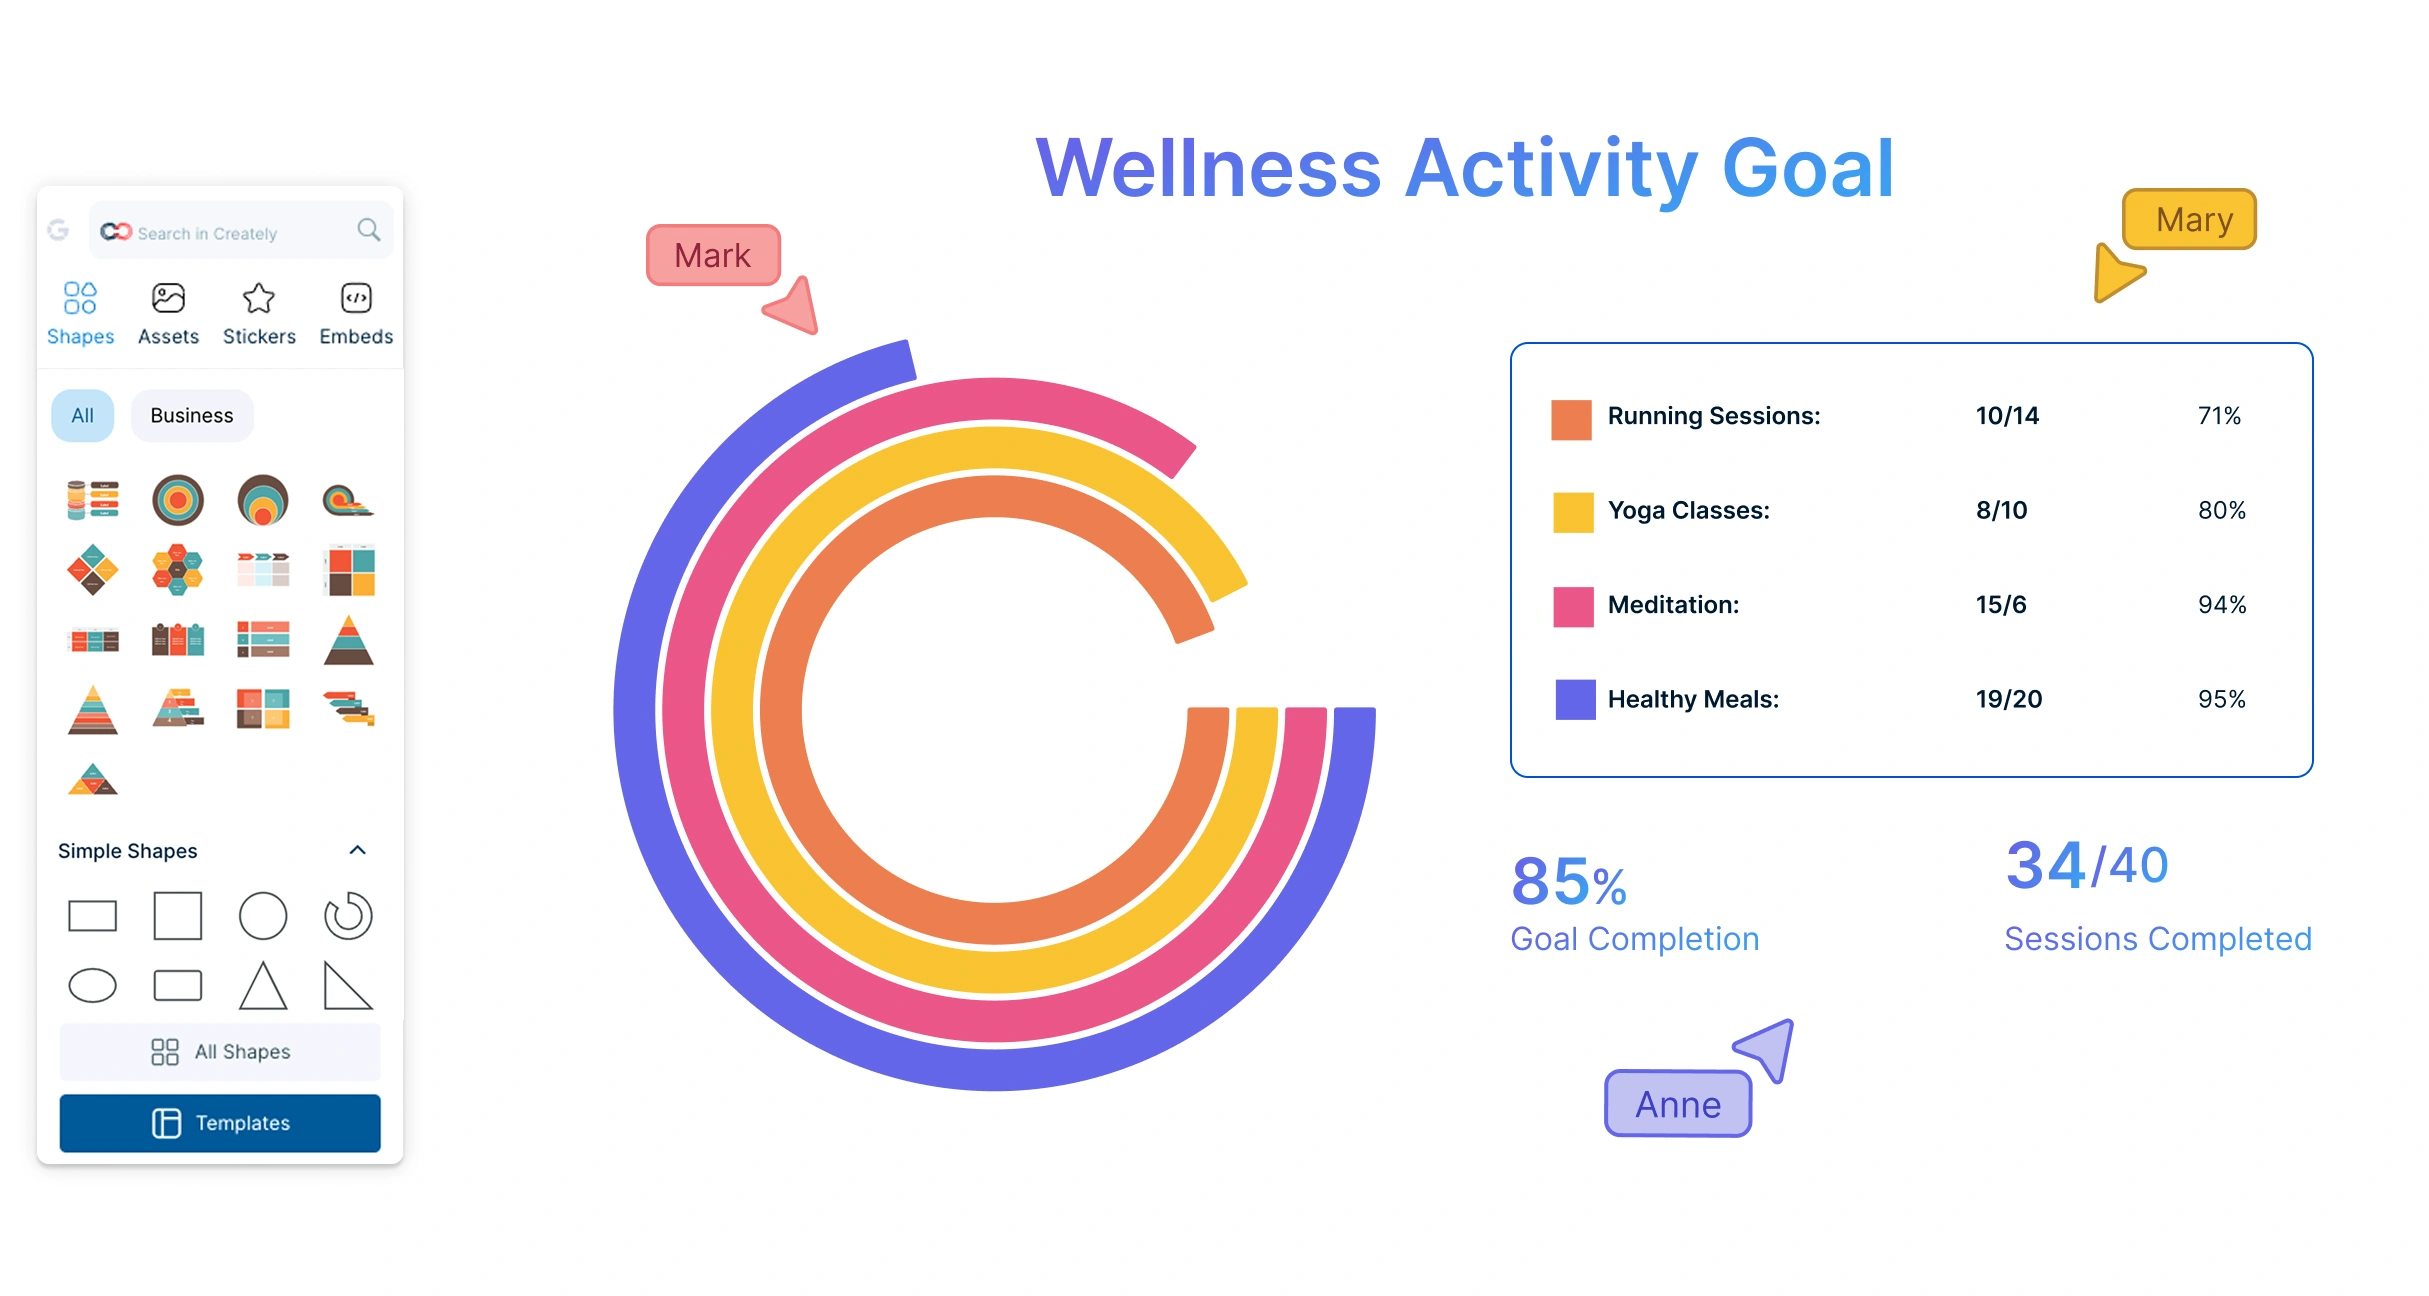
Effortlessly transform your data into visually engaging donut charts. Visualize sales data, project progress, or survey insights with clarity.
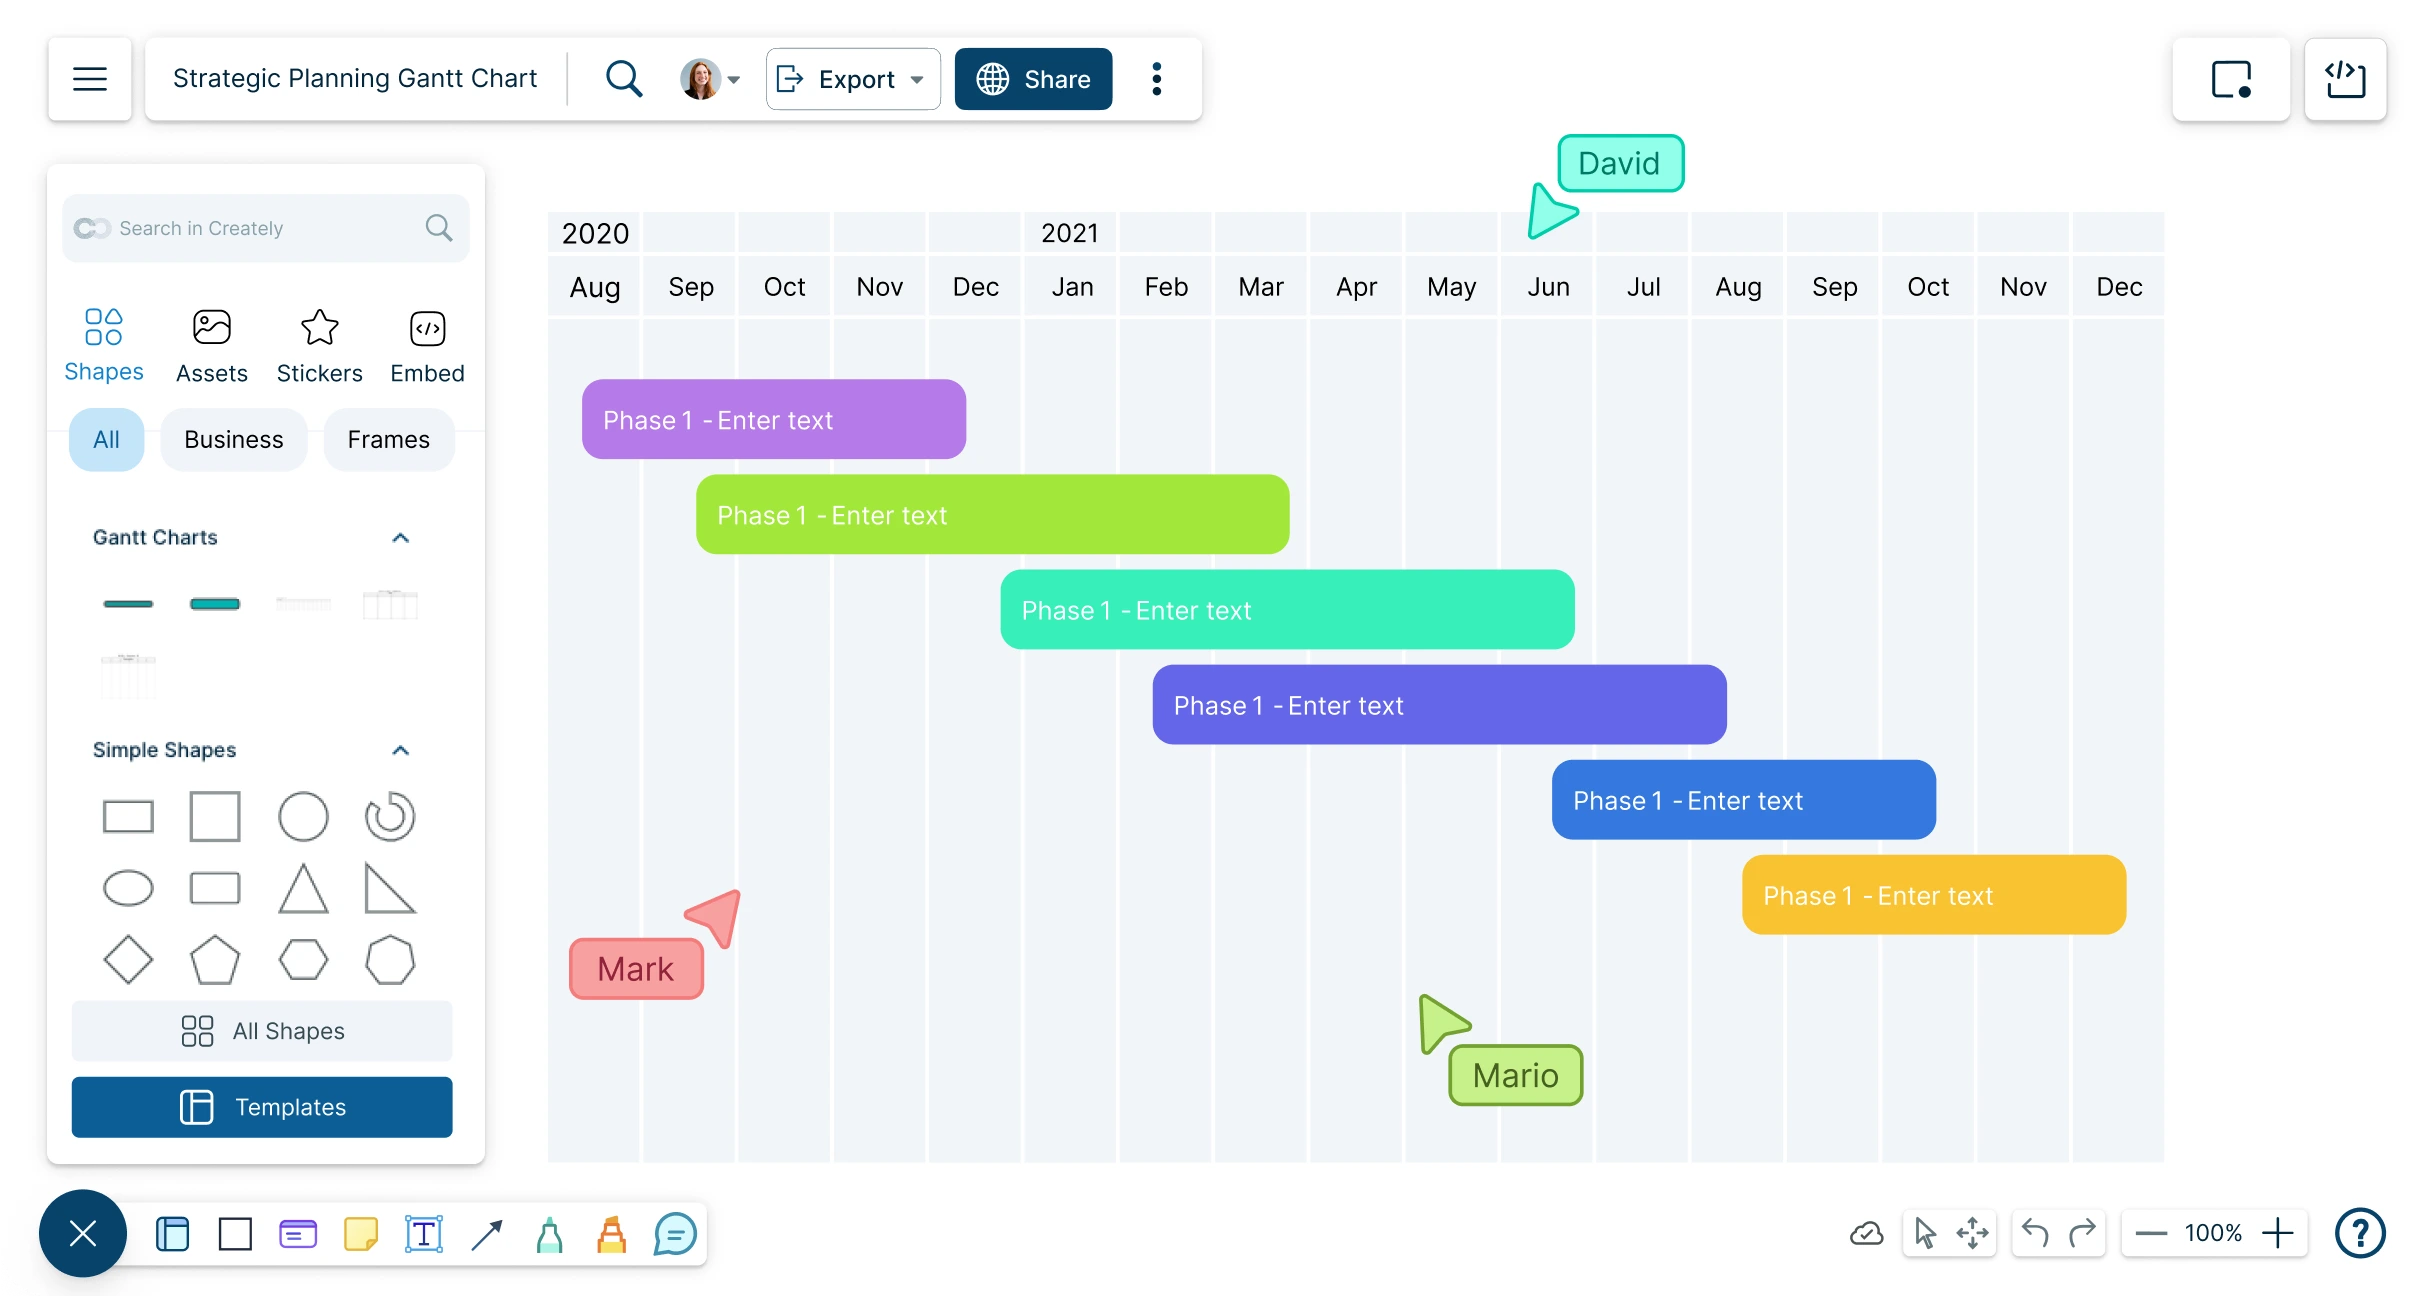
Create timelines for any event; track and analyze your team’s projects and tasks from start to finish with Creately’s Online Gantt Charts.
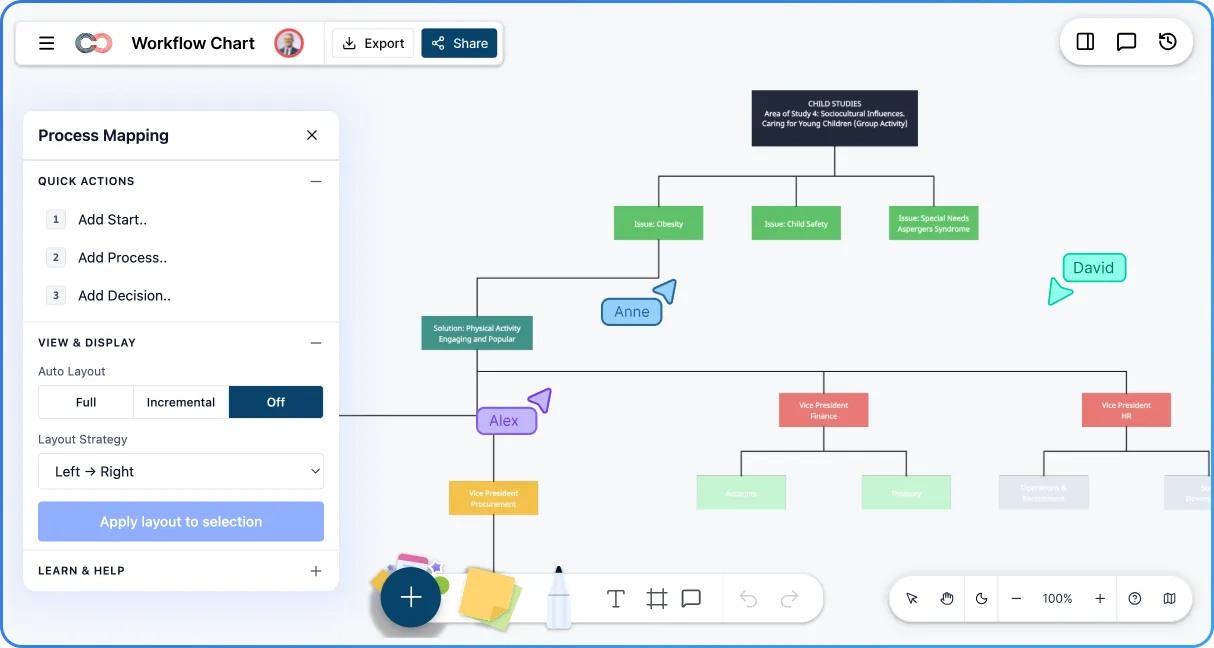
Visualize tasks, decisions, and handoffs clearly with Creately’s Workflow Chart Creator. Build professional workflow charts faster, improve team clarity, and keep every process running smoothly from start to finish.
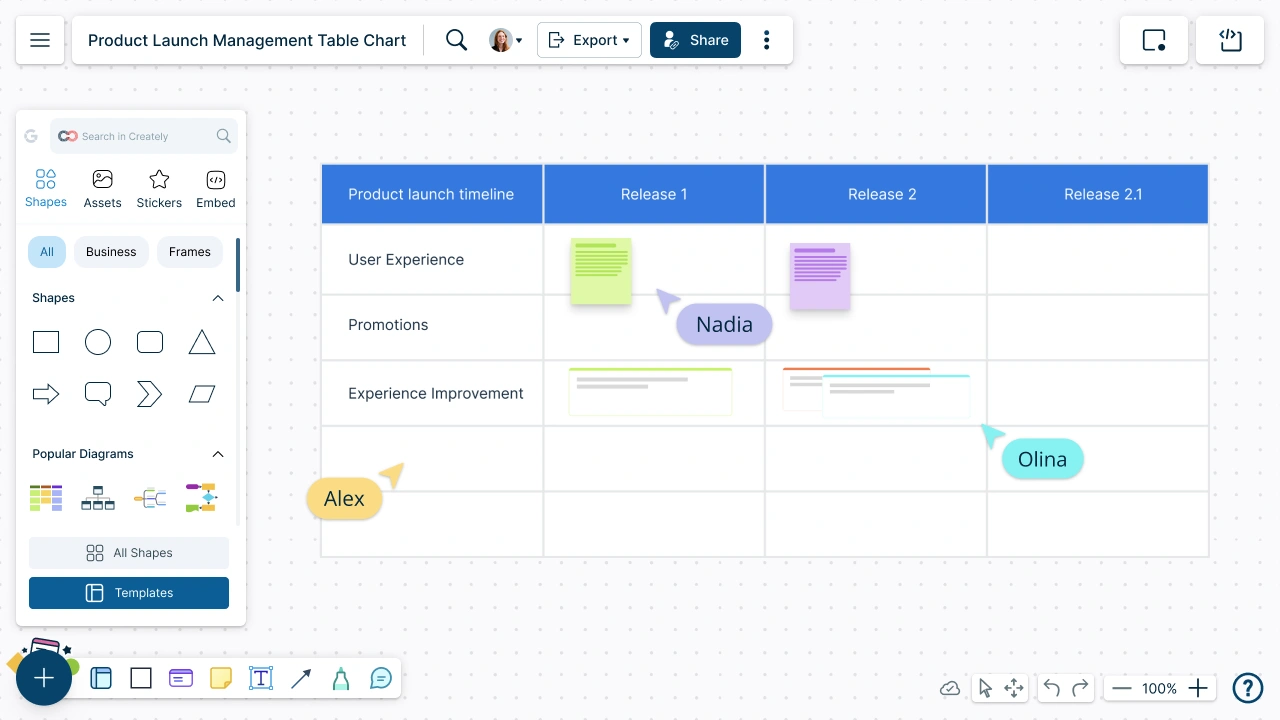
Create visually stunning table charts to organize your information and data with Creately’s table creator. Arrange your data in meaningful ways and interact with them to make effective data-driven decisions.
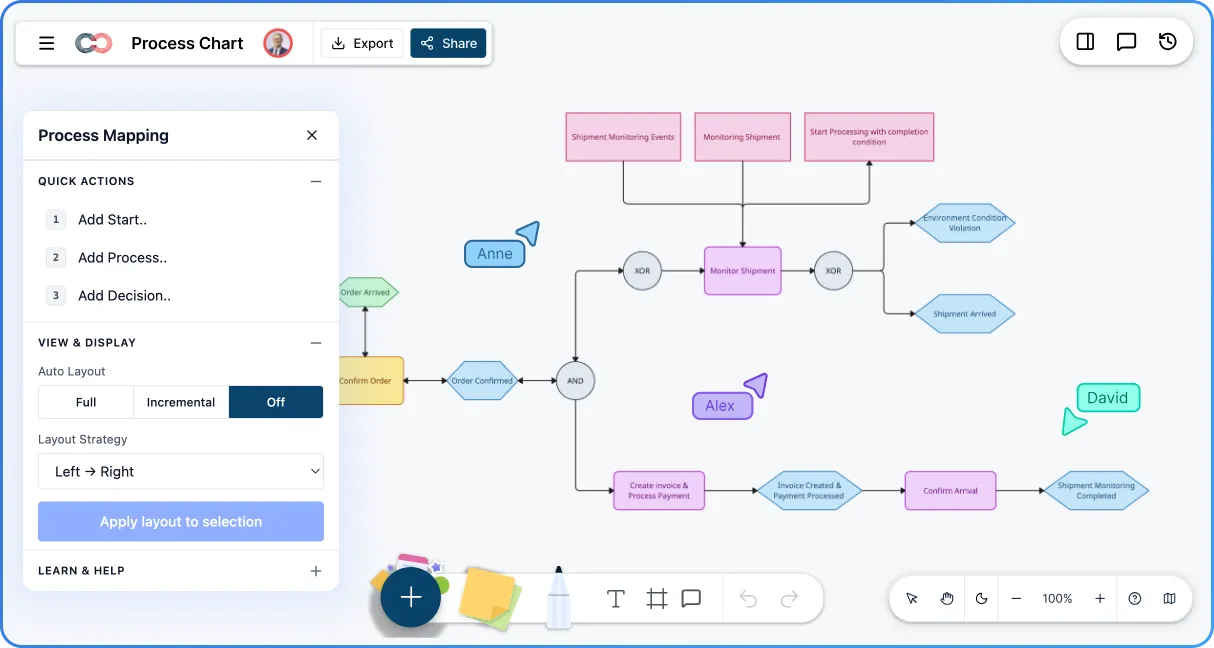
Map workflows online with clarity and precision. Creately’s process chart creator helps teams plan, refine, and execute processes efficiently—boosting collaboration and ensuring reliable results.
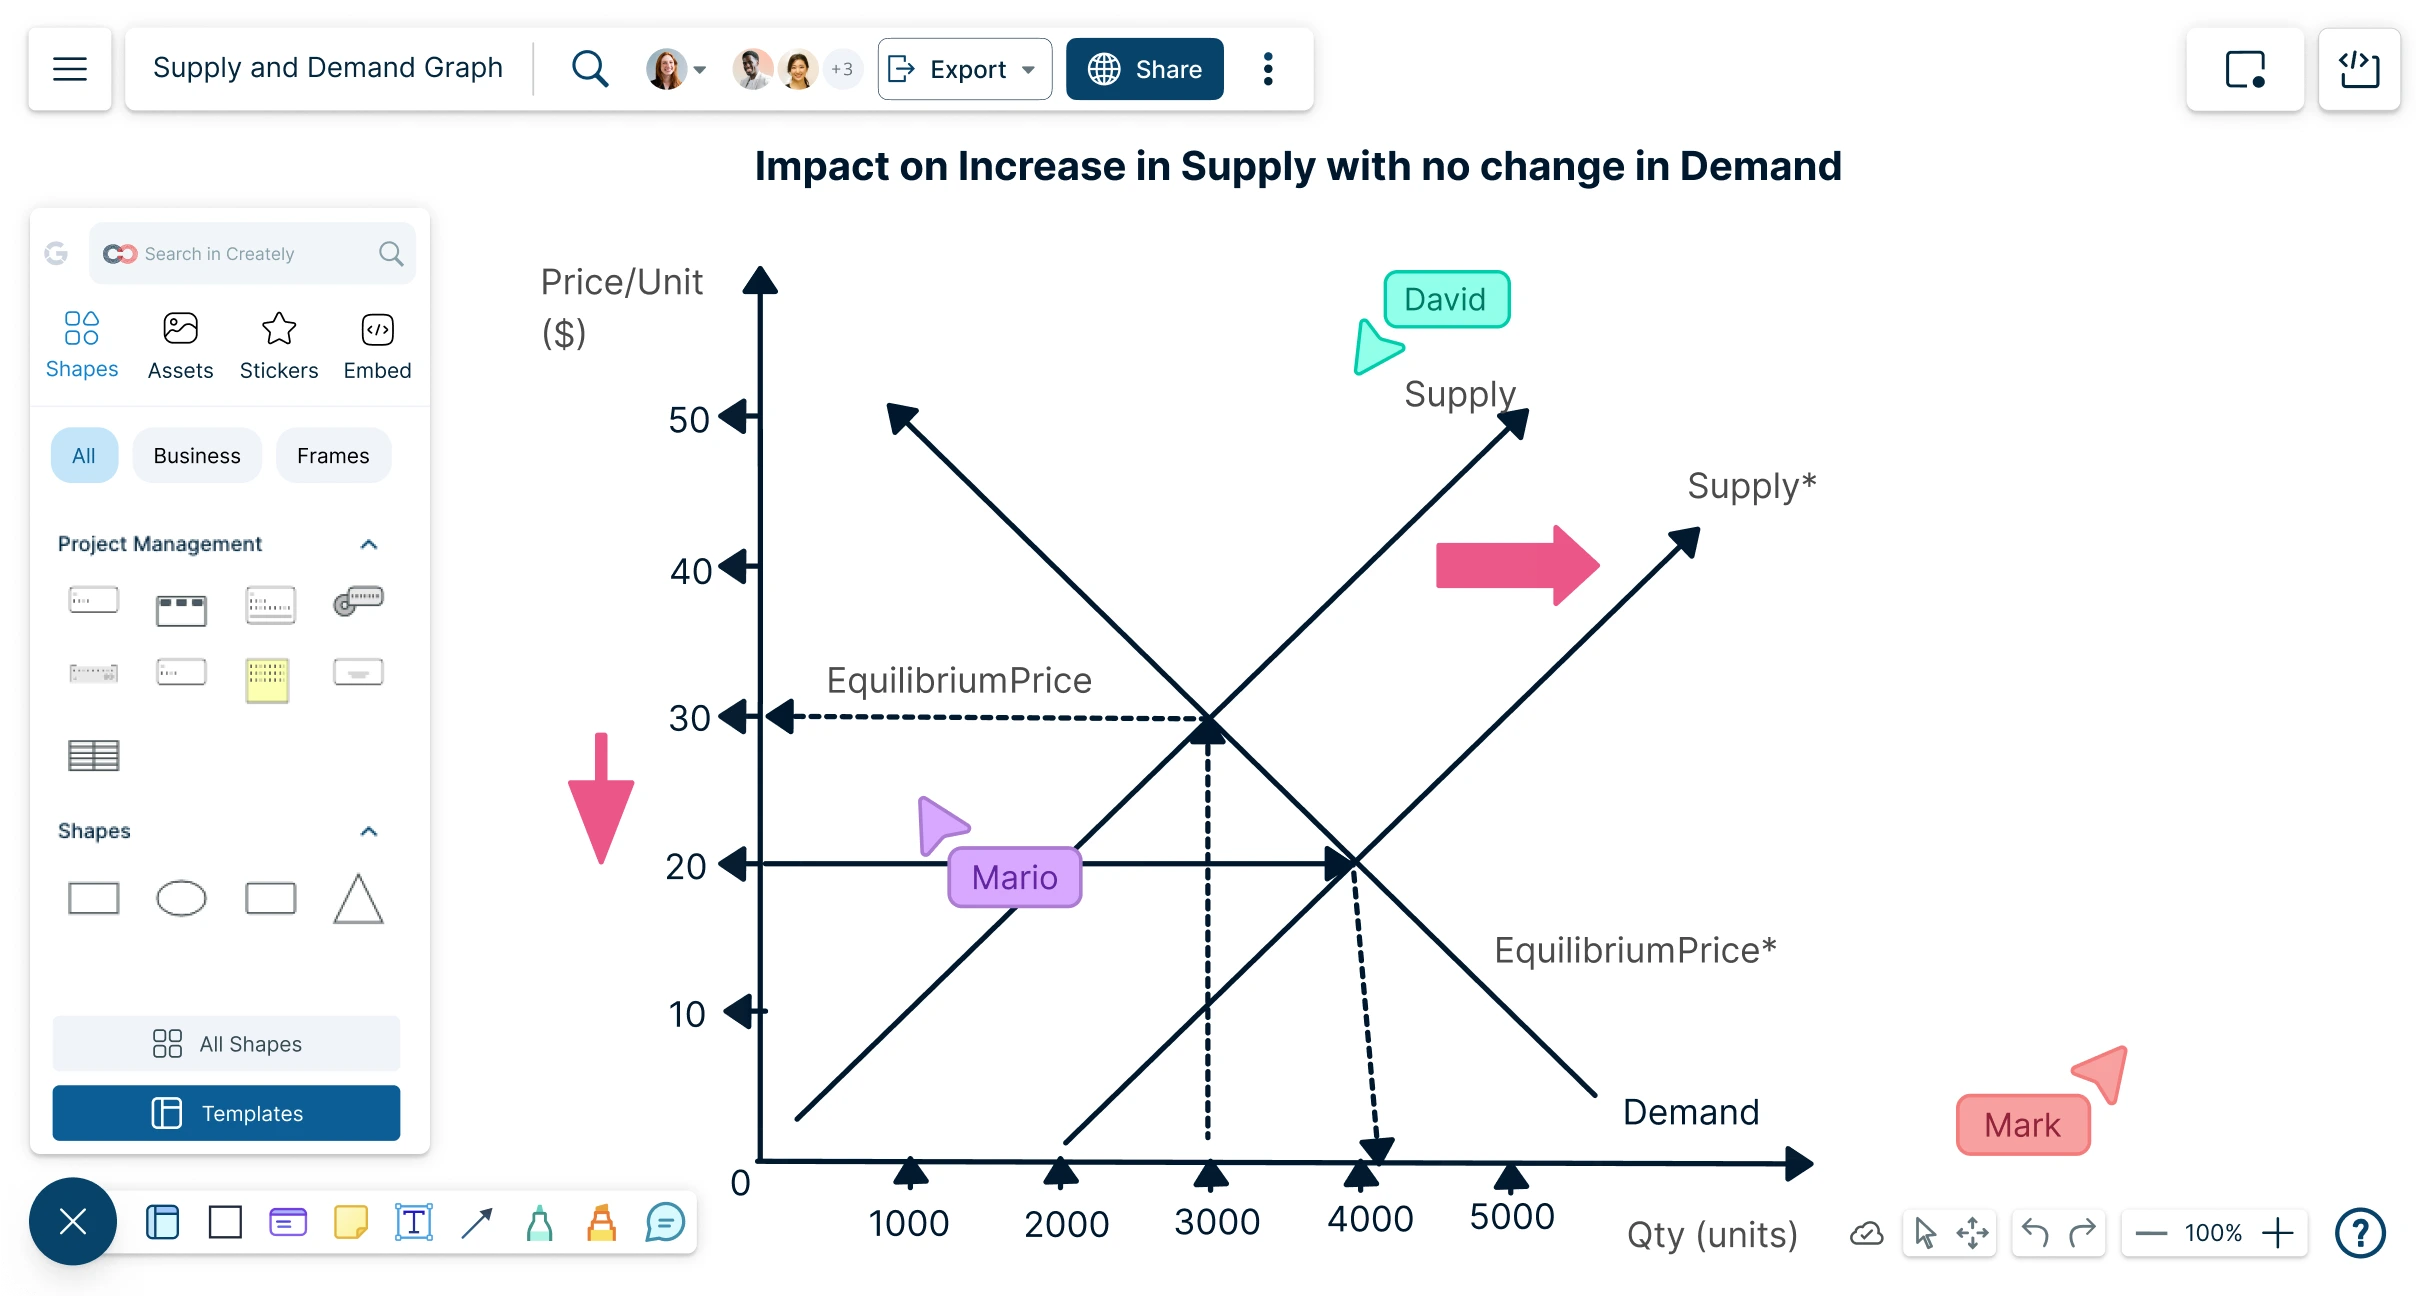
Understand how changes in supply or demand can affect the price and quantity of a good or service in the market.
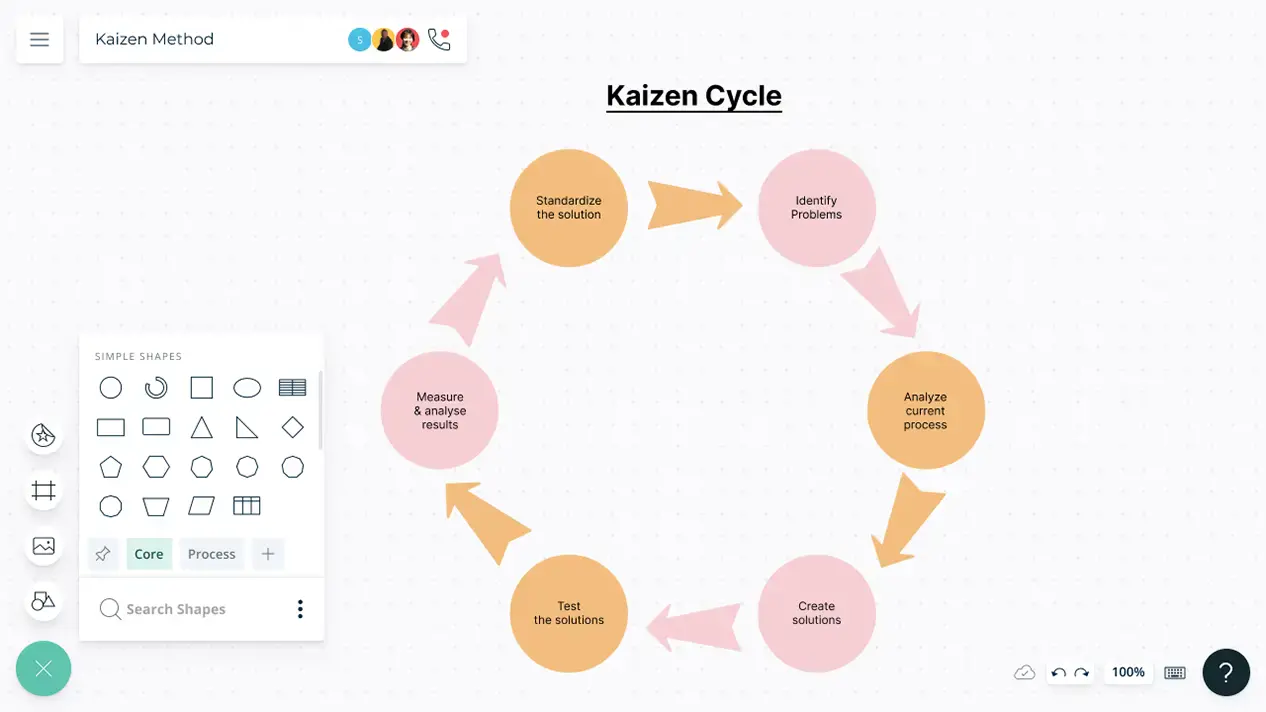
Learn how you can use the Kaizen method in Creately for strategic resource planning and process optimization and waste reduction to maximize productivity.
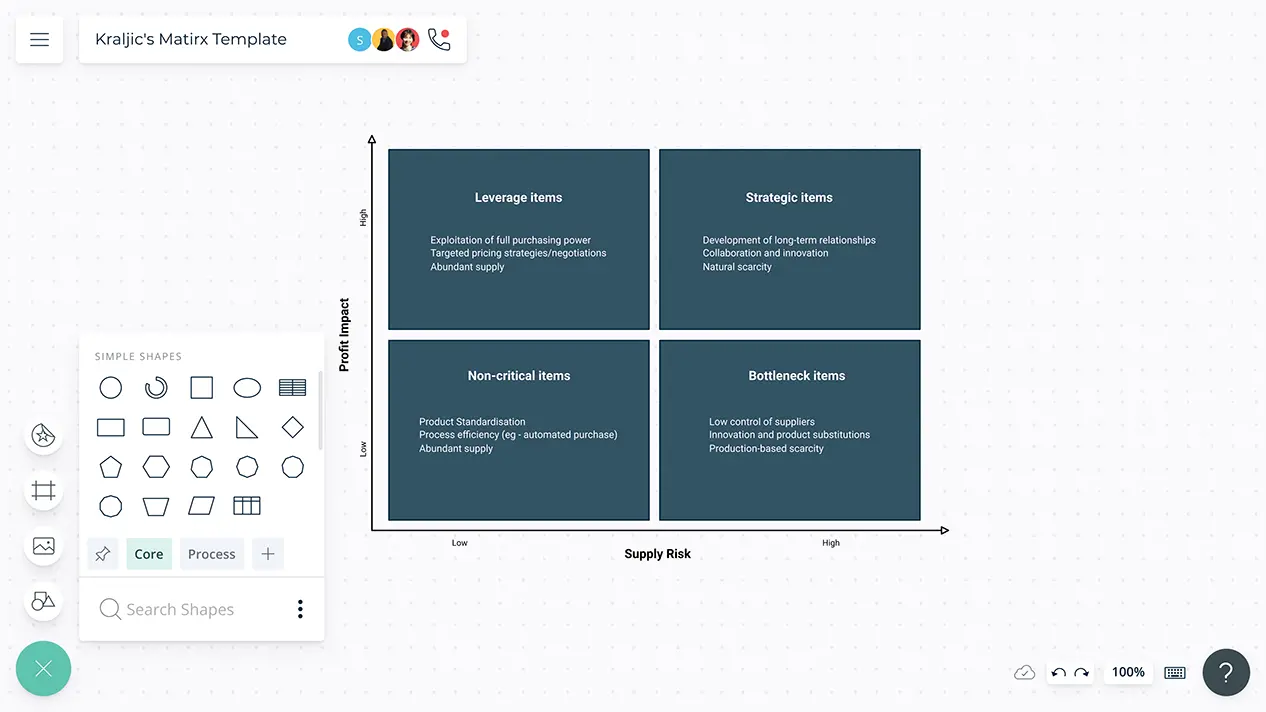
Use this visual framework to segment your vendor base and manage supplier relationships based on risk and profitability.
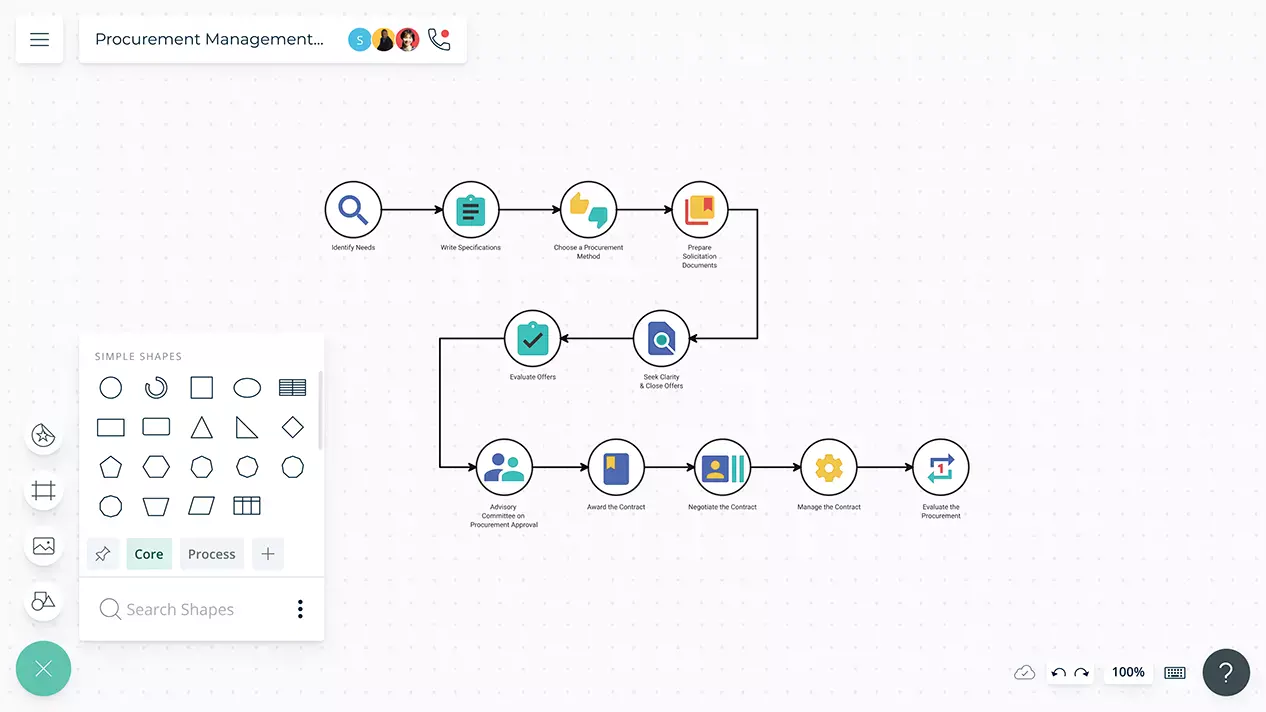
Visual templates to plan and develop effective procurement strategies for your organization.
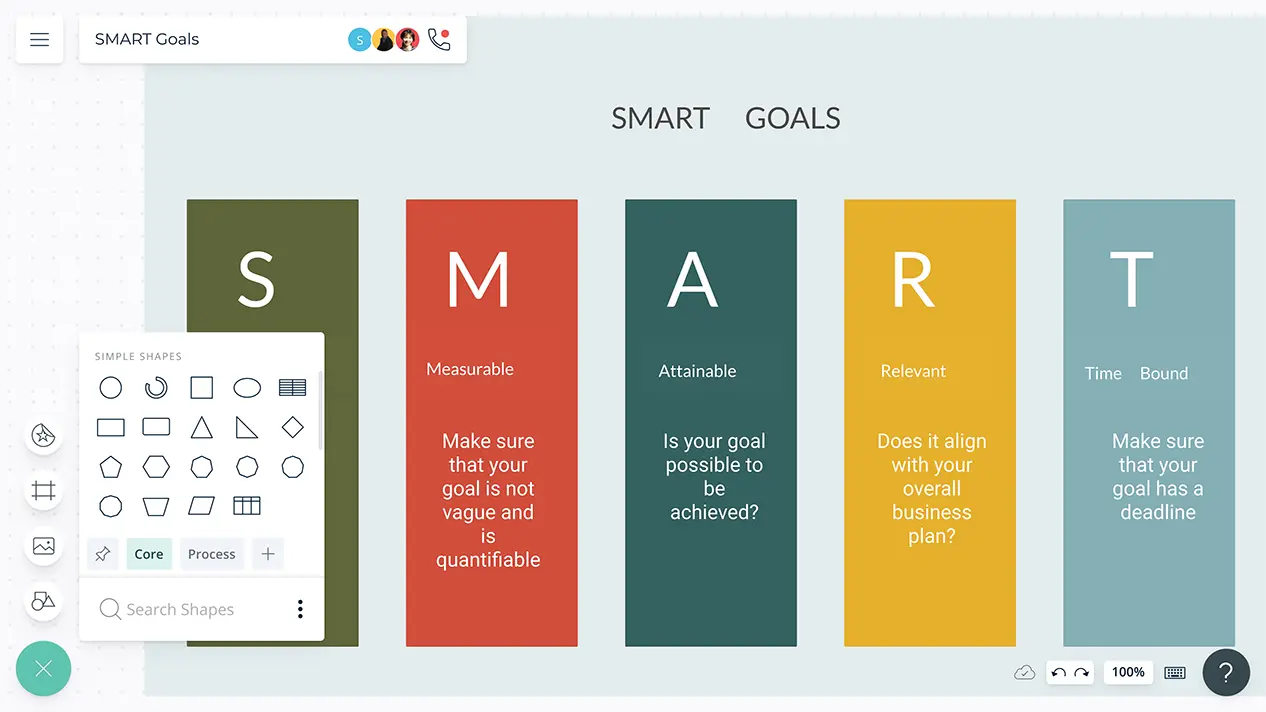
SMART goal template and worksheets to plan and improve the chances of succeeding in accomplishing organizational goals.