When it comes to analyzing the requirement of a system use case diagrams are second to none. They are visual and usually very easy to understand. The following use case diagram guidelines will help you to create better use cases… Read More
When it comes to analyzing the requirement of a system use case diagrams are second to none. They are visual and usually very easy to understand. The following use case diagram guidelines will help you to create better use cases… Read More

Fishbone diagrams, aka Ishikawa diagrams are used across various industries to analyze causes and their effect. Because of this, they are referred to as cause and effect diagrams too. It provides a systematic approach to deeply analyze a problem when… Read More
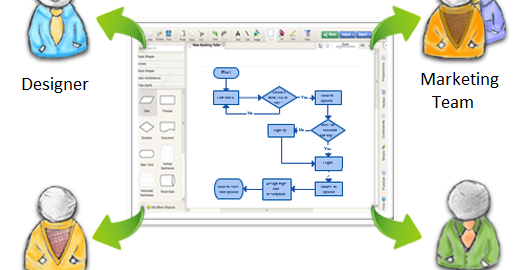
While I hate the business-speak cliché, “breaking down silos,” the idea that individuals and individual departments develop tunnel vision when they don’t work together bears repeating. As a former content strategist and full-time writer, I’ve worked within many an organization… Read More
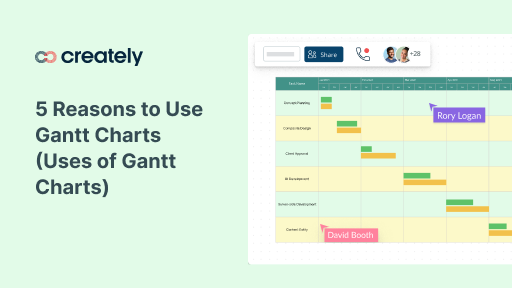
As there are many uses of Gantt charts, thousands of companies use Gantt charts to become more productive, enhance their communications, forecast over the long term and track results. While some naysayers believe they limit the size of the project… Read More

Both SWOT analysis and GAP analysis are popular strategic planning tools, but they focus on different perspectives of business evaluation. SWOT analysis vs. GAP analysis often comes up when deciding whether to assess internal performance or external positioning. While SWOT… Read More
When planning a project it is important to learn about the internal and external factors that can affect the project. There are some excellent strategic planning methods that you can use analyze all these factors. SWOT analysis and PEST analysis… Read More