Software engineer turned tech evangelist with 15+ years of experience in technical content creation, developer education, and technology marketing. At Creately, he contributes technical articles, in-depth guides, and product education content that help professionals understand and adopt modern digital tools and workflows. His work spans a wide range of technical topics including software development, productivity platforms, visual collaboration, emerging technologies, and digital workflows. Drawing on his engineering background, he focuses on breaking down complex technical concepts into clear, practical insights that developers, teams, and organizations can apply in real-world scenarios.
Modern IT environments rarely stay simple for long. As systems grow, tools multiply, and teams scale, it becomes harder to see how everything fits together, or what might break when changes are made. This guide helps you cut through that complexity. You’ll learn what IT infrastructure maps are, how they bring clarity to connected systems, how to create your own step by step, and the best tool to do it. Read More
When planning a project, it is important to learn about the internal and external environmental factors that can affect the project. There are some excellent strategic planning methods that you can use to analyze all these factors. PEST analysis and SWOT analysis are two of the most frequently used planning methods. Below is a brief introduction to both methods, how to use Creately’s AI templates to perform each analysis and a comparison of the two. Read More
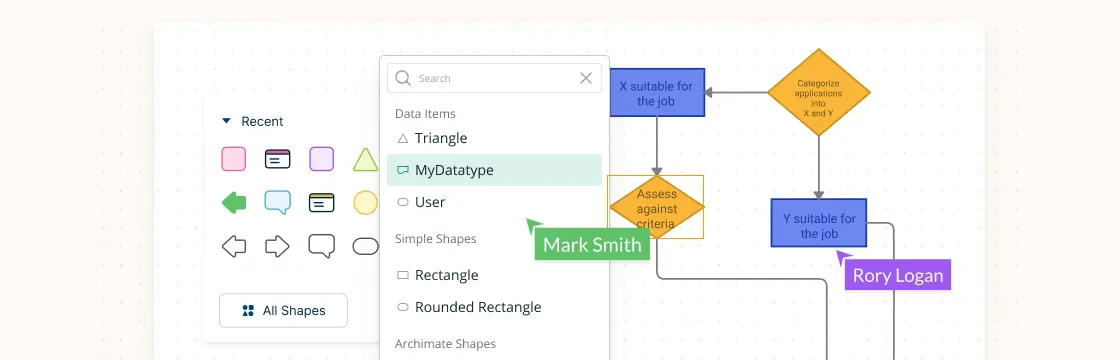
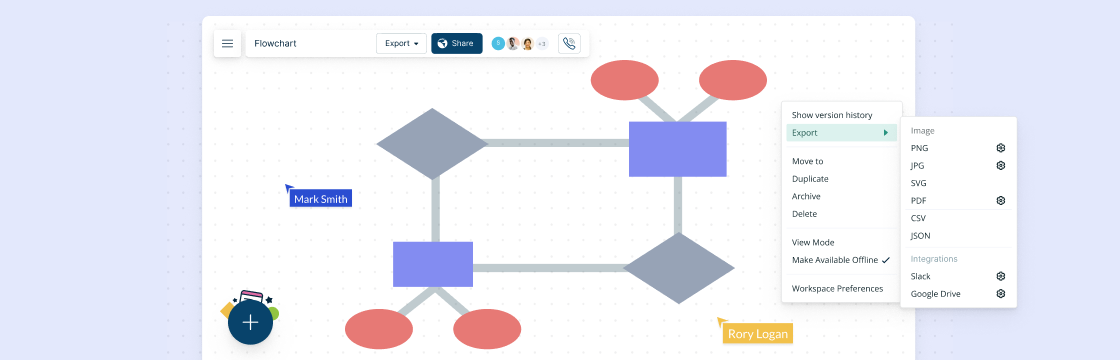
Flowcharting is an effective way to visualize processes, helping you better understand, communicate, and improve the steps involved. Whether you’re mapping out business processes or personal workflows, flowchart ideas can help streamline tasks and enhance clarity. Below, we’ve compiled 10 flowchart ideas and editable flowchart templates you can test out using Creately’s intuitive diagramming software. Read More
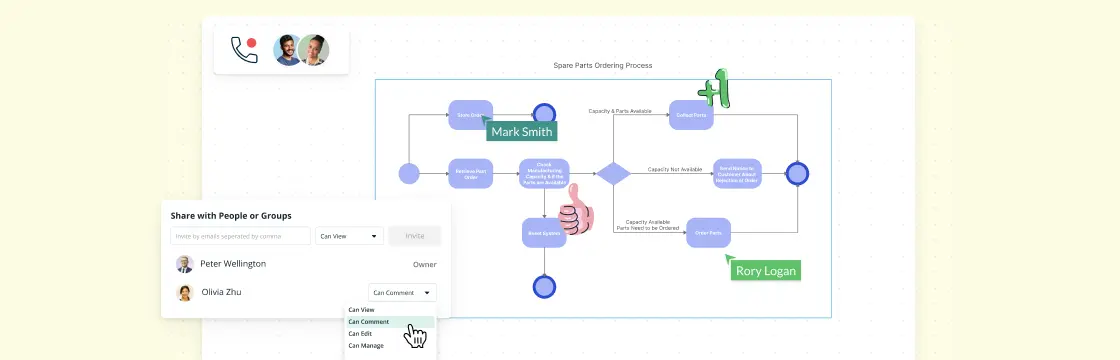
Business Process Modeling (BPM) is a critical practice for organizations striving to improve efficiency, streamline operations, and ensure continuous improvement across all departments. By providing a visual representation of business processes, BPM helps organizations understand how work flows, identify bottlenecks, and optimize processes for better performance. Read More
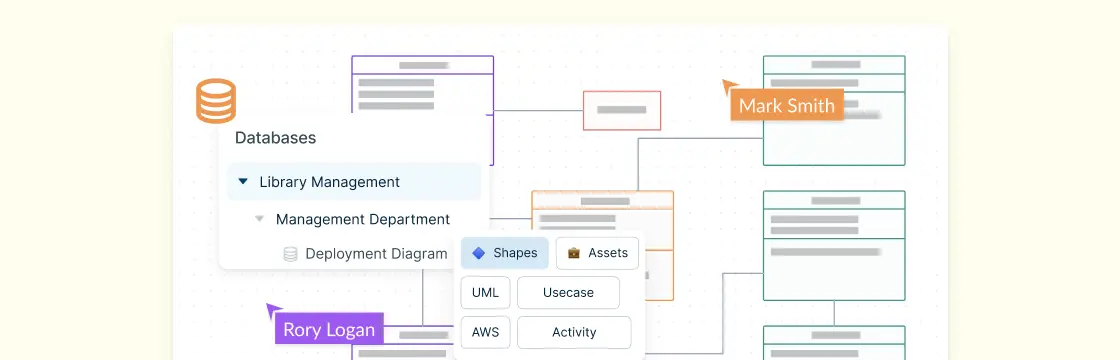
So you want to learn Entity Relationship diagrams? This ER diagram tutorial will cover what is an ER diagram, its usage, history, components of ER diagram, and how to use Creately to draw them. We’ve also added some templates for you to get started quickly. Read More
In this guide, we’ll explore the Project Initiation Document (PID) in detail, explaining its importance and benefits. Whether you’re an experienced project manager or new to the field, this article will give you valuable insights and a free PID template to start your projects with confidence and precision. Read More
In this article, we will explore the importance of a cost management plan in project management. We will delve into the definition, components, and benefits of a well-executed cost management plan. By understanding the significance of effective cost management, you will gain valuable insights to optimize project budgets, control expenses, and enhance overall project success. Read More
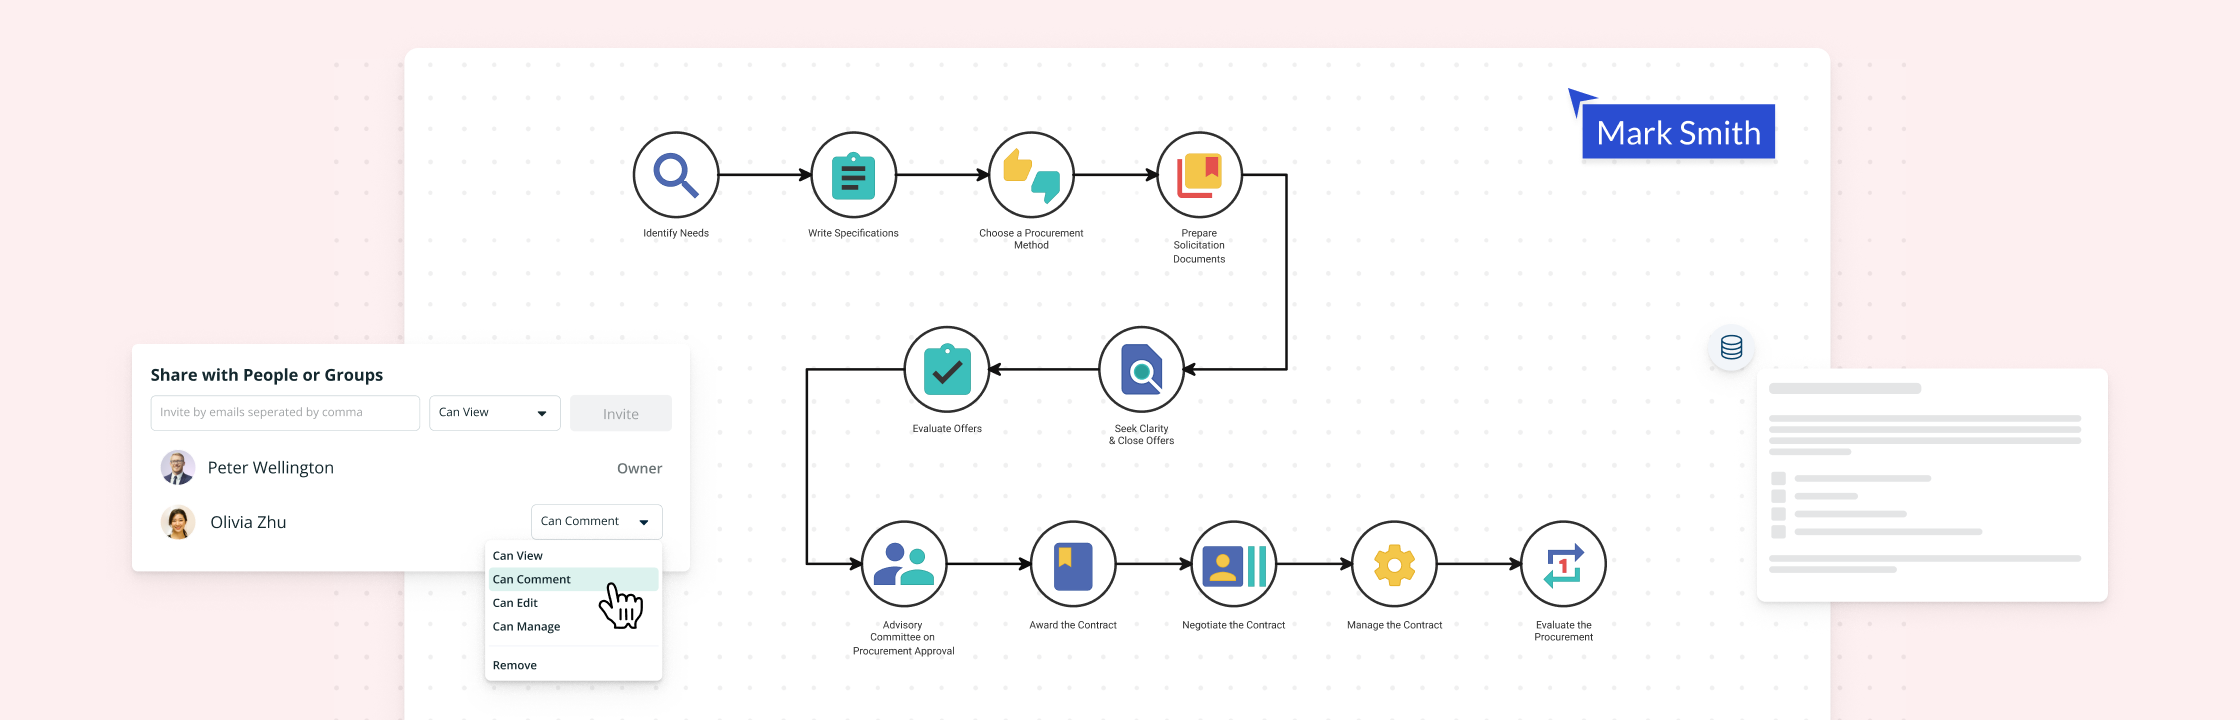
Procurement management is crucial for project success. Whether you’re an experienced pro or just starting out in project management, having a solid procurement plan is key. A well-crafted procurement plan helps you control costs, minimize risks, and maintain a good relationship with your suppliers. Plus, it establishes clear communication channels and effectively allocates your project resources. Read More
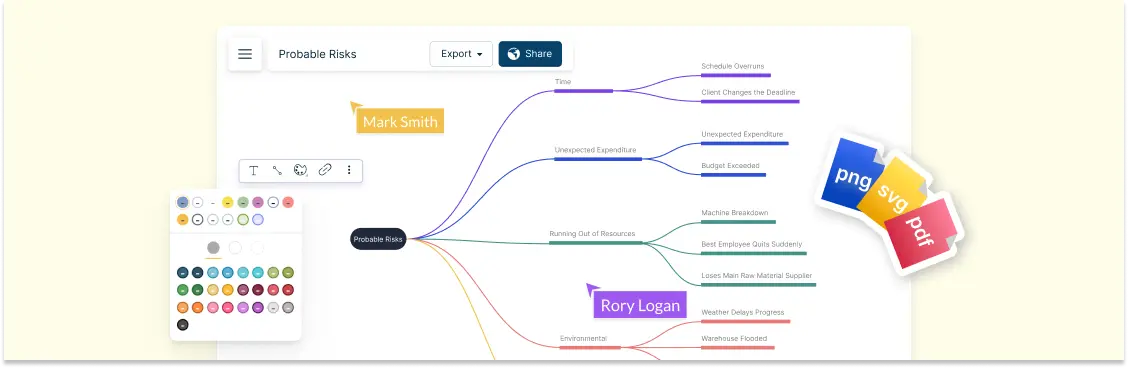
Risk management plays a crucial role in software engineering (SE) by identifying, assessing, and mitigating potential risks throughout the software development lifecycle. Effective risk management in SE helps organizations proactively address uncertainties and minimize negative impacts on project timelines, budgets, and overall quality. This article provides an overview of risk management in SE, explores different types of risks, discusses the risk management process, introduces relevant tools, and presents case studies showcasing its benefits. Read More
Efficient resource planning plays a crucial role in achieving successful project management. The ability to allocate and manage resources effectively ensures that projects stay on track, meet deadlines, and achieve desired outcomes. Read More
The ability to effectively execute projects and manage change is critical to achieving successful outcomes. This comprehensive guide is designed to equip you with essential yet customizable templates and guidelines necessary for project execution and change management planning. Read More
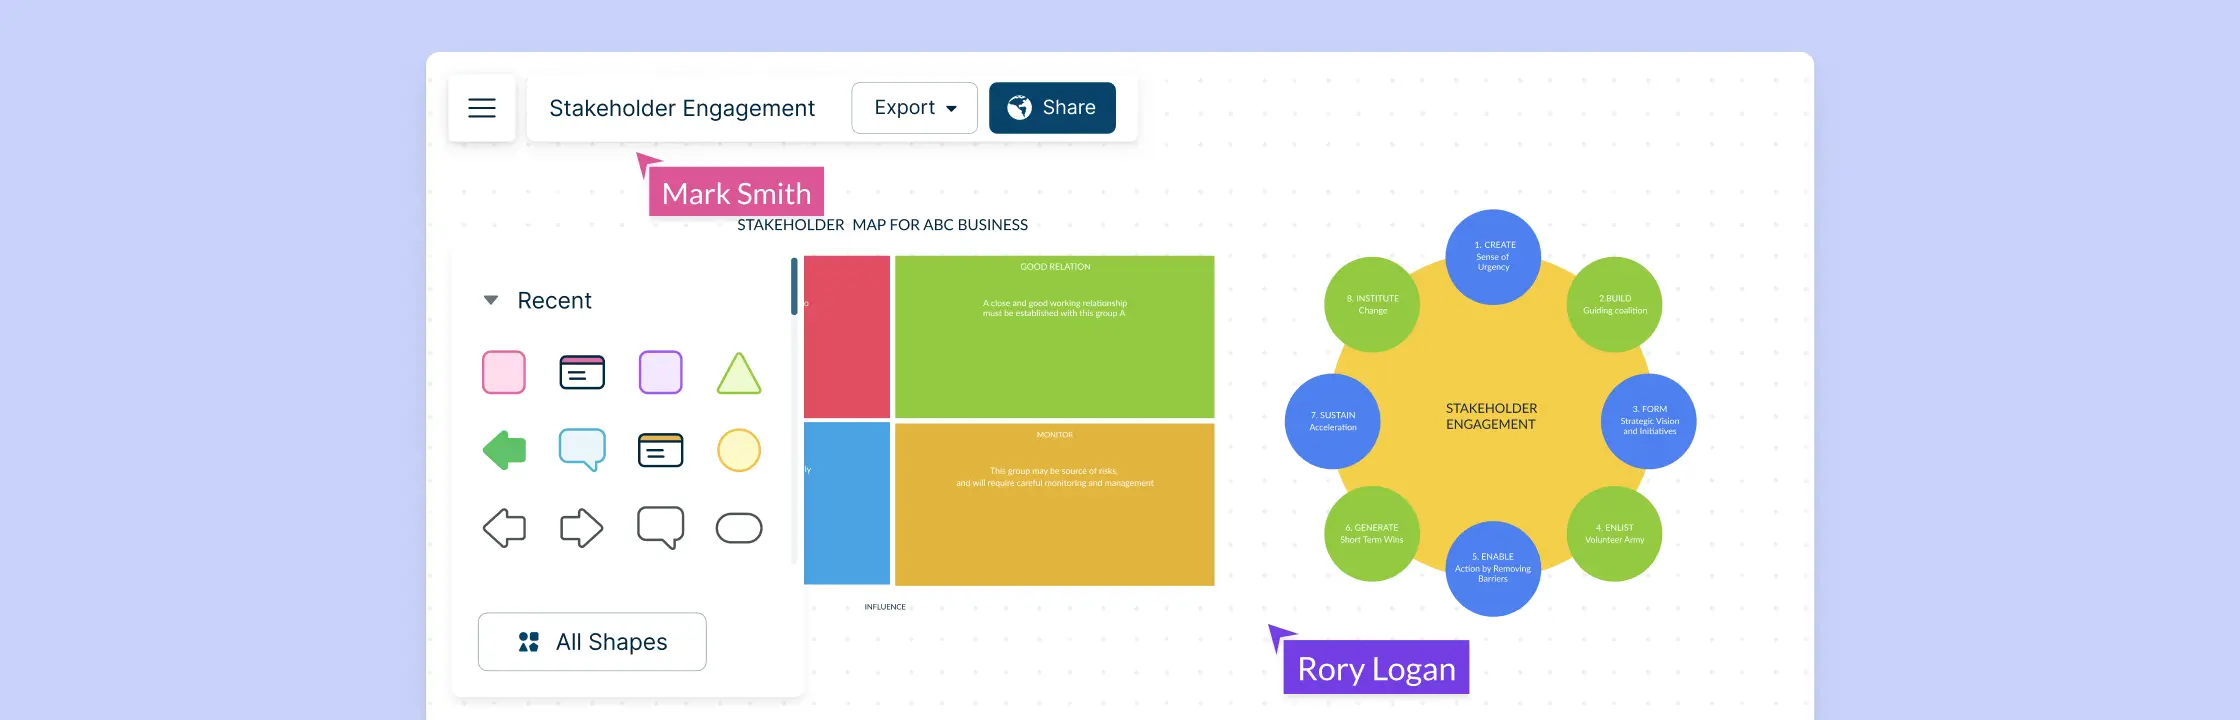
Stakeholder management is a crucial aspect of project management that involves identifying, analyzing, and engaging with individuals or groups who have an interest or influence in the project’s outcomes. A well-structured stakeholder management plan is essential for ensuring project success and minimizing risks. Read More
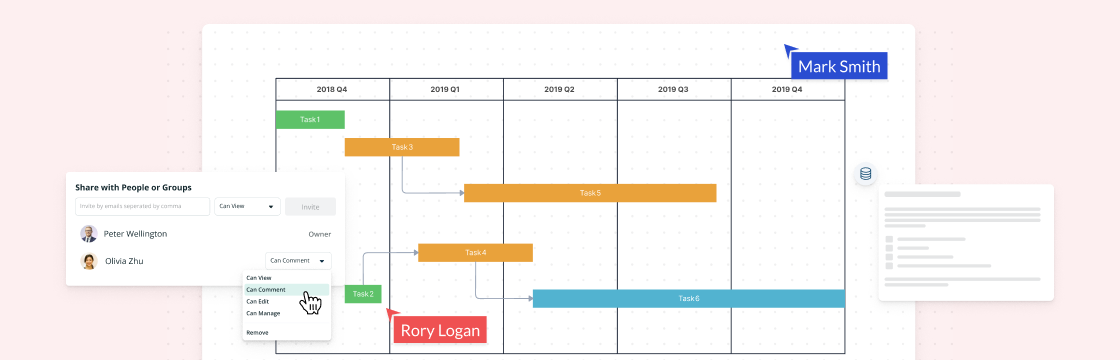
Project planning and scheduling are essential components of successful project management. They provide a roadmap for project execution, ensuring that tasks are completed on time, within budget, and in line with project objectives. However, creating project plans and schedules from scratch can be time-consuming and prone to errors. That’s where you can use editable project plan templates and project schedule management plan templates to quickly and easily create project plans and schedules that are error-free. Read More
Successful project delivery requires effective risk and quality management. To achieve this, project managers can utilize specialized tools such as Risk Management Plan Templates and Quality Management Plan Templates. These workspaces provide a structured approach to identify, assess, and mitigate potential risks, as well as establish and maintain quality objectives throughout the project lifecycle. Read More
Imagine having a website that portrays your brand perfectly, drives traffic and turns the audience into loyal customers. Your company website is a key gateway to reach potential customers. How do you build a perfect website? The answer lies in understanding the phases of website designing and implementing the best practices that make your online presence truly exceptional. Read More
Even though Business Process Modeling is a very effective way for business organizations to keep track of their inner workings, many beginner modelers tend to design them incorrectly and make mistakes, which decrease their potential. The following are certain tips and suggestions you should keep in mind when designing your very own Business Process Model. Read More
Wireframes function as a bridge between raw creative thoughts and the final product. Think of wire-frames as architectural blueprints for a building and you’ll understand why it is a critical tool in just about any development project. The fact is, constructing a decent, structurally sound building without using blueprints is inconceivable, and no sane real estate developer will partner with a construction outfit that does not use blueprints. Considering the vast number of wire-frame benefits, you should ignore them at your peril. Read More
What are Cross Functional Flowcharts? A basic flowchart shows how micro processes are sequentially linked together in an operation. They are basically one dimensional, just showing the processes without going into much detail about the attributes of the particular process. This is where cross functional flowcharts come in. By expanding the limitations of the conventional flowcharts to a multidimensional range, cross functional flowcharts can increase the depth of detail. This allows the reader to not only examine the processes, but also the attributes related to the specific processes, along with the categories they belong to. Read More
Creating a SWOT analysis is one of the fastest ways to bring clarity to complex decisions, but only if you know how to do it right. Many teams struggle with scattered ideas, messy documents, and unclear outcomes when trying to analyze strengths, weaknesses, opportunities, and threats. This guide is designed to show you how to create a SWOT analysis the right way, step by step, so that you can move from confusion to confident strategic thinking. This guide will walk you through exactly how to create a SWOT analysis that is clear, accurate, and actionable. Read More
What are cross functional flowcharts Flowcharts are widely popular and one of the most frequently diagram types. They are great for mapping the flow of steps, decisions that need to be made etc in a process. Read More
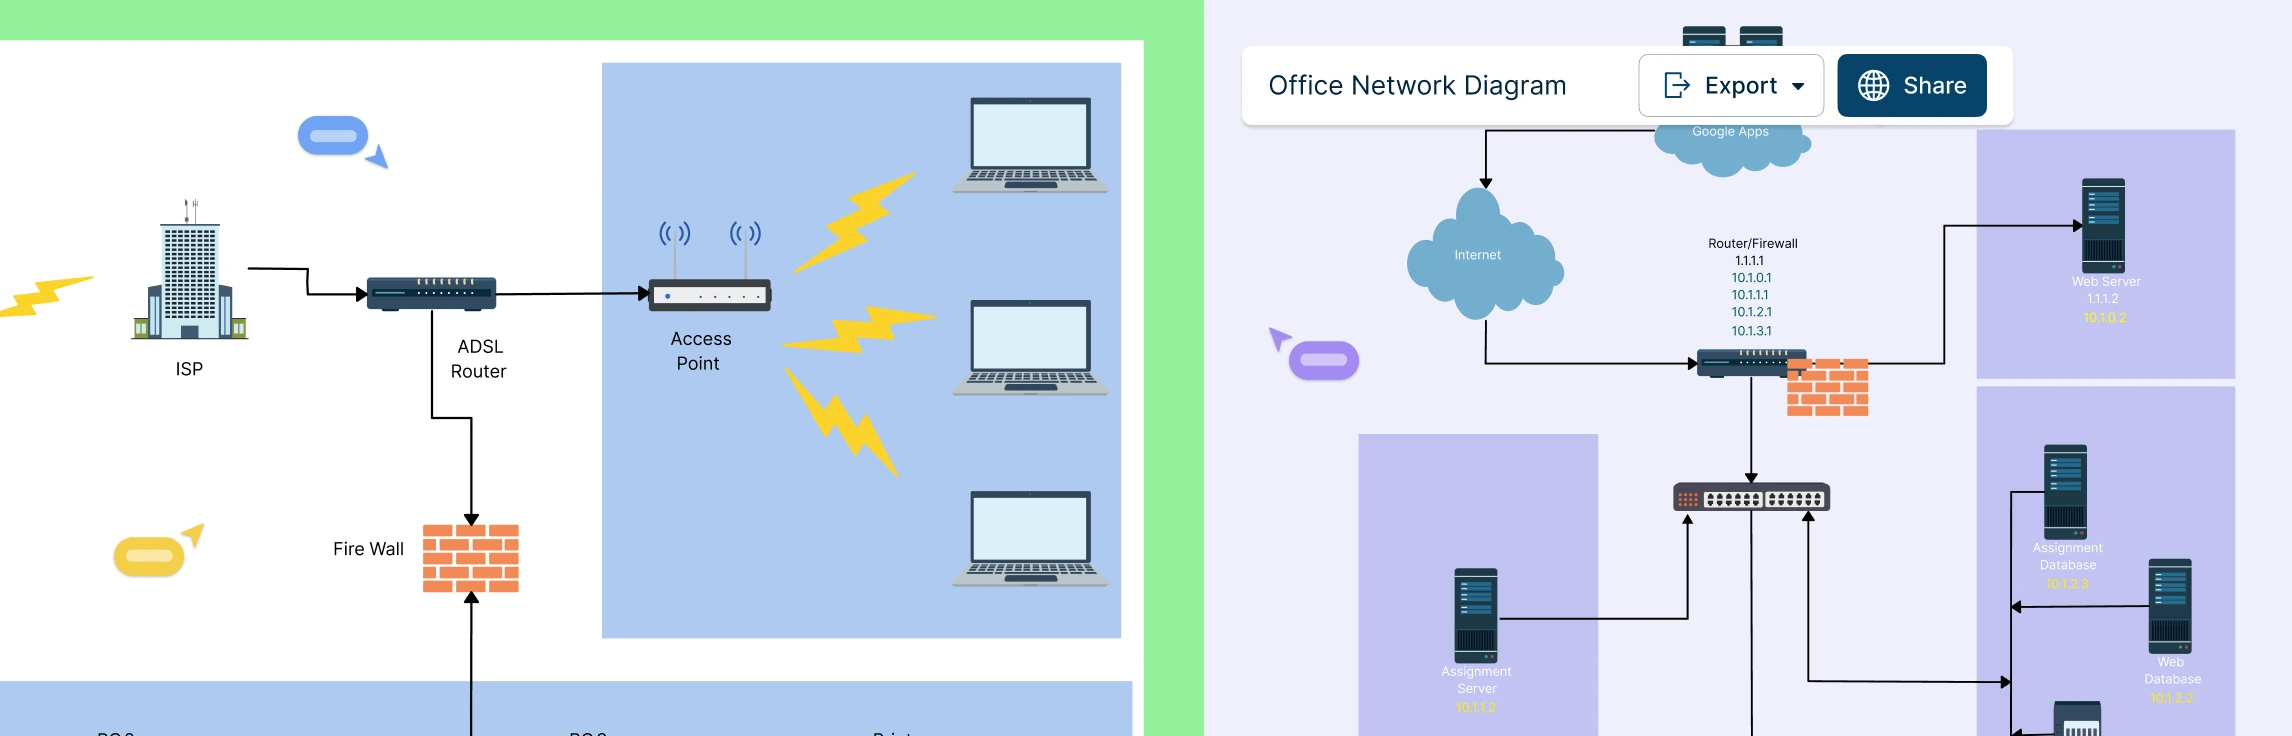
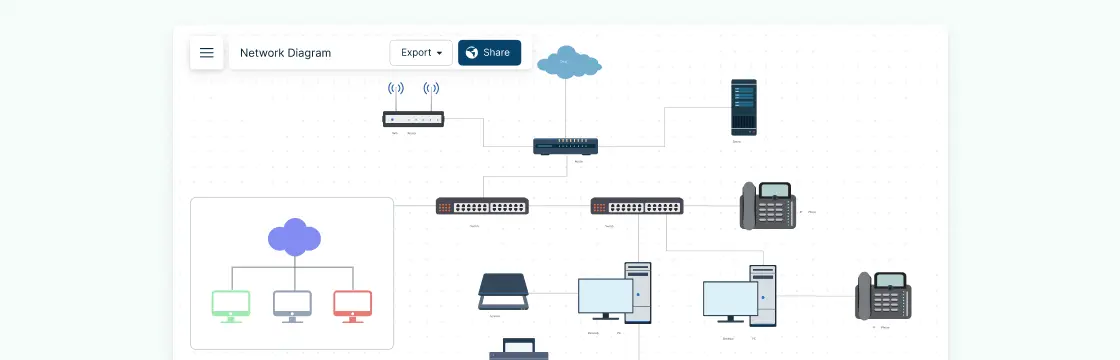
Creating network diagrams doesn’t have to be complicated. With the right network diagram examples, templates, and shapes, designing clear and effective network layouts becomes quick and easy. Whether you’re a network designer, administrator, or just looking to visualize a network, these examples will help you get started fast. Read More
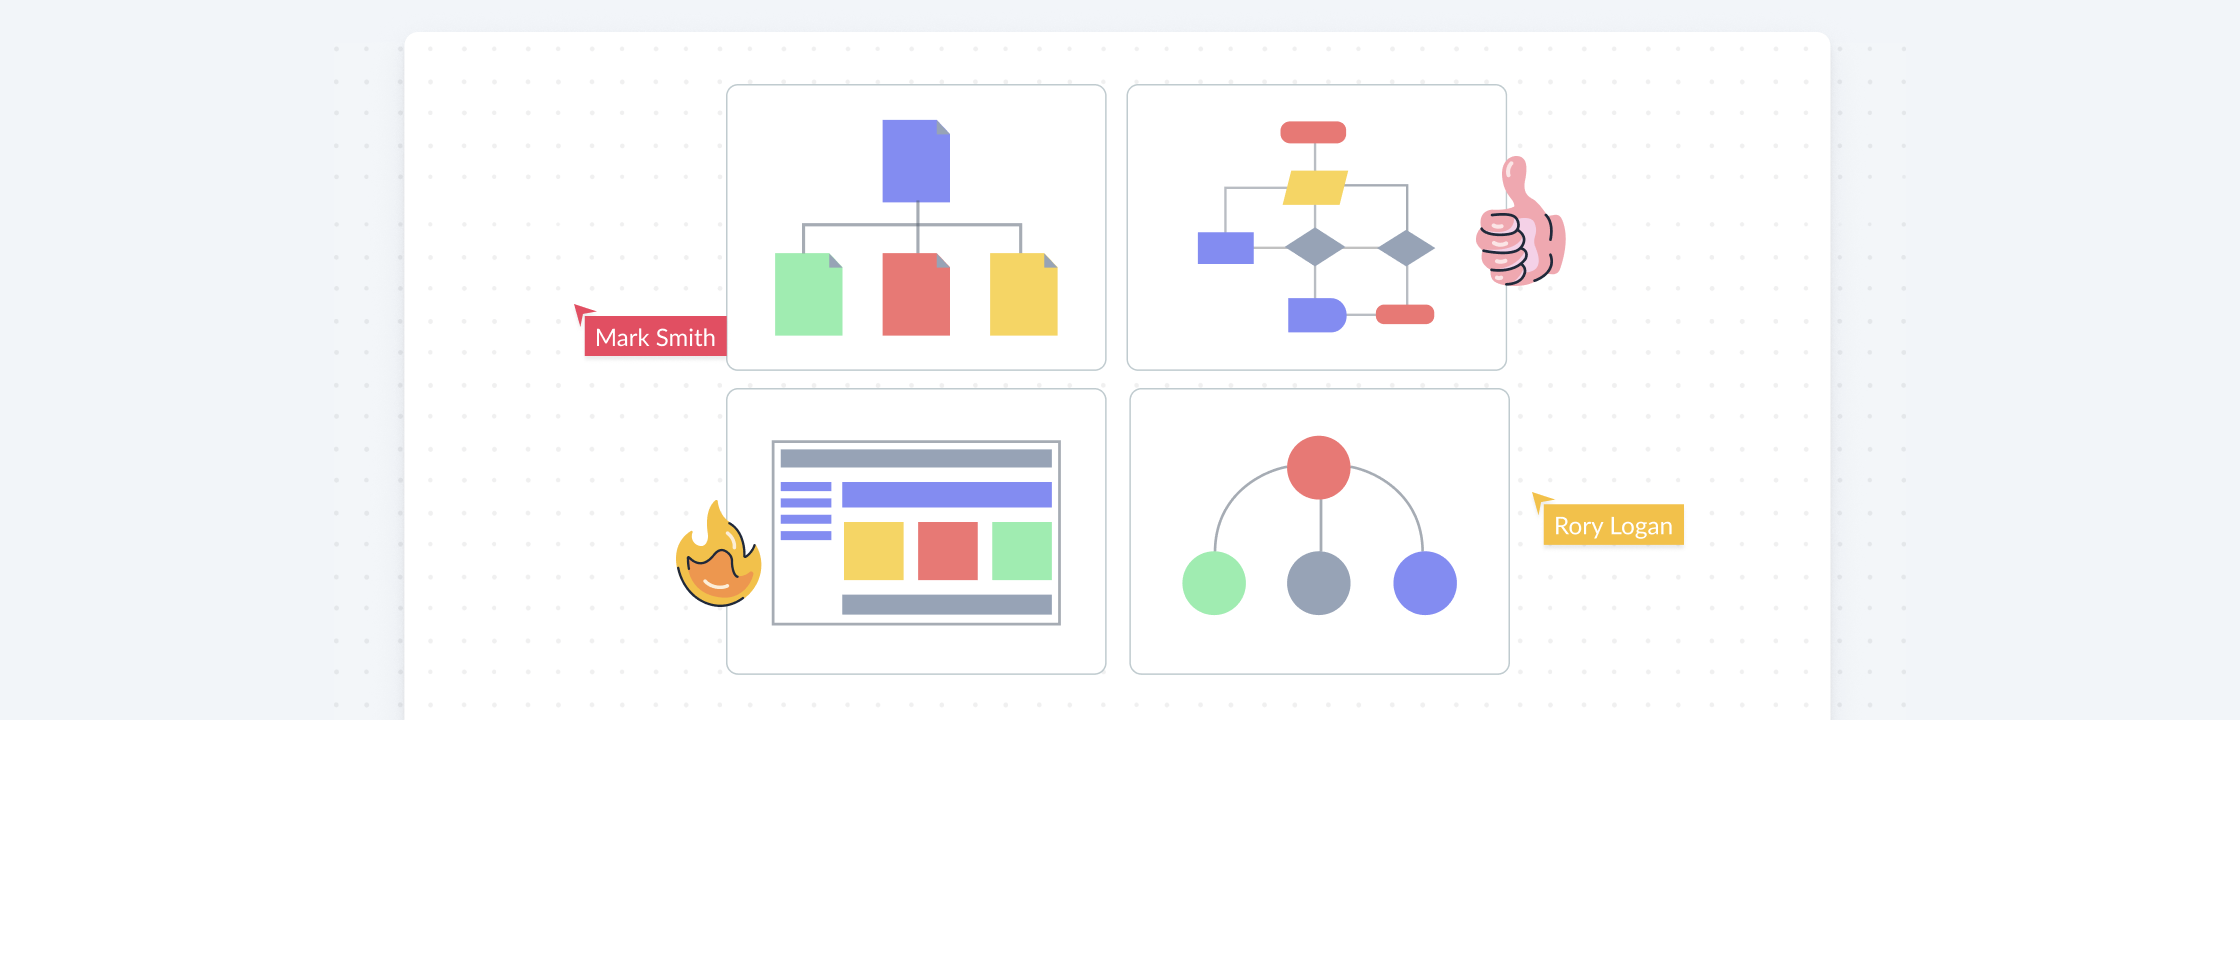
An organization chart is a graphical representation of relationships between an organization’s departments, functions, and people. It can also indicate the flow of data, responsibility, and reporting from bottom-up or top-down. Its usage across the globe is a testament to its effectiveness. Below are some rules for drawing organizational charts and org chart best practices to make your org chart more meaningful and useful. Read More
This is the third post in a series on organization structures. Here is a brief outline of what has been discussed so far: In the first post we discussed the simple, functional and the multidivisional organizational structures. The second post followed up with the Holding company structure, Matrix Structure & Team-based structures. Now with the final post in the series, let’s take a look at the Project-based and Network structures. Read More
Perhaps the most important resource of an organization is its people. So the role people play, how they interact through formal and informal processes and the relationships that they build are crucial to the success of any strategy. If your manager was asked to describe your organization, he would probably respond by drawing an org chart, to map out its structure. Read More
So you want to learn flowcharts? This flowchart tutorial will guide you through everything you need to know. You’ll discover what a flowchart is, the different flowchart symbols, how to create flowcharts, and the best practices to follow. We’ve also included answers to common questions about flowcharts. Best of all, we’ll provide you with flowchart software to create them faster and better. Read More
Class diagrams are the main building blocks of object-oriented modeling so it is important that you understand the various class diagram relationships and how they affect your solution. We have listed them below with examples. Read More
What is a UML Use Case Diagram A UML (Unified Modeling Language) use case diagram is a visual representation of the interactions between actors (users or external systems) and a system under consideration. It depicts the functionality or behavior of a system from the user’s perspective. Use case diagrams capture the functional requirements of a system and help to identify how different actors interact with the system to achieve specific goals or tasks. Read More
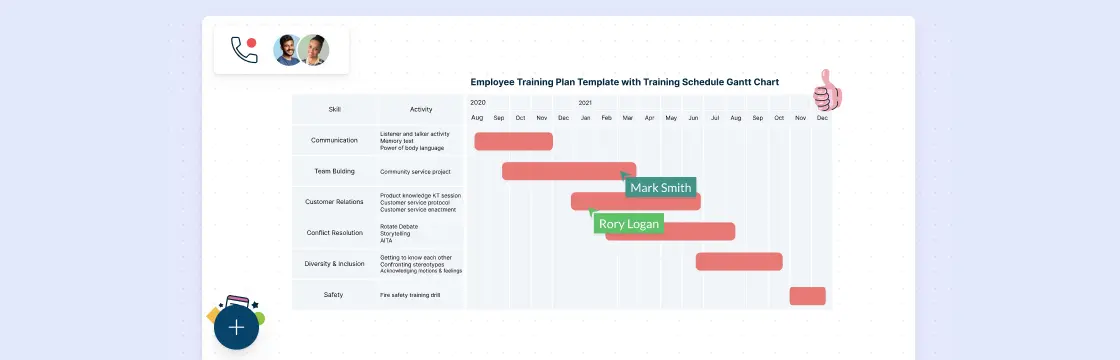
Flowcharts and Gantt charts are both effective tools to plan projects. However, when it comes to project execution, both have different uses and applications. For a complex plan with a longer duration, a Gantt chart is better, and for short term and smaller projects, a flow chart can do the trick on its own. In some cases, Gantt charts and flowcharts are used in combination. Both types of charts can be easily made using Creately’s online flow charting tools and Gantt tools. Read More
HR managers in companies have been using organizational chart software for decades to fulfil a very basic but significant function. These managers have used org charts to form the modus operandi of a company, where questions of “Who is Who?” and “Who does What?” are answered. Organizational behavioral experts are aware of the issues that arise when lines are vague when it comes to job roles and responsibilities. Org charts need to be properly used to define the function and role of every single individual in a company so that there is room for accountability. Read More
Work breakdown structures (WBS) are frequently used by project teams to break the project into smaller, easily identifiable components. The WBS structures used in projects follow strict rules like 100% rule and the mutually exclusive rule, but in general, they can be used to break down almost any complex task. However, coming up with a WBS template from scratch can be a tedious task, which is why we have introduced work breakdown structure templates to speed up the process. All of the templates mentioned below can be reused by clicking the Use as Template button. Read More


![What is a Project Initiation Document (PID)? [with Free Template]](/static/assets/guides/project-initiation-document-explained/hero.webp)


![Organizing for Success [3] : Map out your Organization Structure](/static/assets/guides/organizing-for-success/Organizational-Chart-Best-Practices-for-Meaningful-Org-Charts-header.webp)