Flowcharts and Gantt charts are both effective tools to plan projects. However, when it comes to project execution, both have different uses and applications. For a complex plan with a longer duration, a Gantt chart is better, and for short term and smaller projects, a flow chart can do the trick on its own. In some cases, Gantt charts and flowcharts are used in combination. Both types of charts can be easily made using Creately’s online flow charting tools and Gantt tools.
Using Flowcharts for Project Planning
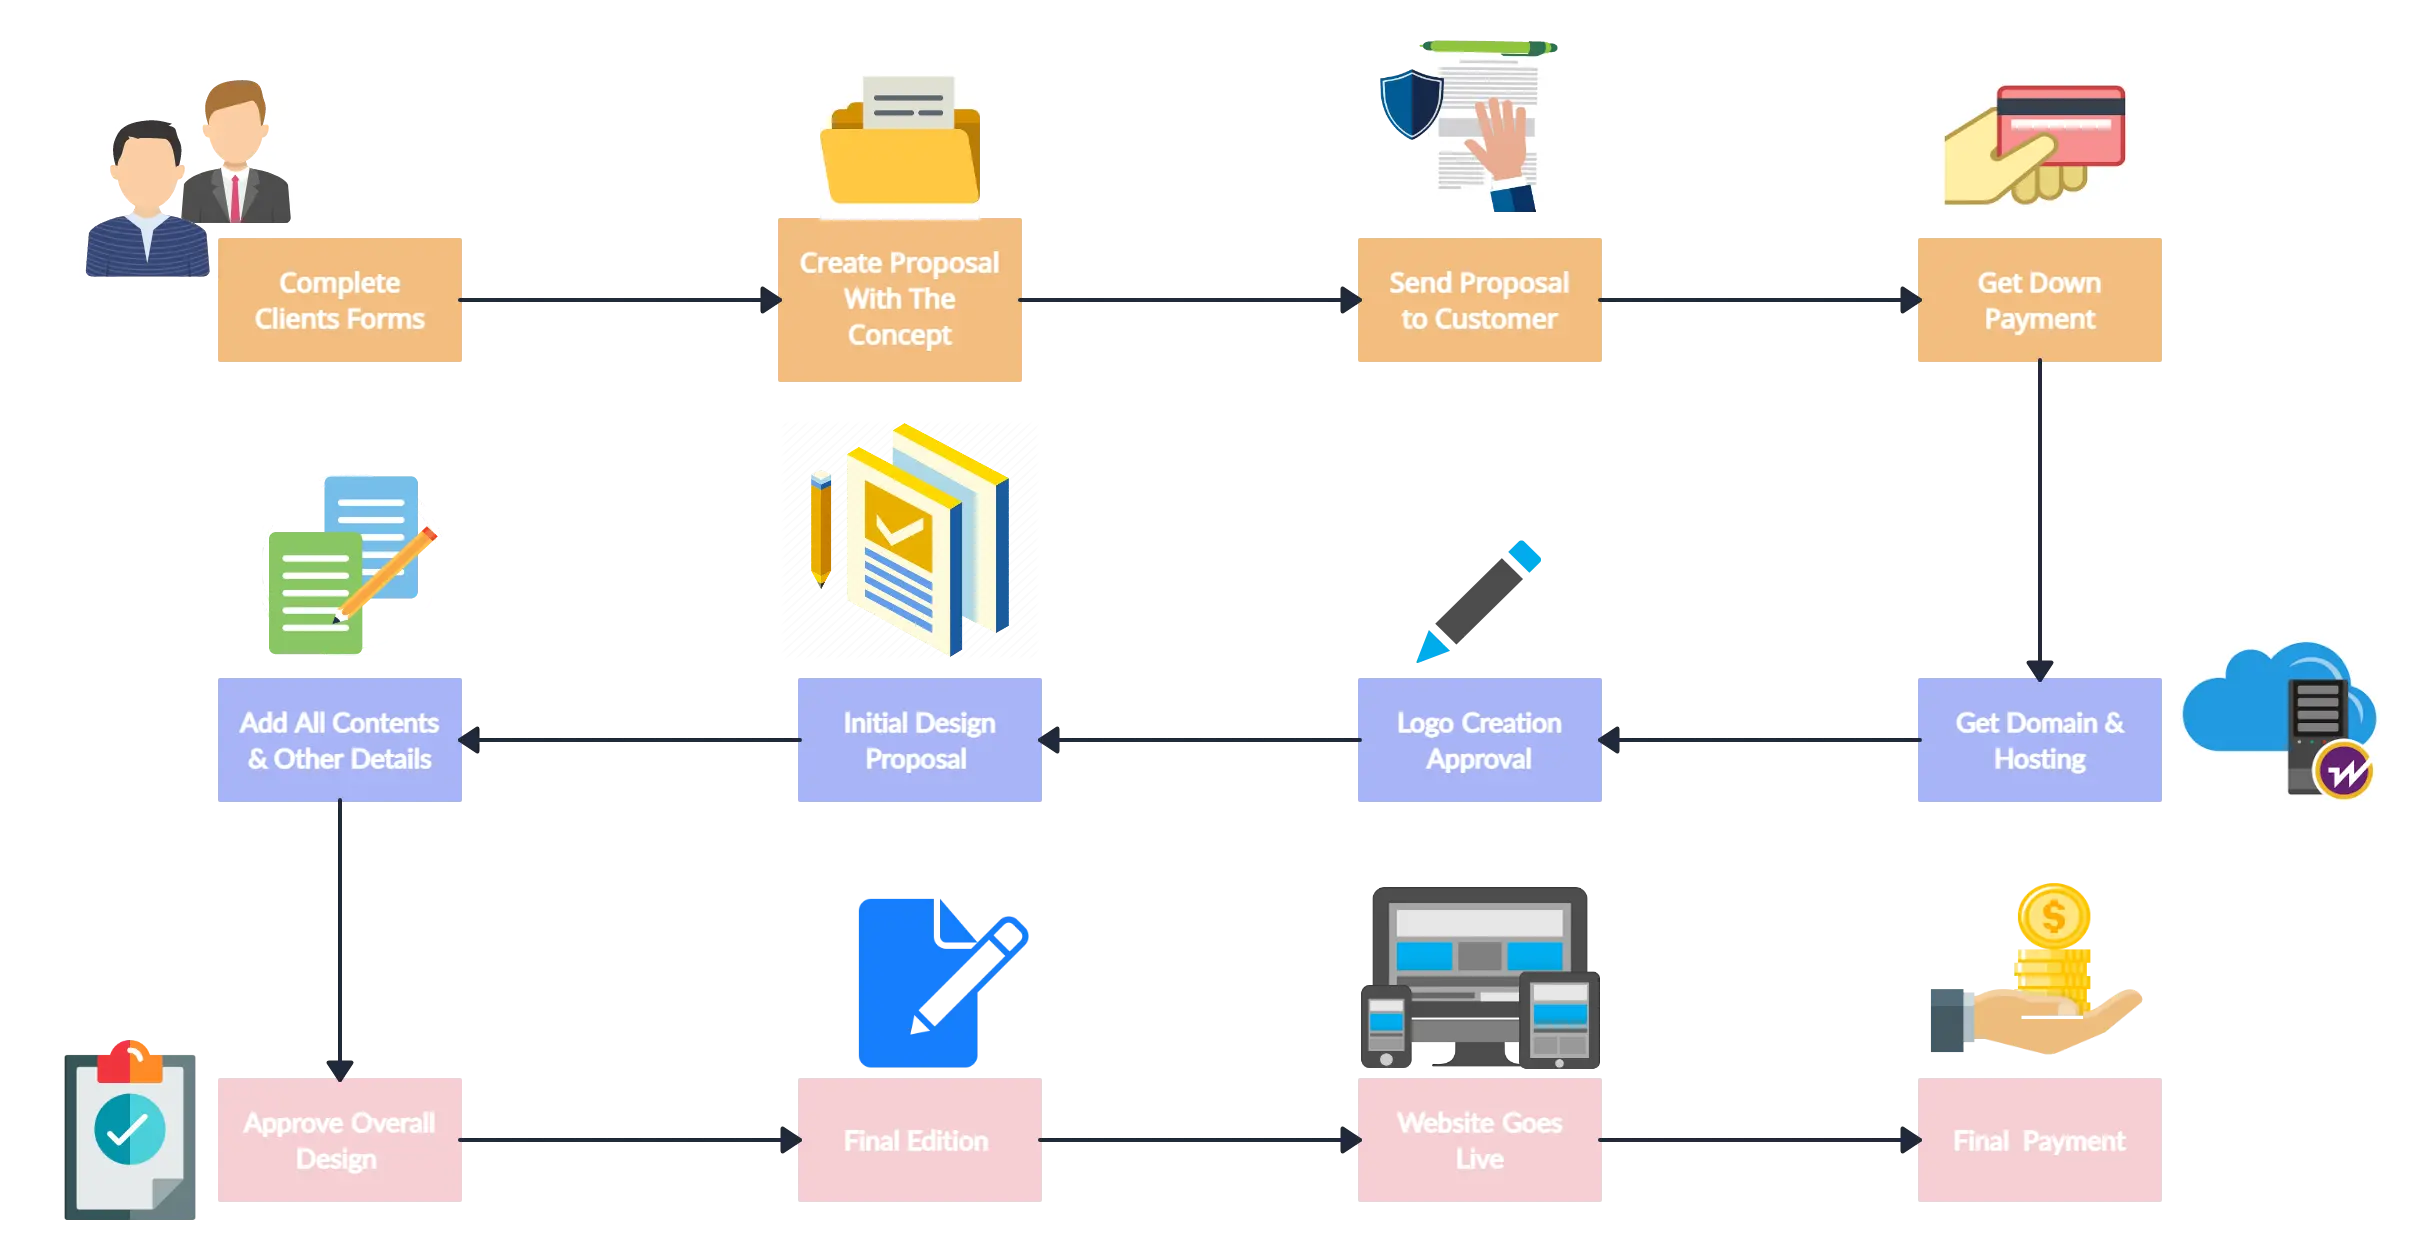
Flowcharts can be used to display a stage by stage progression. They effectively show a sequence of events, with the completion of one stage leading to the beginning of another. The only downside of using a flowchart for project planning is that you cannot add a time interval for each stage. Flowcharts of a project plan must show:
- A clear beginning
- Clearly labeled stages represented by rectangular boxes
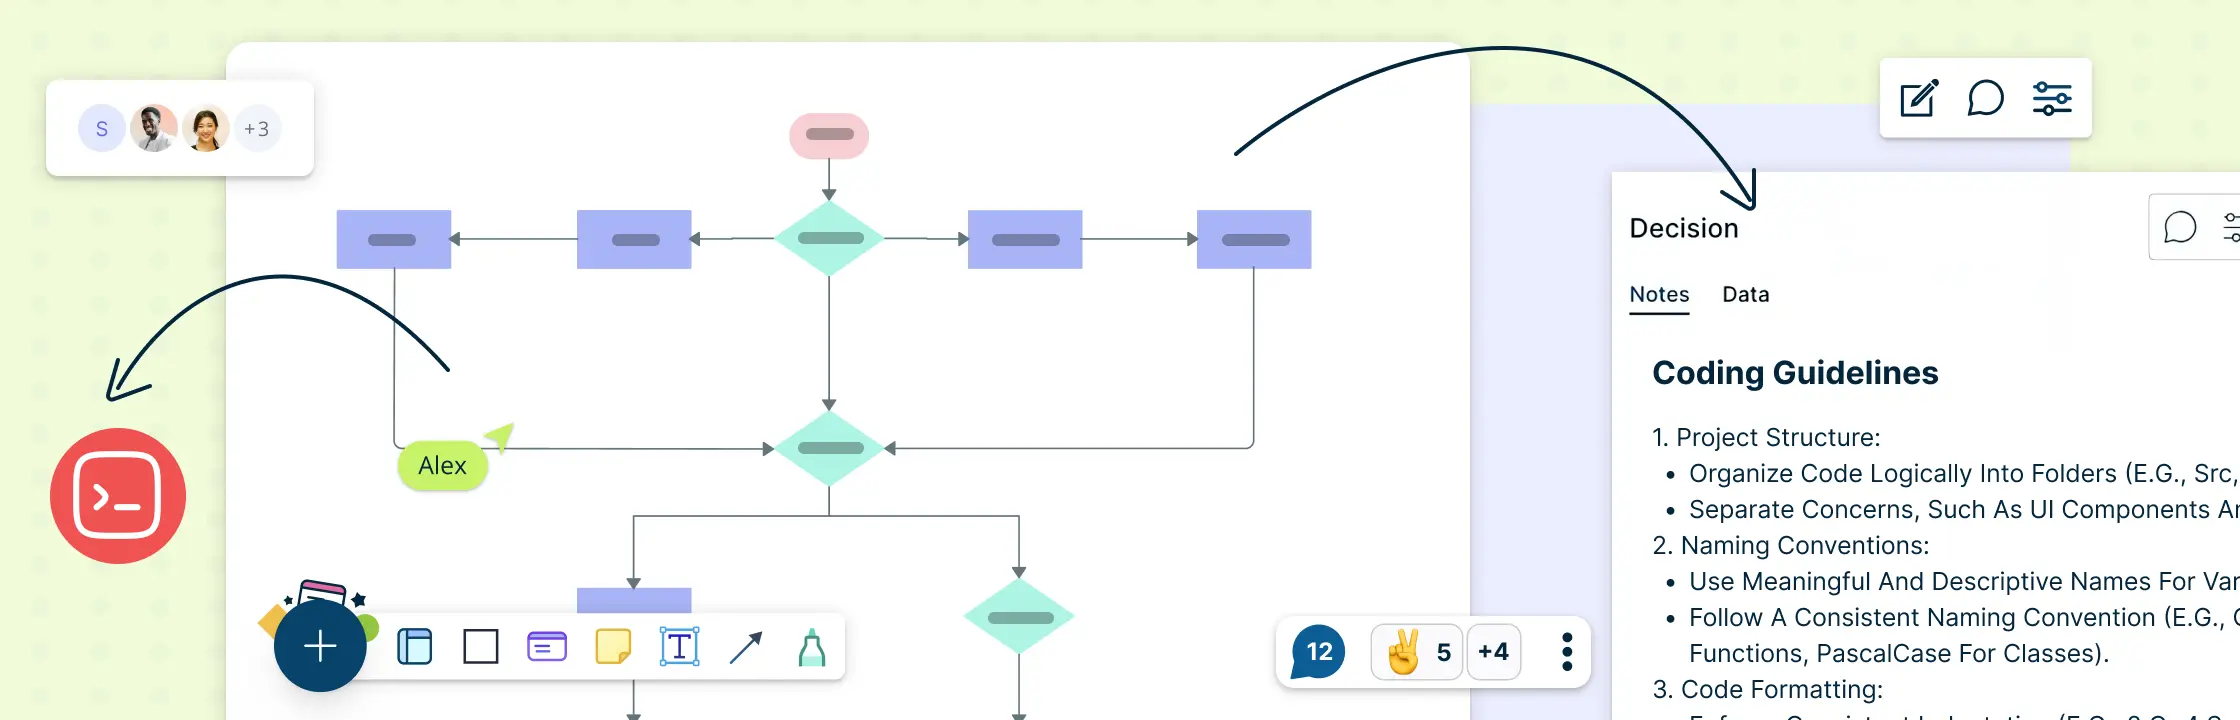
- Diamond shaped boxes for decisions/quality checks
- A clearly defined end
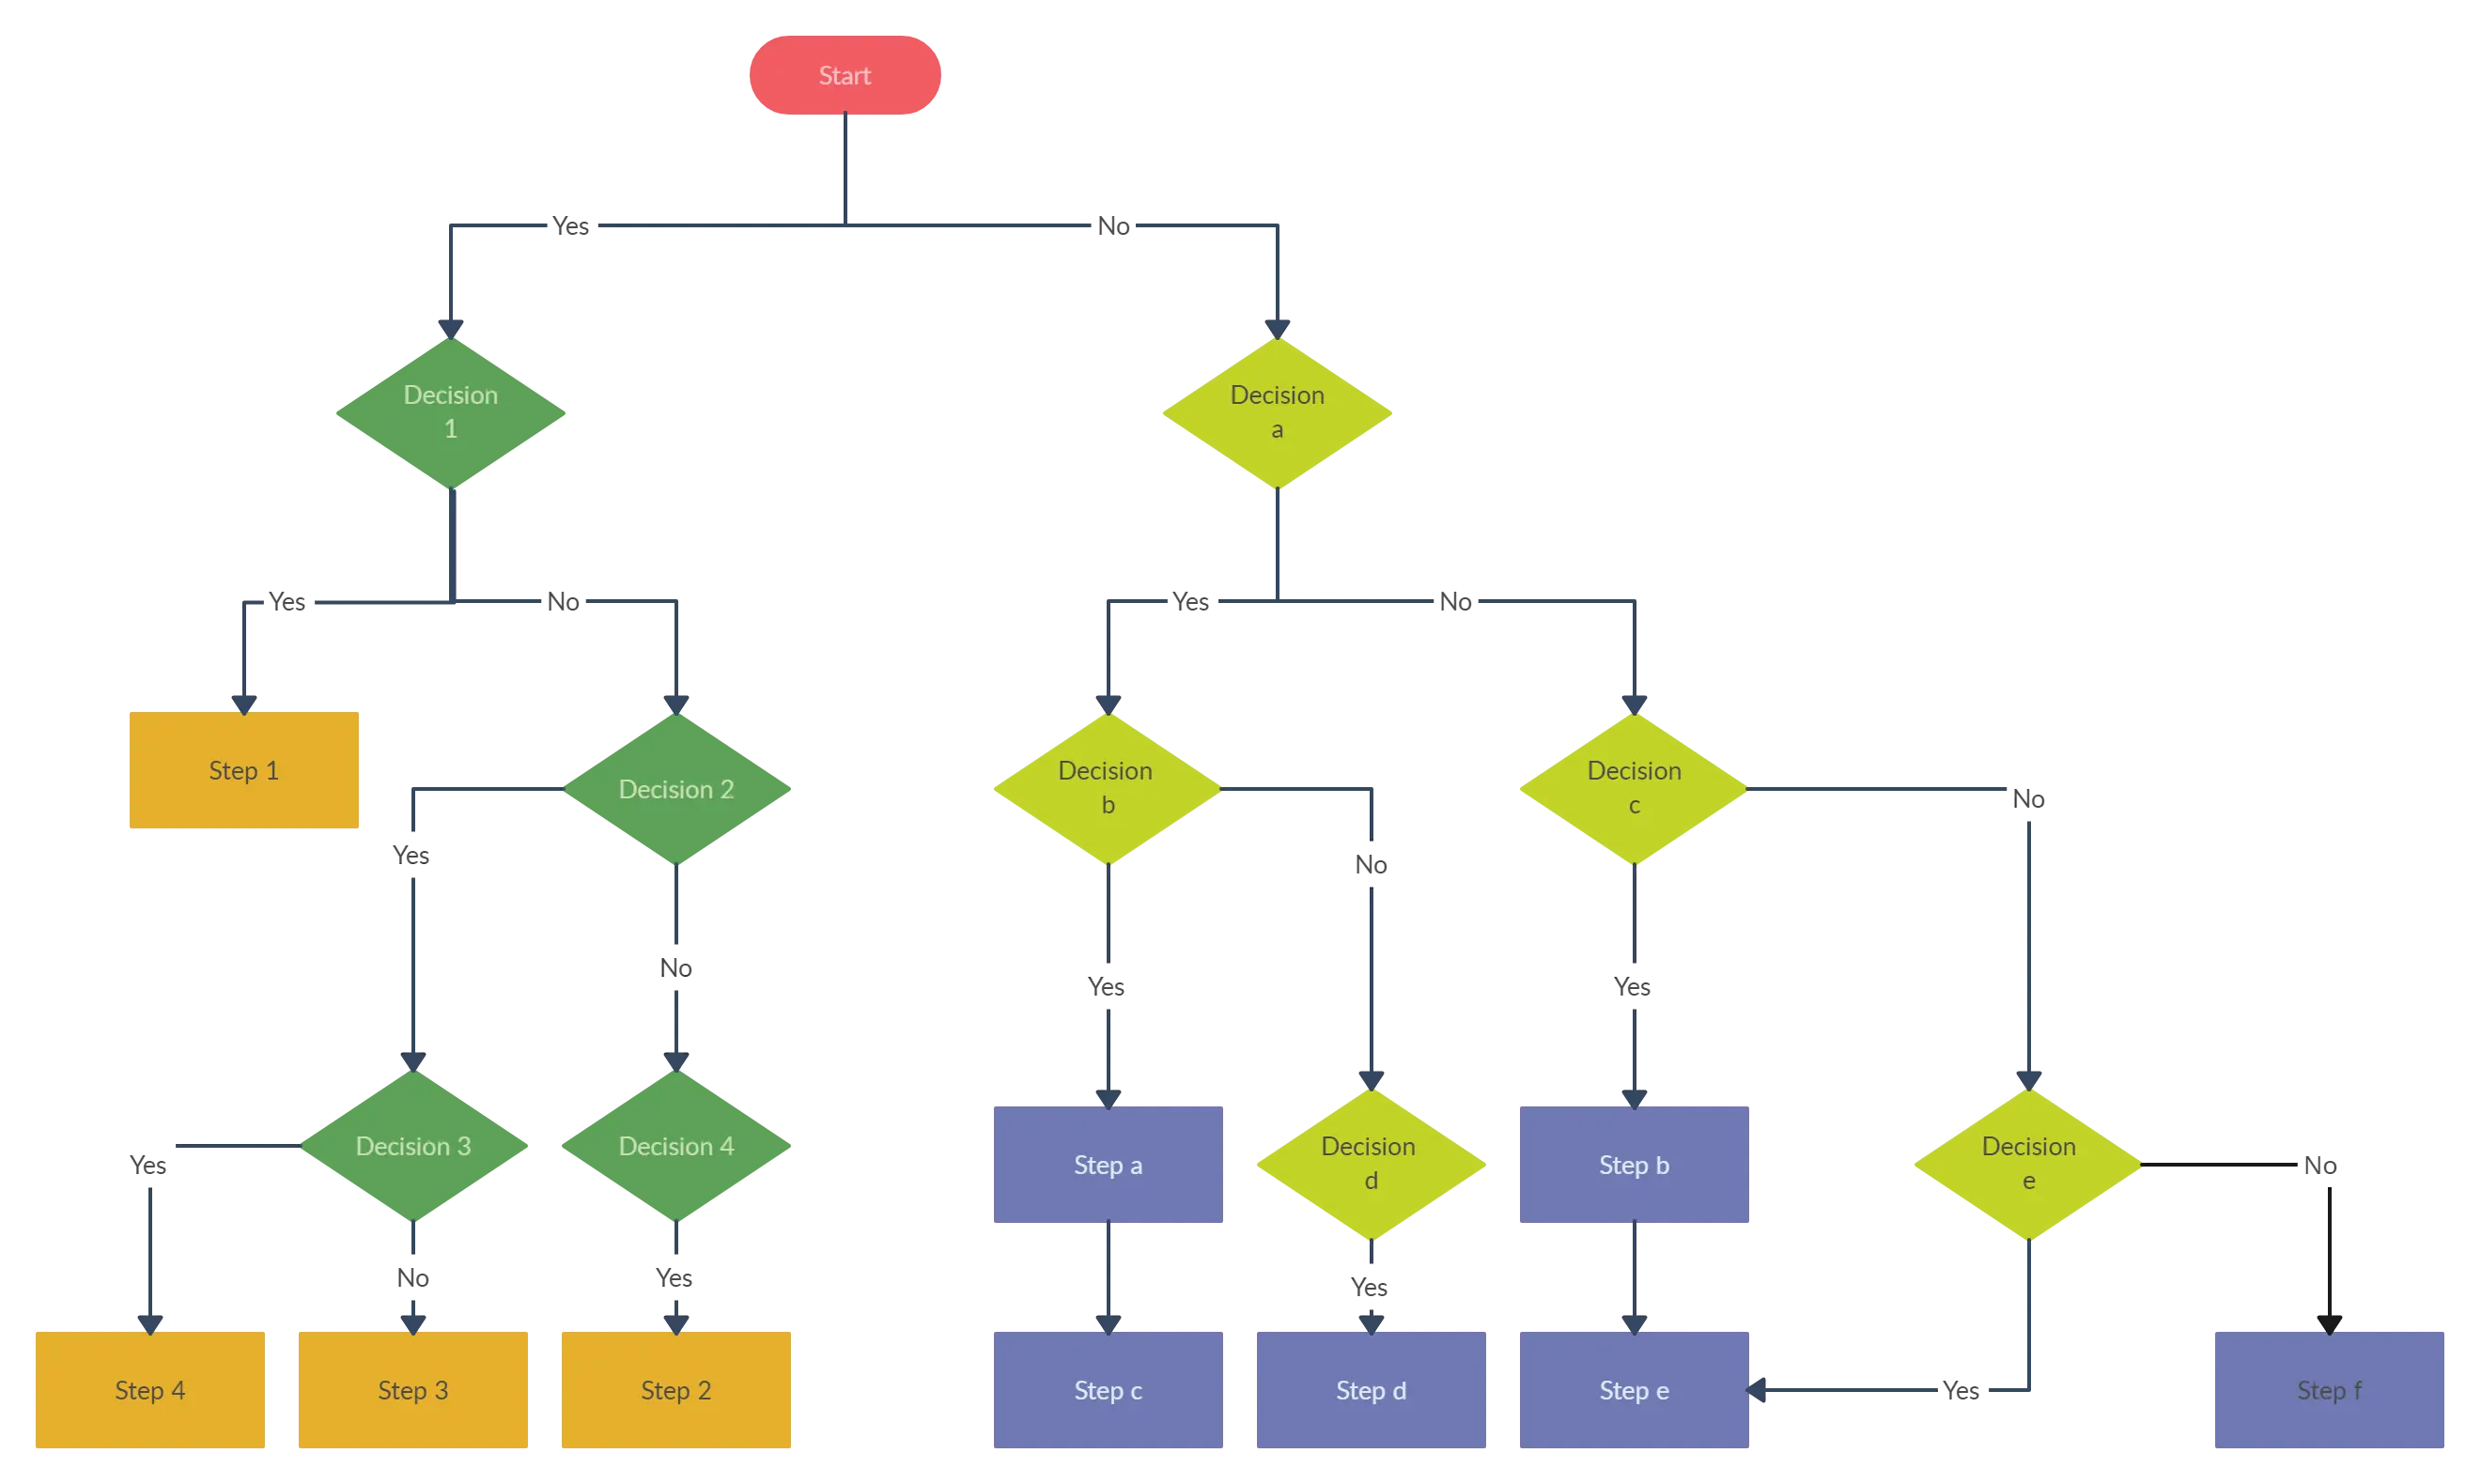
The arrows show the direction of flow. In case of a decision, the yes and no arrows must clearly indicate how to tackle different possible outcomes. Using Creatley’s flowchart designing tool, a simple flowchart for a small project can easily be made.
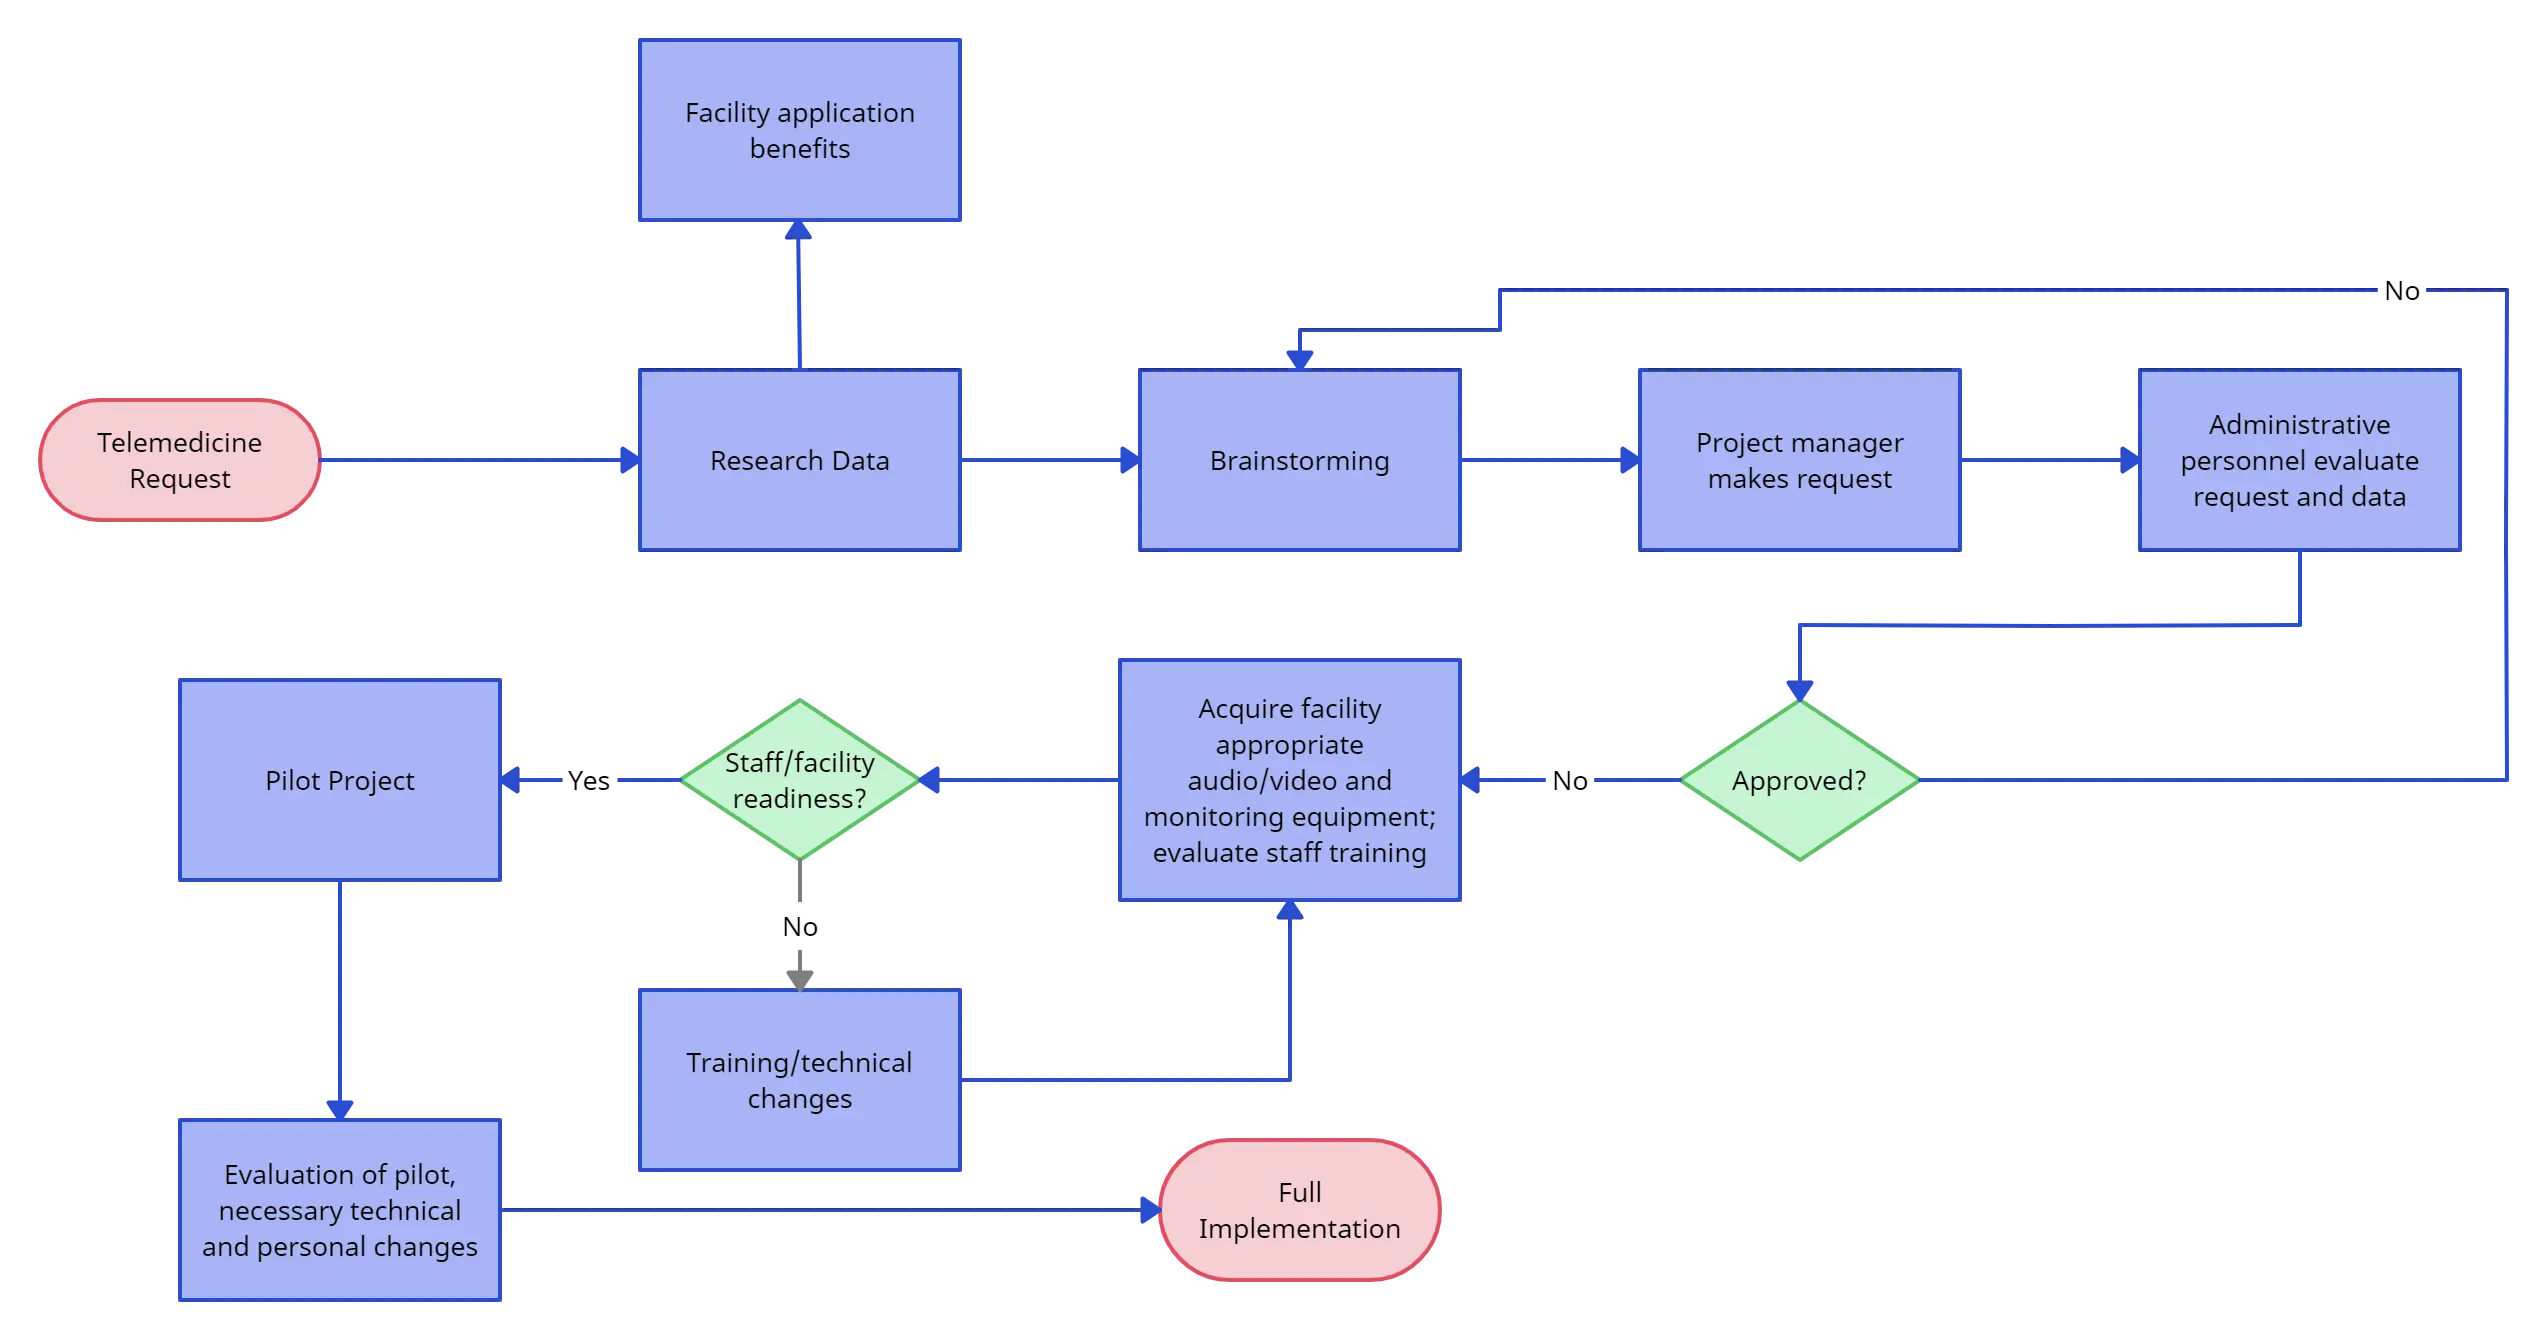
As can be seen from the diagram, a flowchart gives a nice visual representation of different stages of the project but misses out on one of the most important elements of project planning, i.e. time. For a project to be planned and managed efficiently, it has to be timed and each stage has to be performed within a deadline.
When working on smaller projects, ones that can be completed within a day or two, a flowchart is enough. However, when working on larger projects, it is better to outline processes using a flowchart before using a Gantt chart to get into details.
Using Gantt Charts for Project Planning
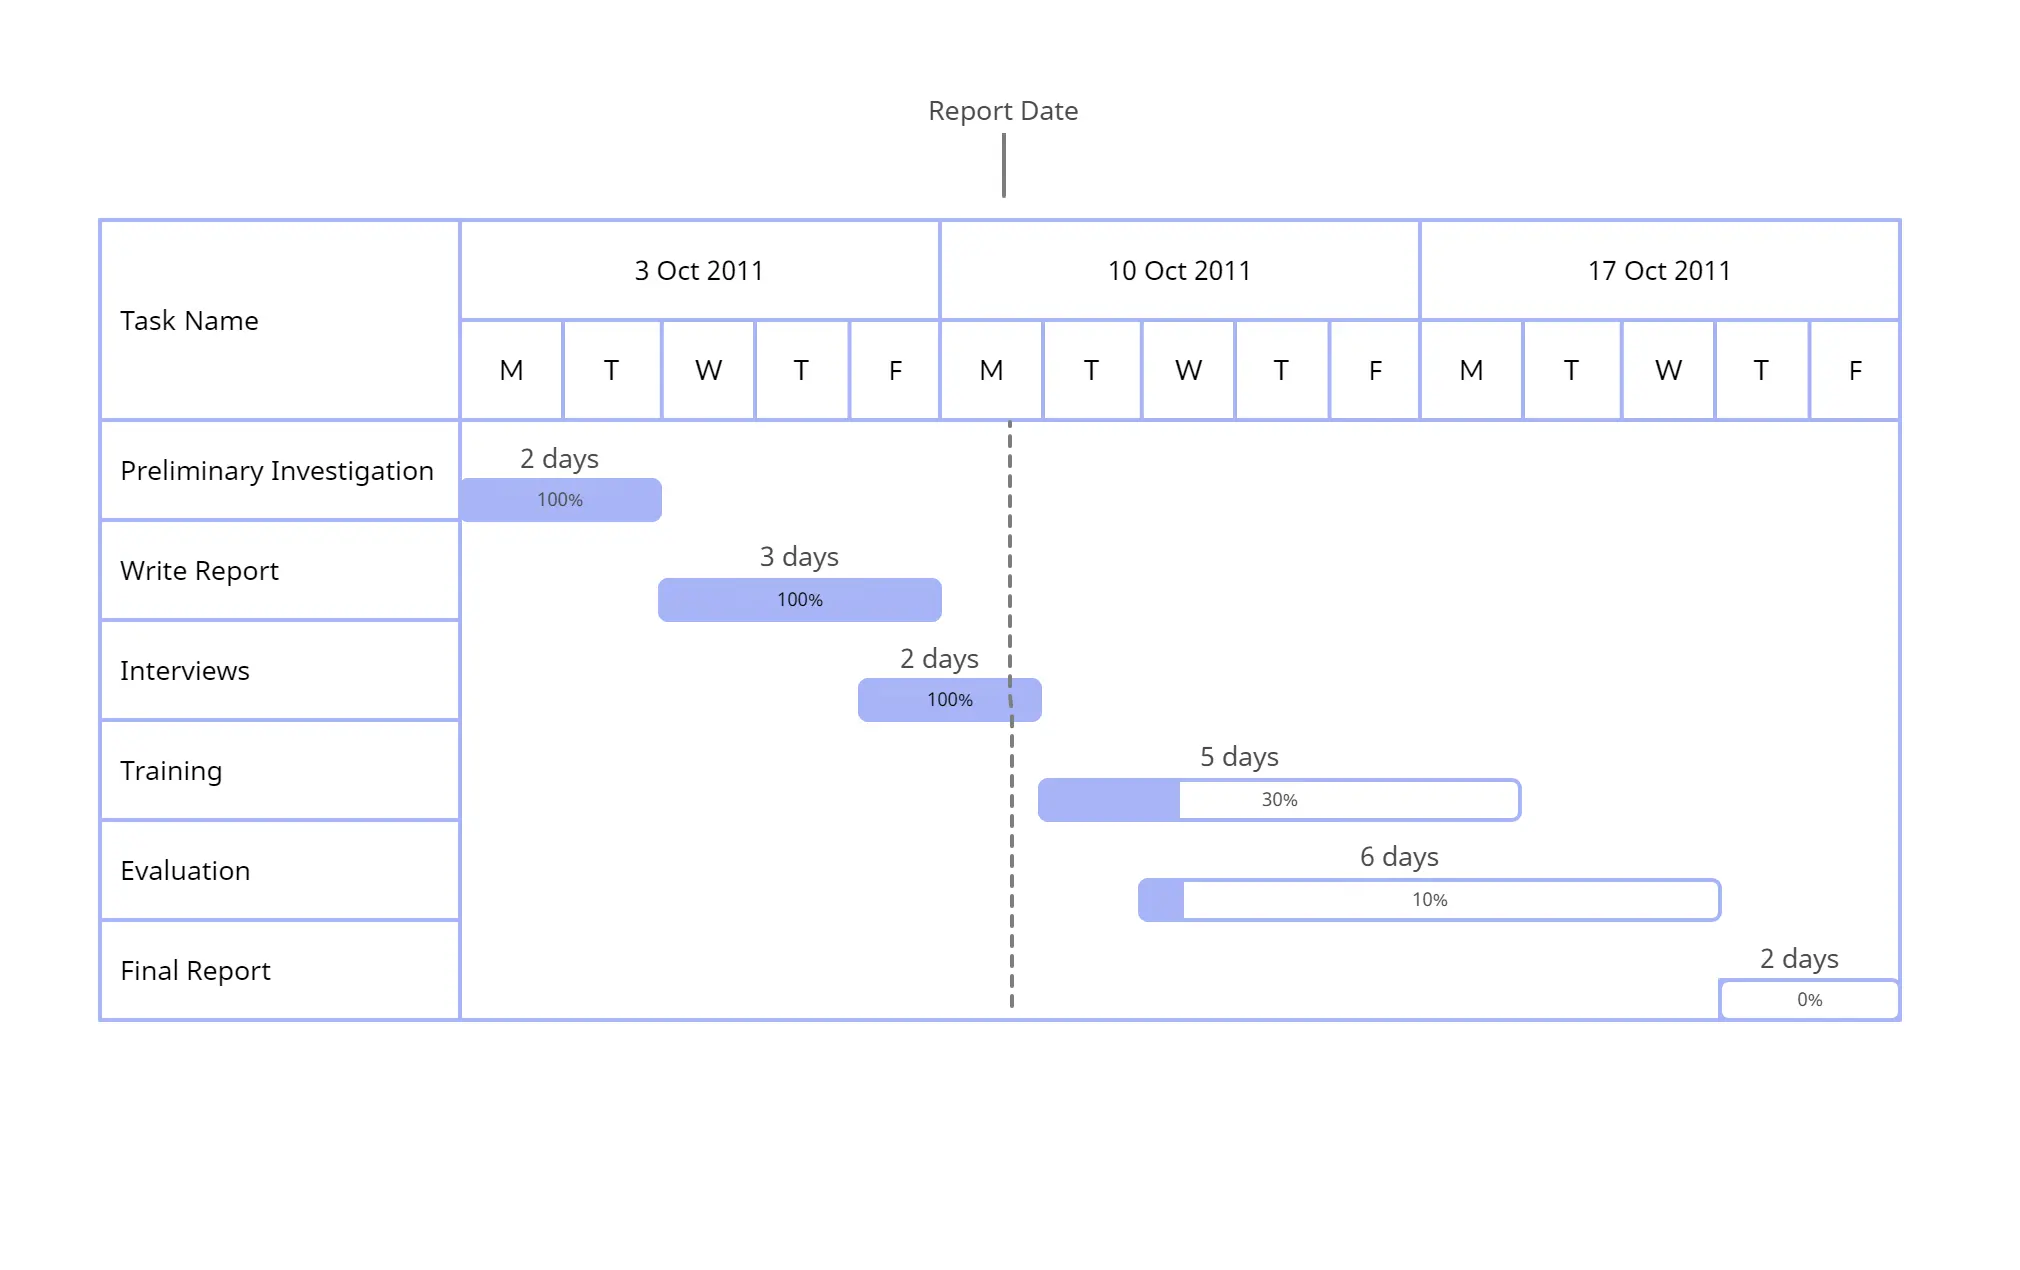
We have featured a number of posts about this topic in the past, so we will keep this section brief. The biggest advantage of using Gantt charts for project planning is that they allow the manager to determine a time duration for each activity. Gantt charts allow for the effective display of task dependencies, information flows, and relationships between different activities. They do not put any emphasis on the logic controlling the decision making. Creatley’s Gantt chart designing tool can be used to make charts for simple and complex projects.
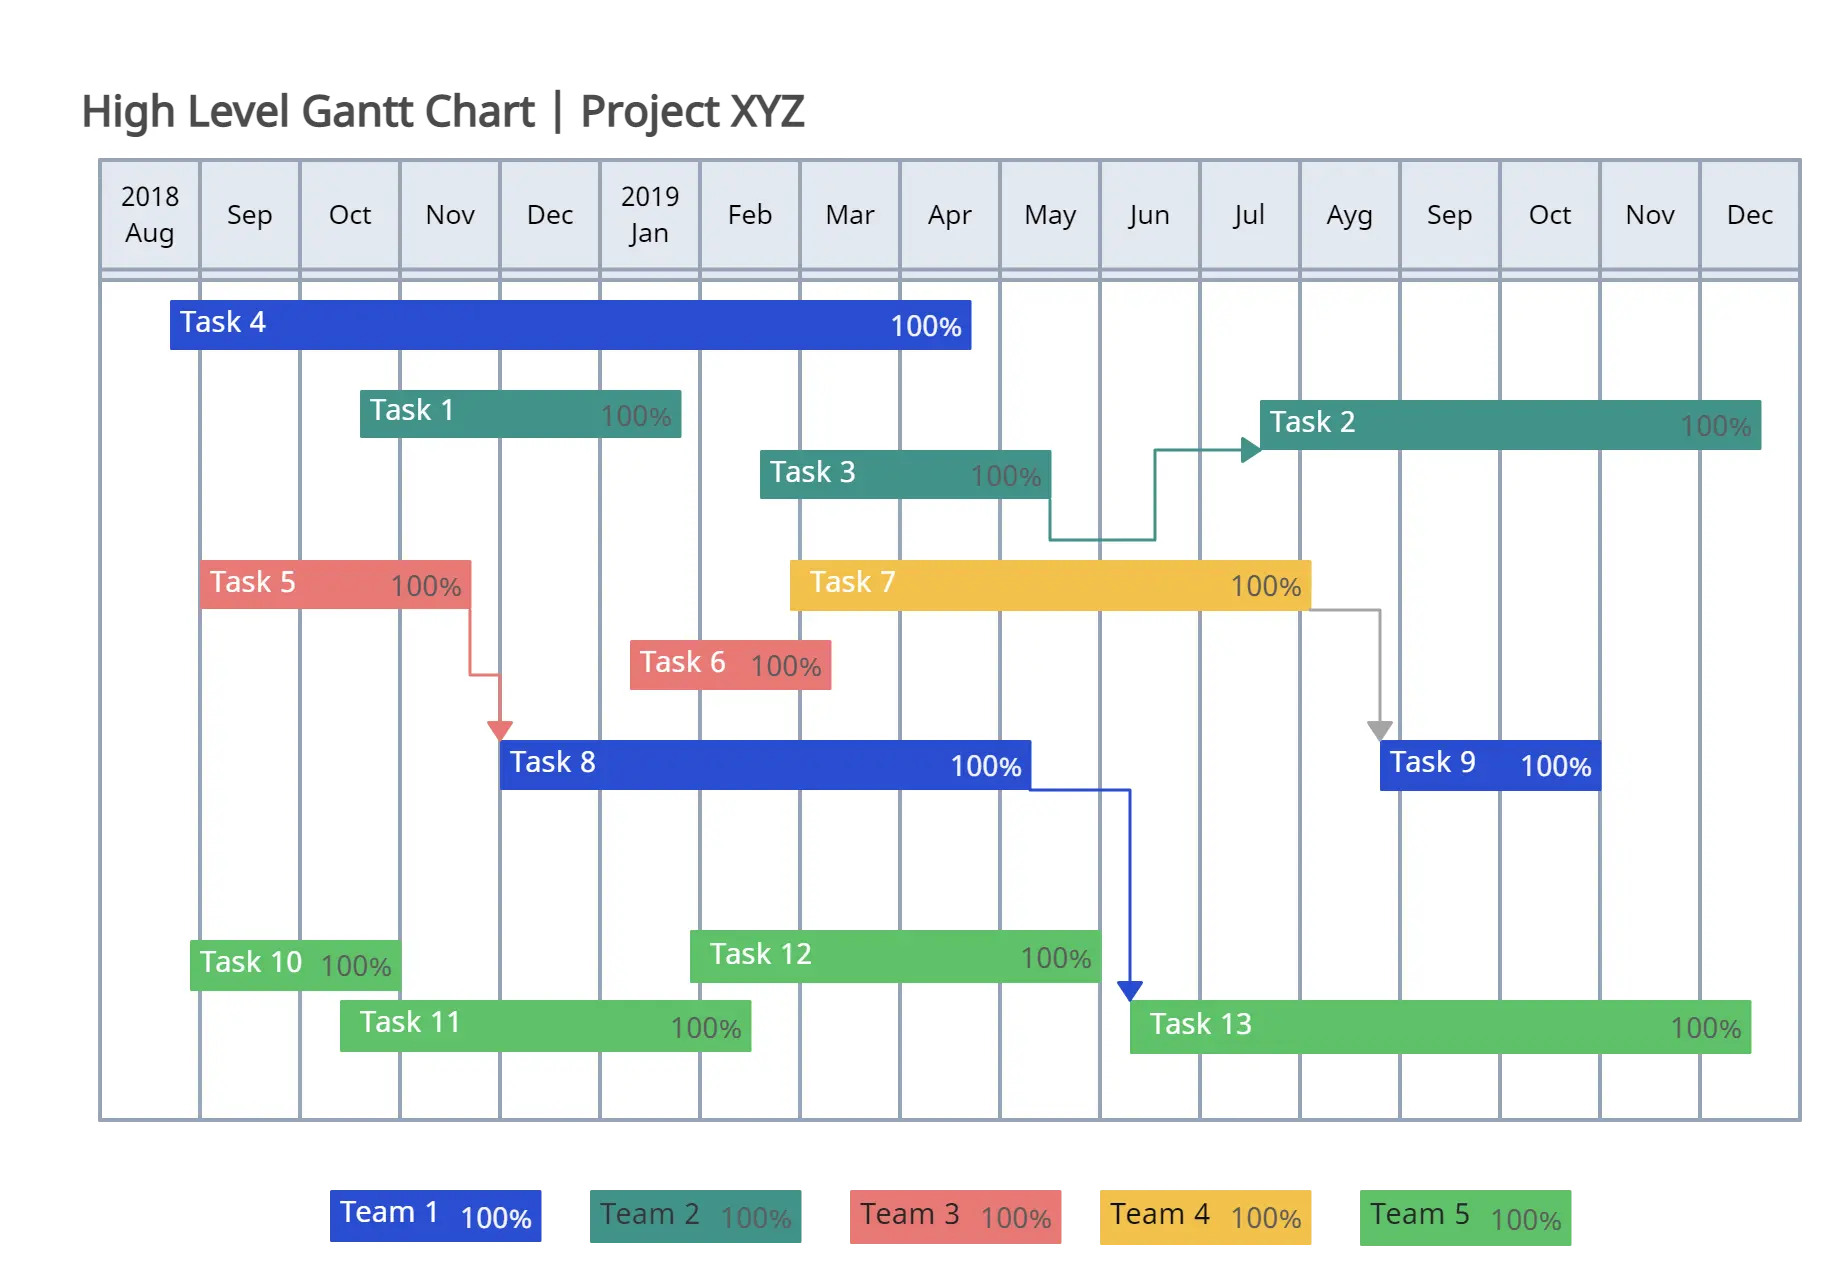
Use Gantt Charts for High Level Plans
Gantt charts are perfect for high-level plans and complex planning. Suppose you have a complex project to plan and the project spans over several weeks. Your first step should be to draw a mind map and come up with as many tasks and subtasks related to the project as possible. You should then identify the main tasks and draw a flowchart using Creatley’s flowchart designing tool.
After designing a flowchart, you should be able to see all the essential task presented in front of you clearly. Now to create a Gantt chart, you need to know the exact duration that each task should take. You should calculate your deadlines in mind, allocate resources accordingly, and assign each essential task with a time frame. List the tasks and their time frame in a table:
| Task | Duration |
|---|---|
| Task A | 3 weeks |
| Task B | 2 weeks |
| Task C | 3 weeks |
| Task D | 4 weeks |
Once you have determined the duration for essential tasks, you can identify their relationships, see if they can function independently, and add to the table:
| Task | Duration | Dependent Upon | |
|---|---|---|---|
| Task A | 3 weeks | ||
| Task B | 2 weeks | A | |
| Task C | 3 weeks | B | |
| Task D | 4 weeks | C |
Furthermore, you can identify if the tasks can be performed parallel to others or if they are sequential. In the example we have used each task so far is dependent on the preceding task and cannot be accomplished simultaneously with other tasks.
In a complex project, there will most likely be an opportunity to run several tasks at once. You will just have to identify which tasks can be run independently and will have to keep checking the new tasks that become available after the completion of each task.
After identifying the tasks, drawing a flow chart, identifying the different types of tasks and their inter-relationship, you can easily construct a Gantt chart.
A Few Templates to Get You Started
If you are about to start a complex project and are looking to draw flowcharts and Gantt charts to make project planning and management easier, try Creately’s diagram software. Use the flow chart to look at the bigger picture, and then use the Gantt chart to get into details. Get started faster with our professionally drawn gantt chart templates and for more information, contact us at support.
Here are a few templates to get you started in the meantime.
Template 1 - Gantt Chart for High Level Project Plan
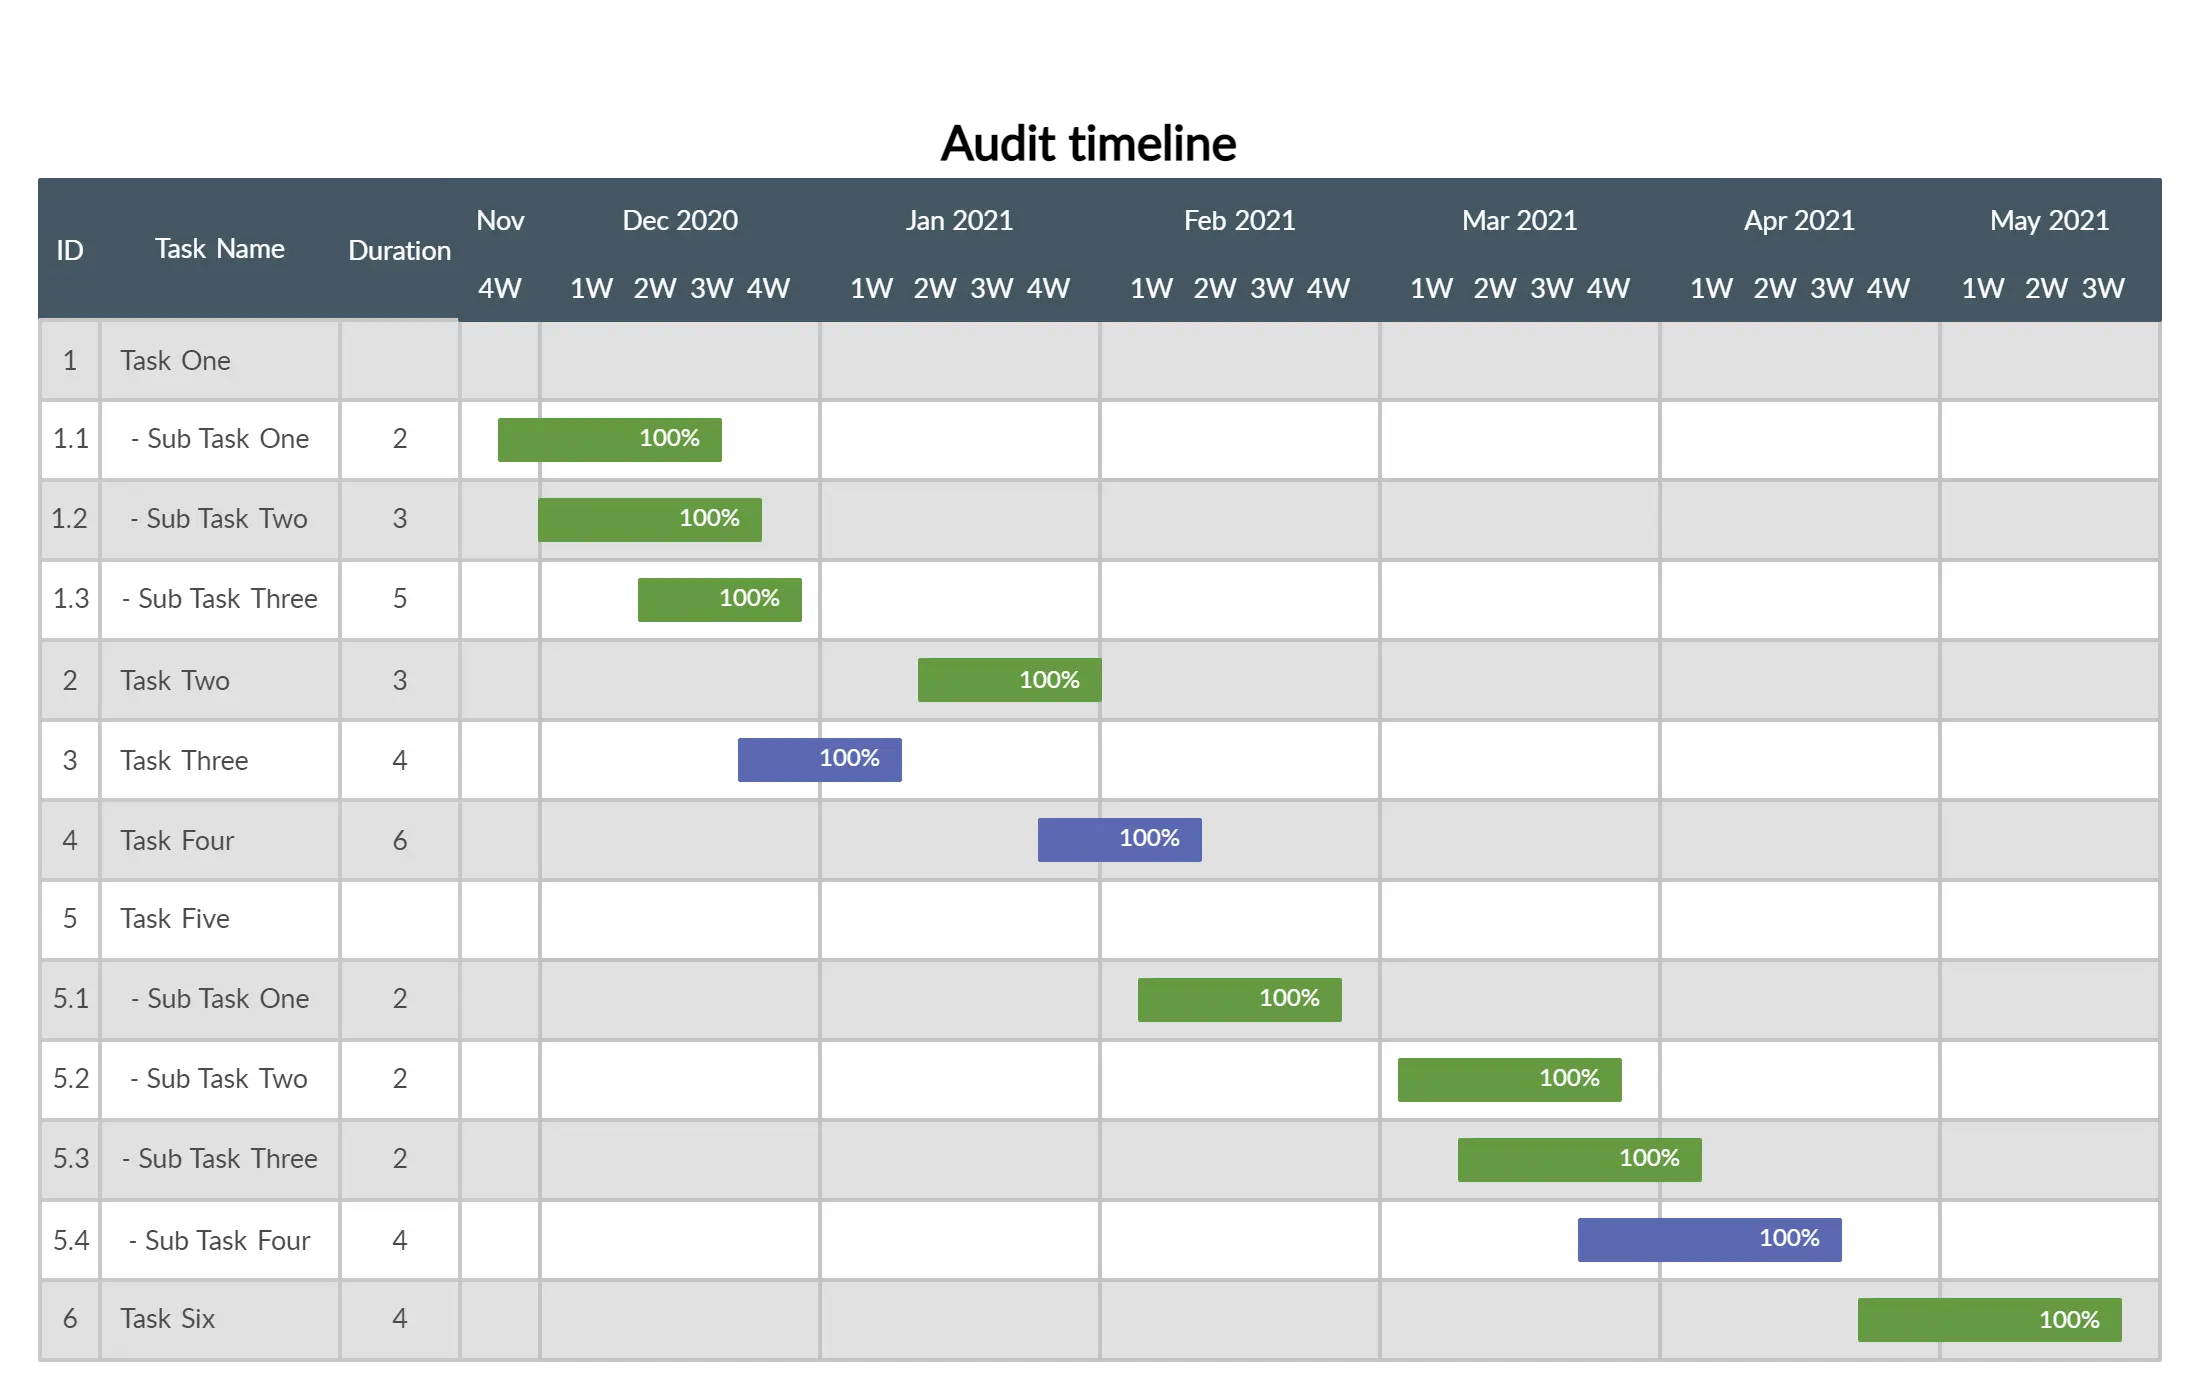
Template 2 - Gantt Chart for Company Audit
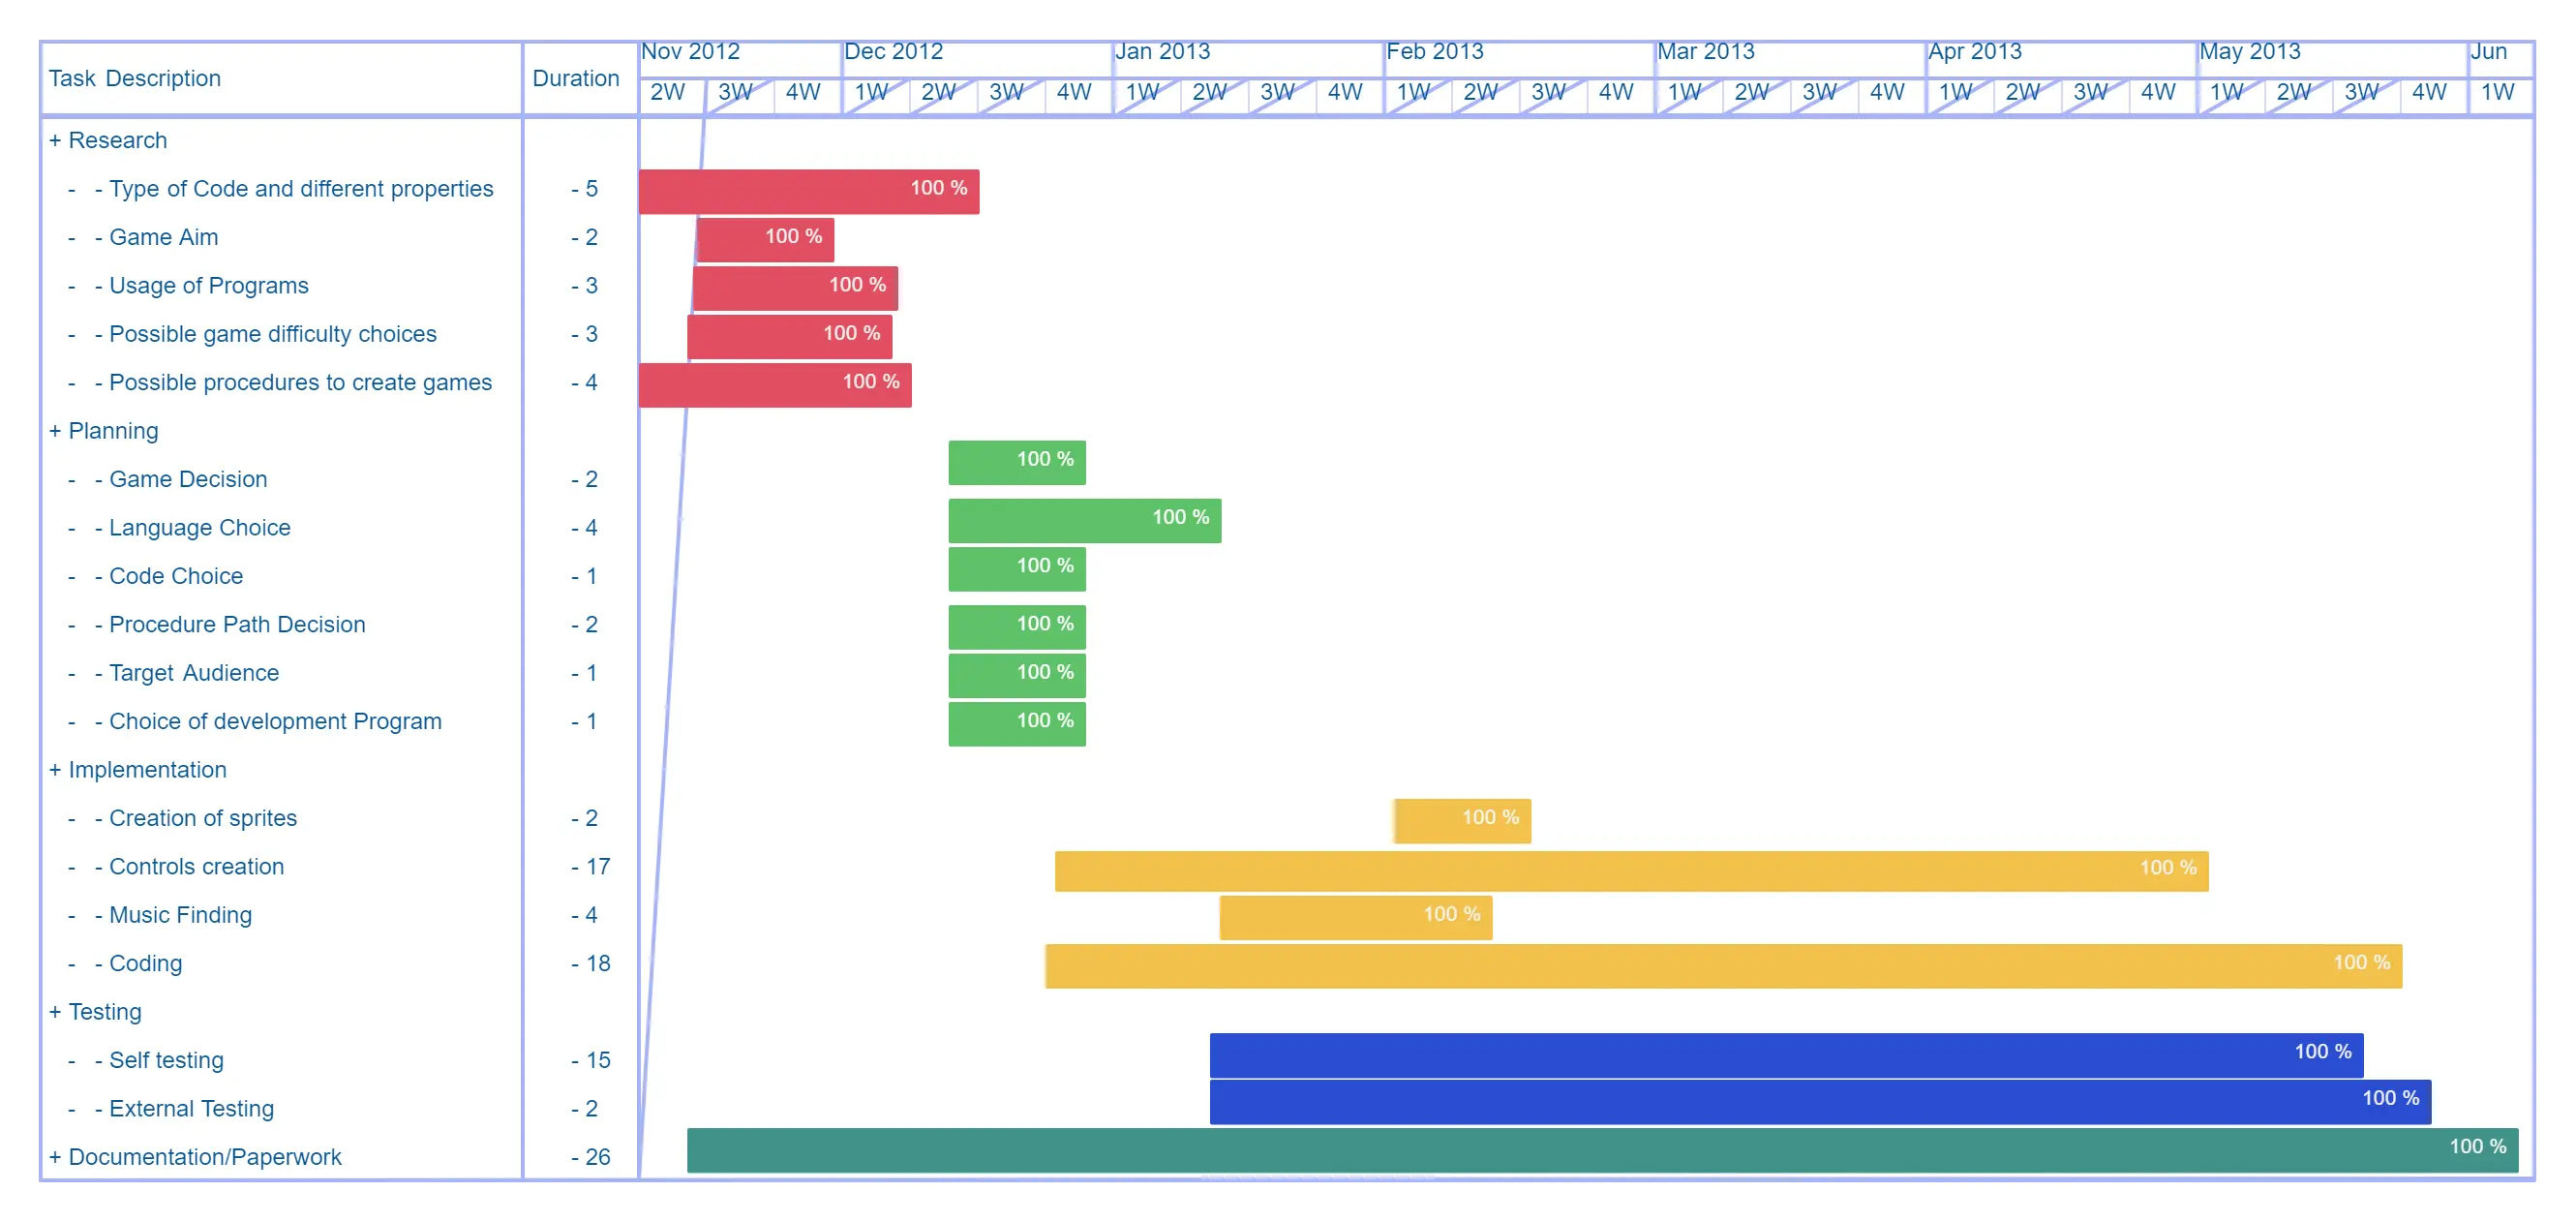
Template 3 - Game Development Project - Gantt Chart
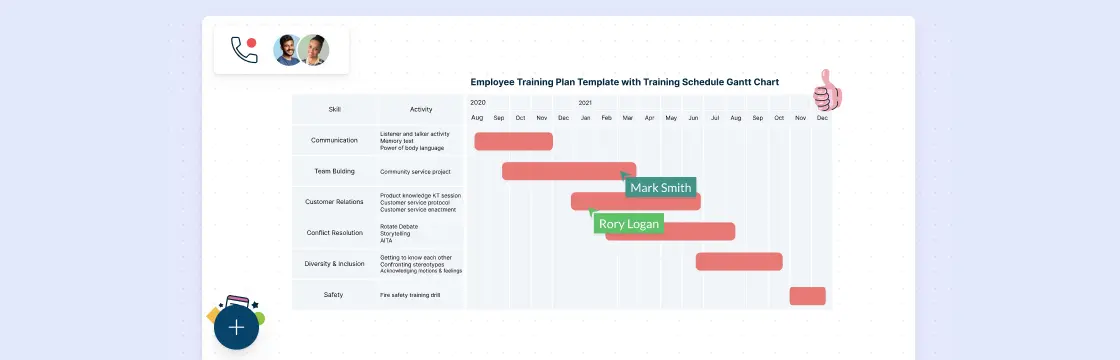
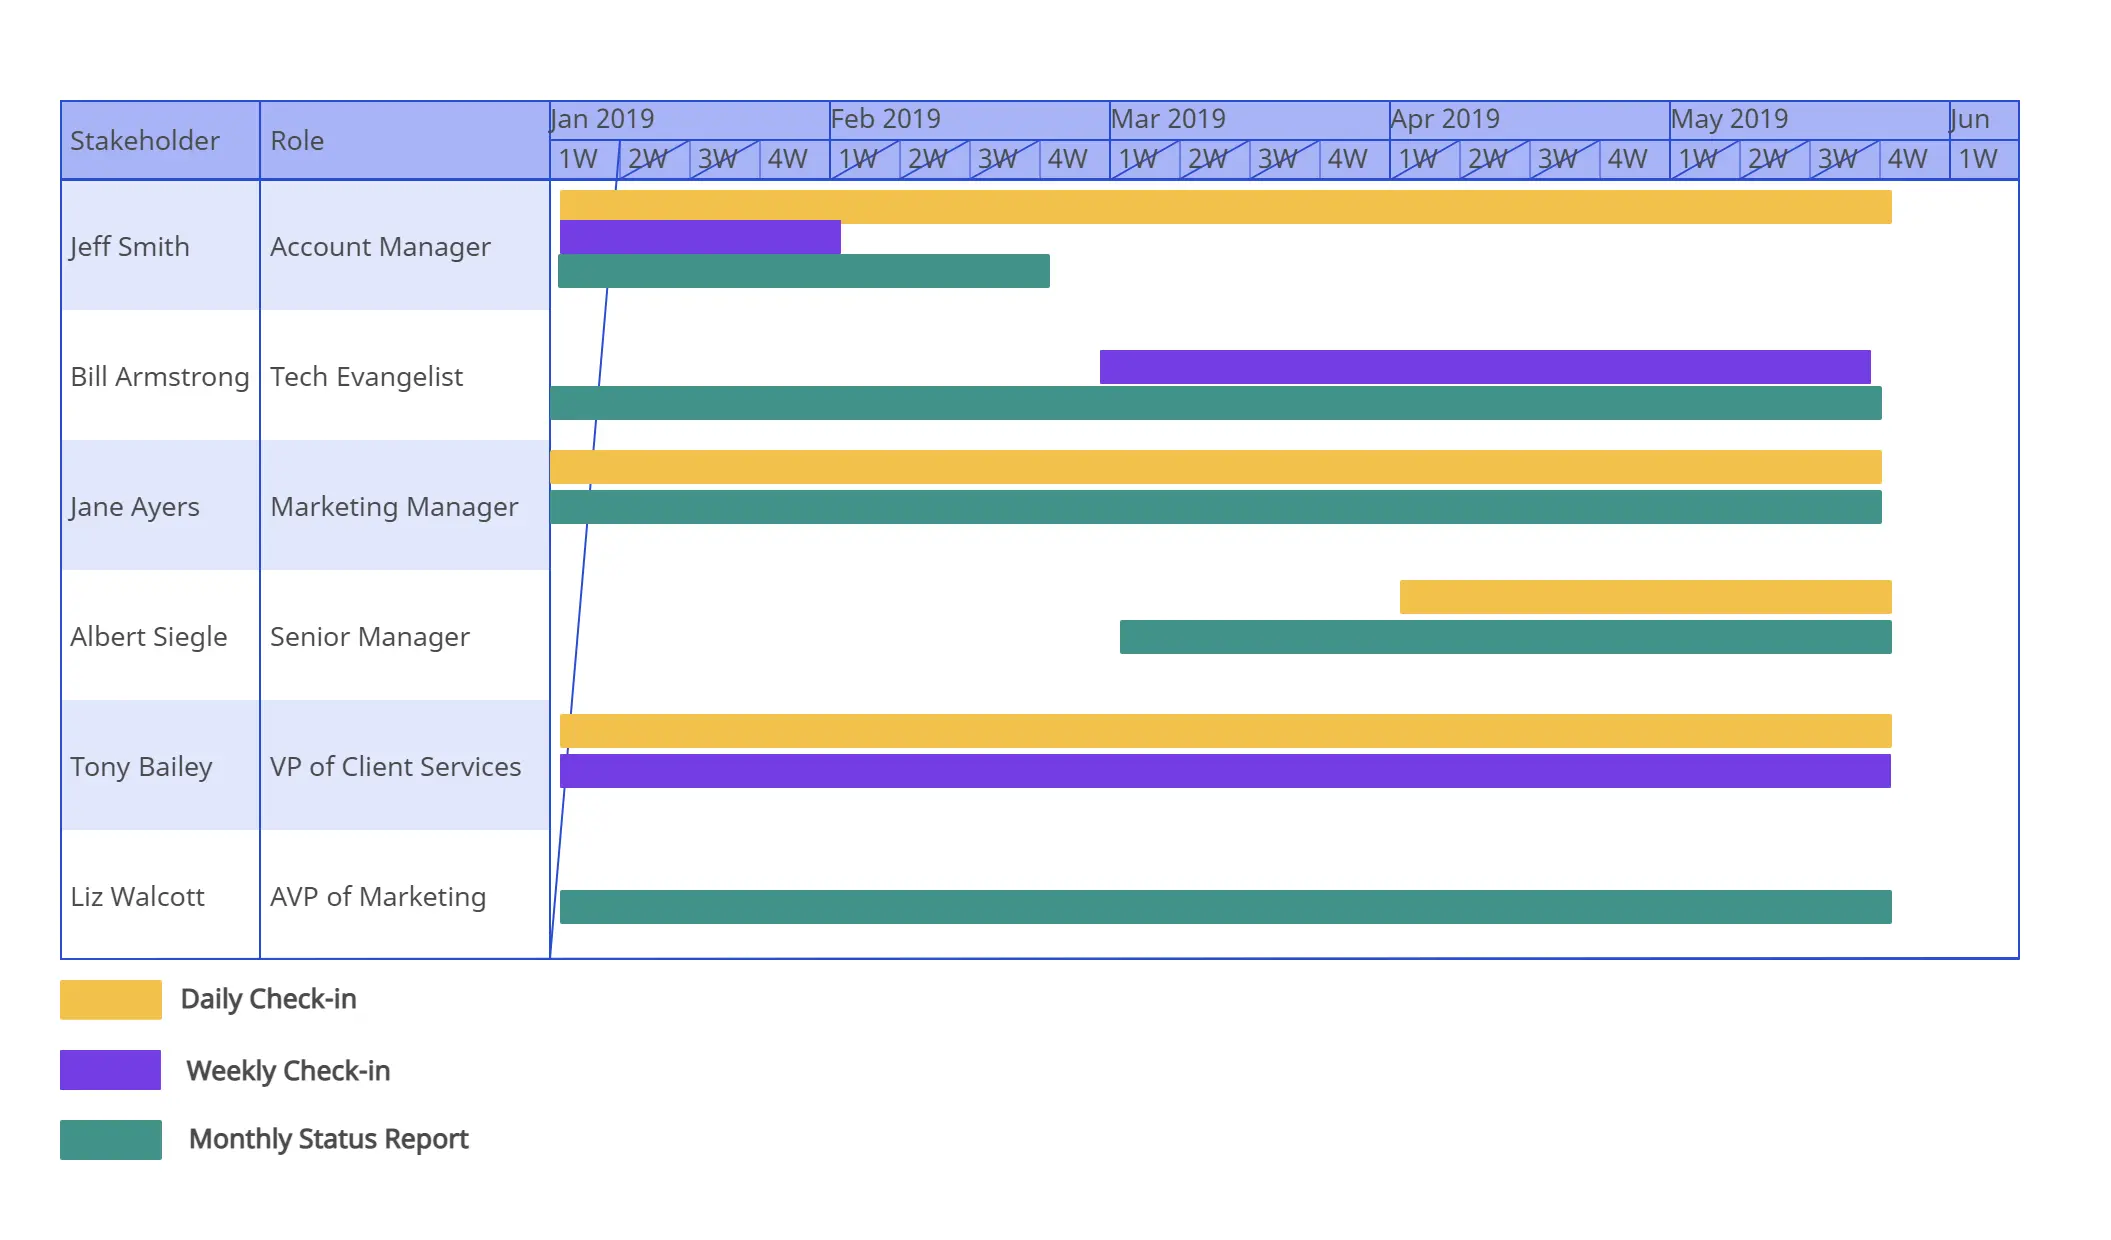
Template 4 - Communication Schedule Gantt Chart
Template 5 - Decision Flowchart Template
Template 6 - Website Design Workflow
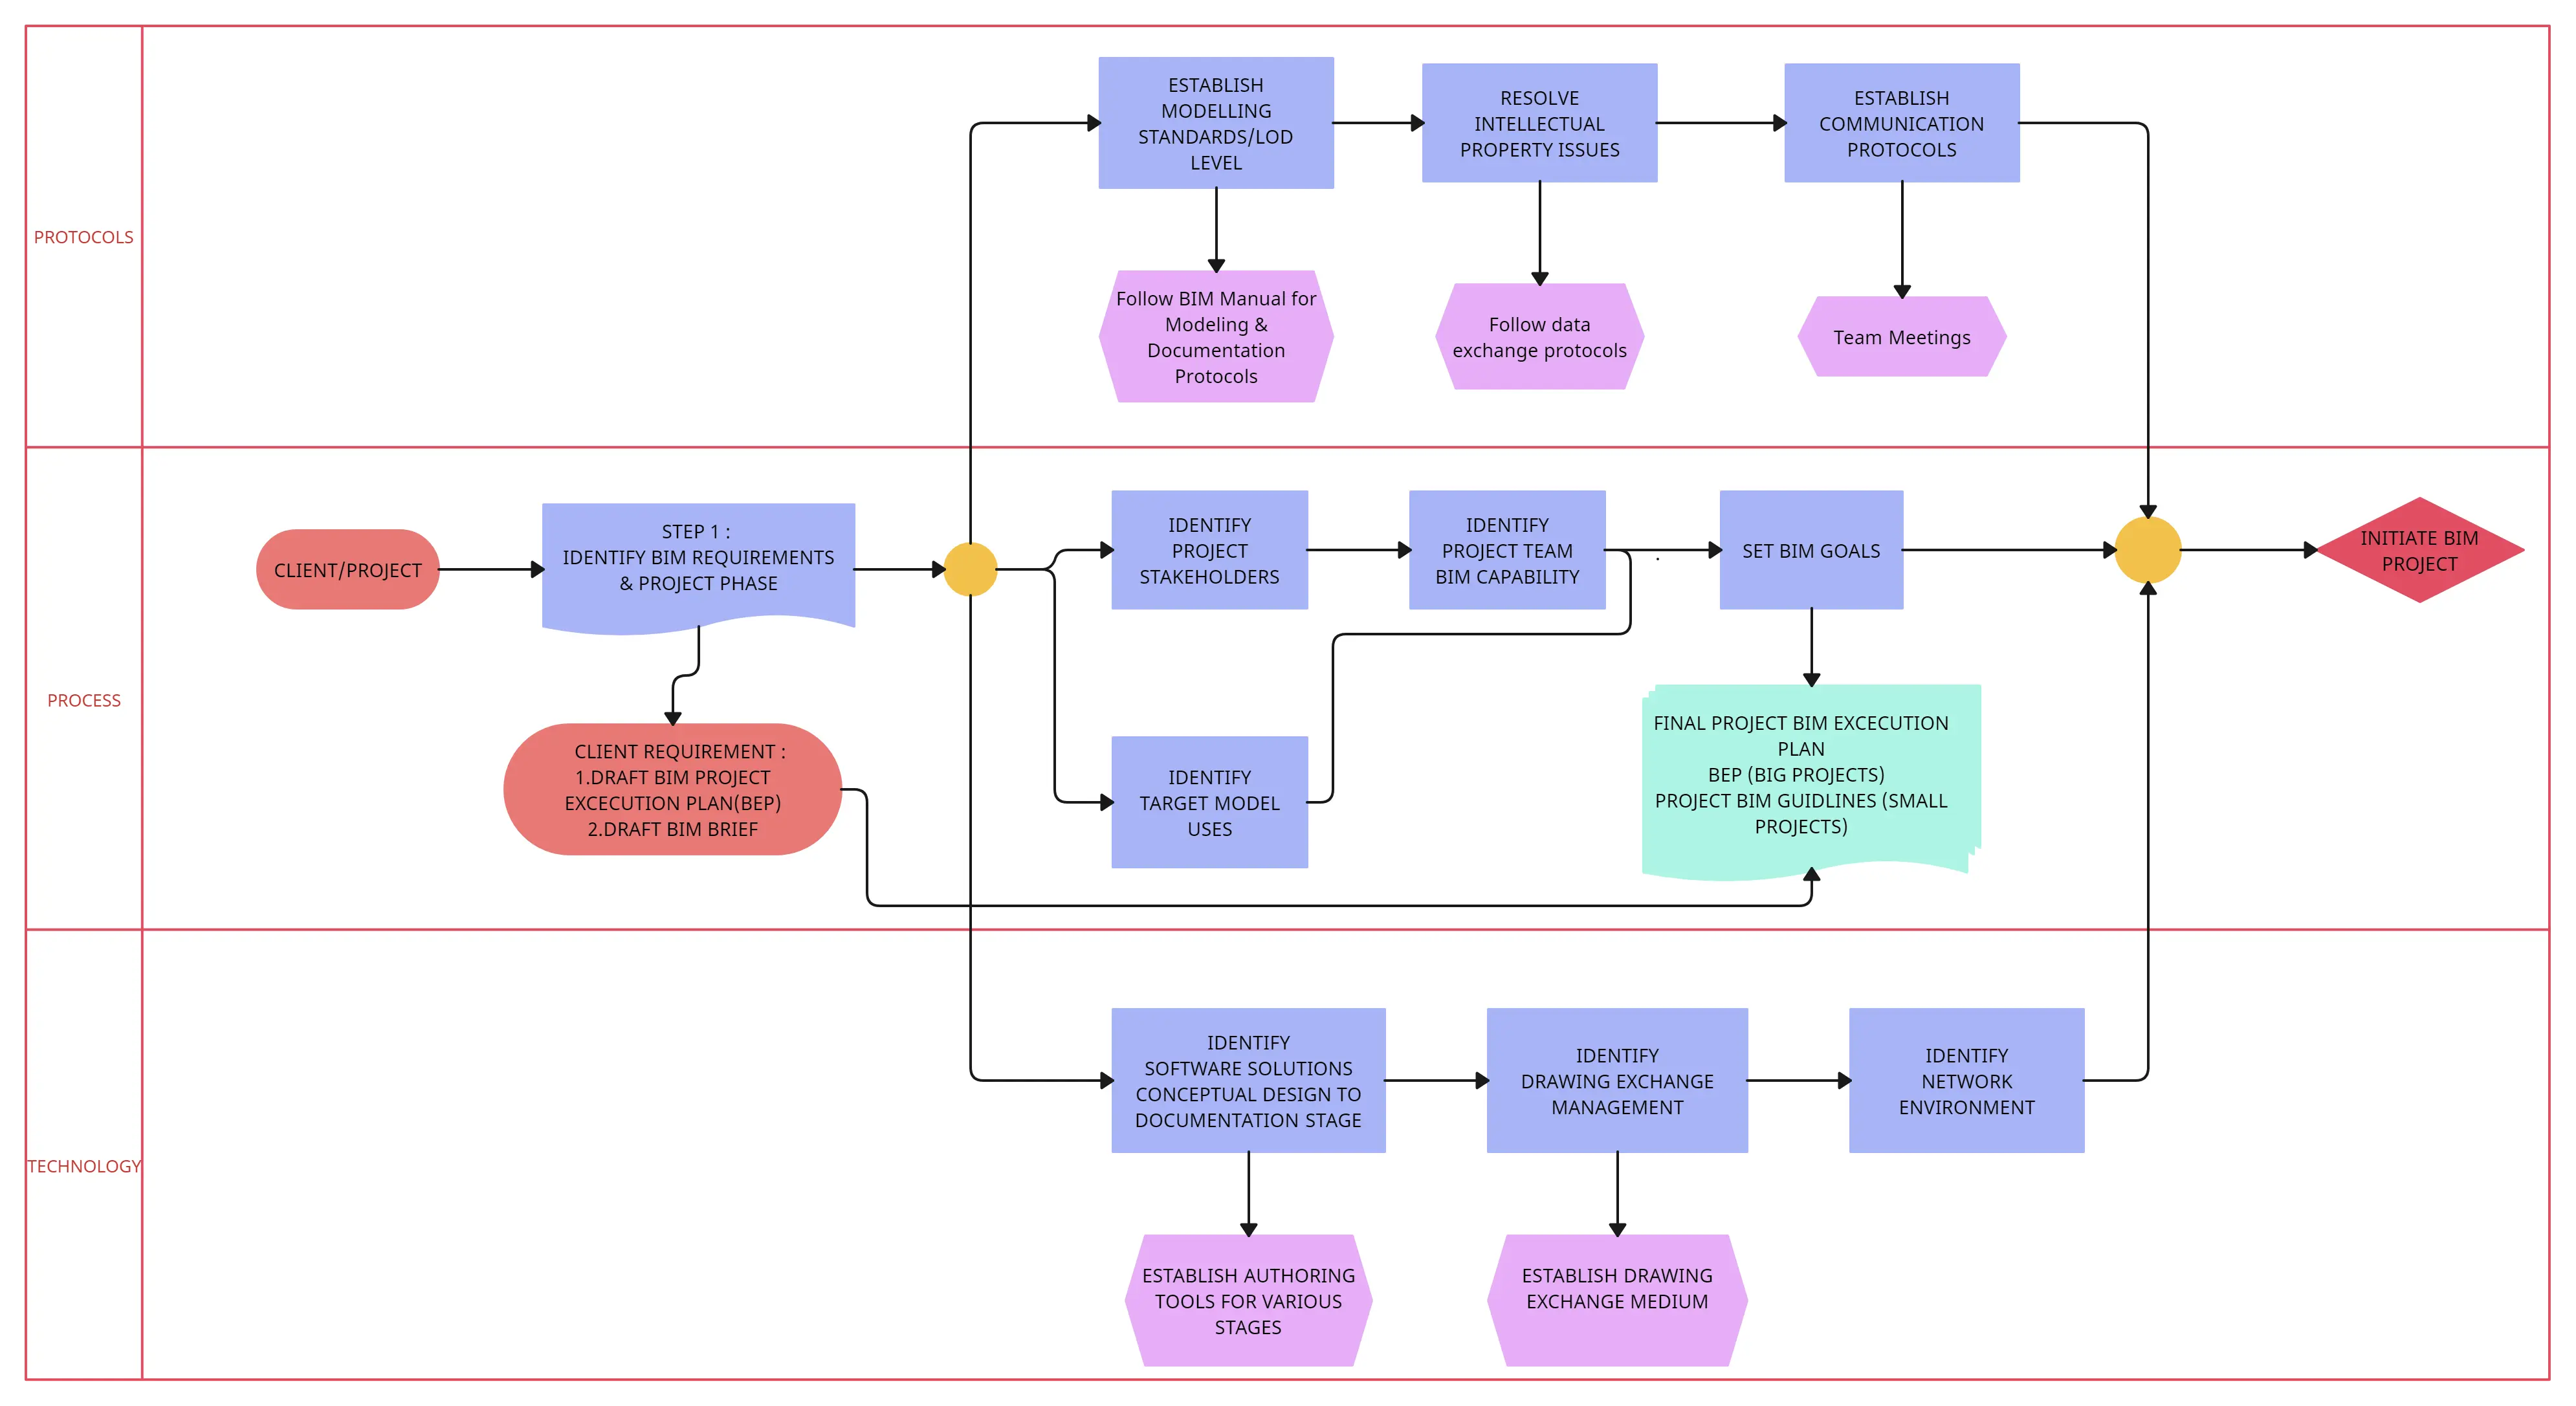
Template 7 - Project BIM Workflow