UX Research Methods
Design Outstanding User Experiences
Visually collaborate with your team on understanding what users need, what they expect, what's important to them, how they behave, and the challenges they face when using your products.
- Visually capture, organize, and analyze user research data
- Infinite visual canvas to map the entire user journey
- Use predefined templates to capture user behaviors and requirements faster
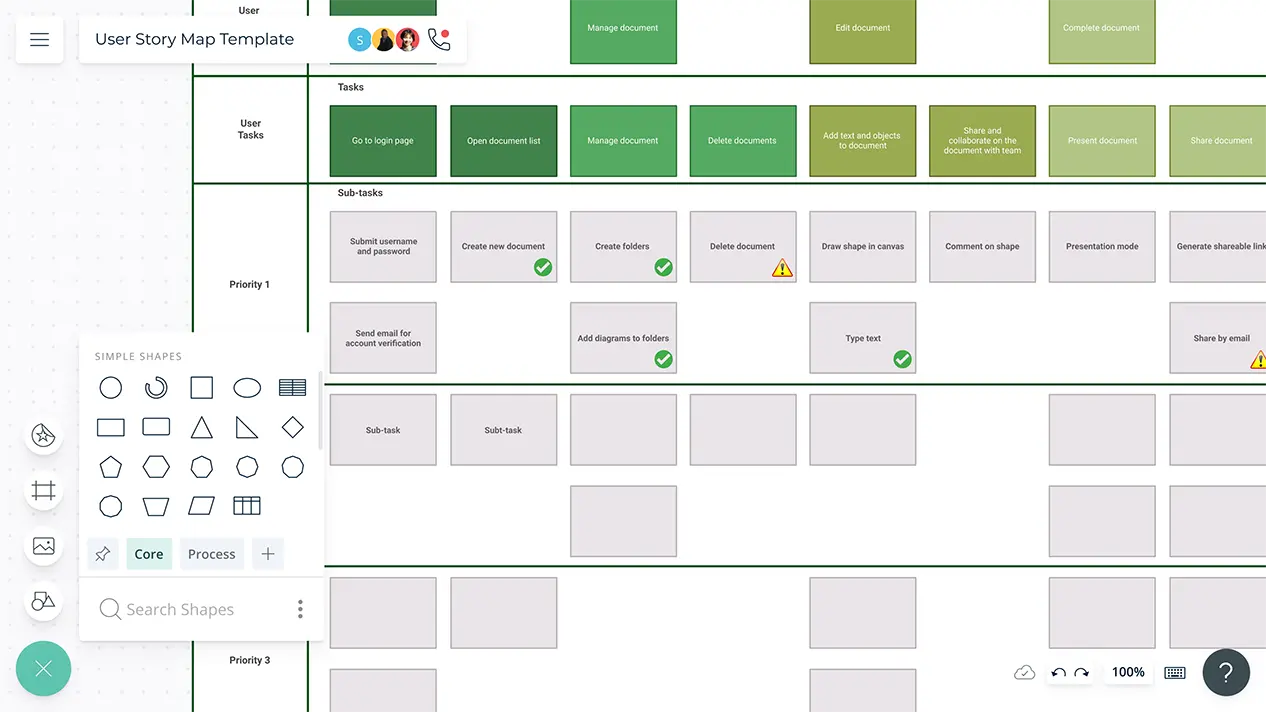
- Visually capture, organize, and analyze user research data
- Infinite visual canvas to map the entire user journey
- Use predefined templates to capture user behaviors and requirements faster

Develop a Better Understanding of User Requirements
Multiple customizable frameworks to quickly get started identifying user behavior and expectations. Create customer journey maps, empathy maps, requirement breakdowns and much more.
Import images and vectors to the canvas and embed documents with in-app previews to provide more context and develop a better understanding.
Simple to use drag and drop tools to quickly visualize research data.
Over 50 types of diagrams with specialized shape and icon libraries to visualize any type of data.
Transform Data Into Experiences

Prioritization grids for segmenting research data according to priority of implementation.
Add detailed docs, attachments, links and more via the notes feature on each item to capture details and the big picture in a single space.
Comment with context, have discussions and follow-ups on the same canvas. Async!
Built-in video conferencing and whiteboarding to work closely with the team in real-time.

From Visualization to Execution on a Single Canvas
Connect to your favorite tools with Creately plugins for Github, Slack, Google Workspace, Confluence, and more to execute the experience.
Export workspace as SVGs, PDFs, JPEGs, and PNGs to publish, present, print, or share.
In-built project management tools to manage ownership, tasks, and revisions.
Generate multi-perspectives of your user experiences with model objects; convert visualizations process maps to workflows.
What Is UX Research?
UX research is the process used to investigate user behavior, needs and requirements. The knowledge gathered thus is then used to develop better user experience with the products.
How to Do UX Research with Creately?
- UX research or user research should be done at the beginning of the design process. This way you can stay user-focused throughout.
- Set clear goals for your user research. To do this, you need to figure out the right questions to ask to get measurable answers and set up the scope for your work.
- Based on the nature of your project, choose the correct and effective UX research methods that will help you get relevant results.
- Customer journey mapping, card sorting and empathy maps are some of the user research methods you can do using Creately. Using real-time collaboration features, you can invite your teammates or even users to share their input.
- Share your diagrams showing user research findings with stakeholders, partners etc. This will make it easier to analyze the data and draw conclusions.
- If you want to add your user research data to PowerPoint presentations or Word documents, you can export your diagrams as images, PNGs, SVGs, JPEGs and PDFs.
- Conduct UX research from time to time to keep up with the changing technology, user behavior, trends etc.