Synoptic Table Maker
Easily Organize and Compare Information with Synoptic Tables
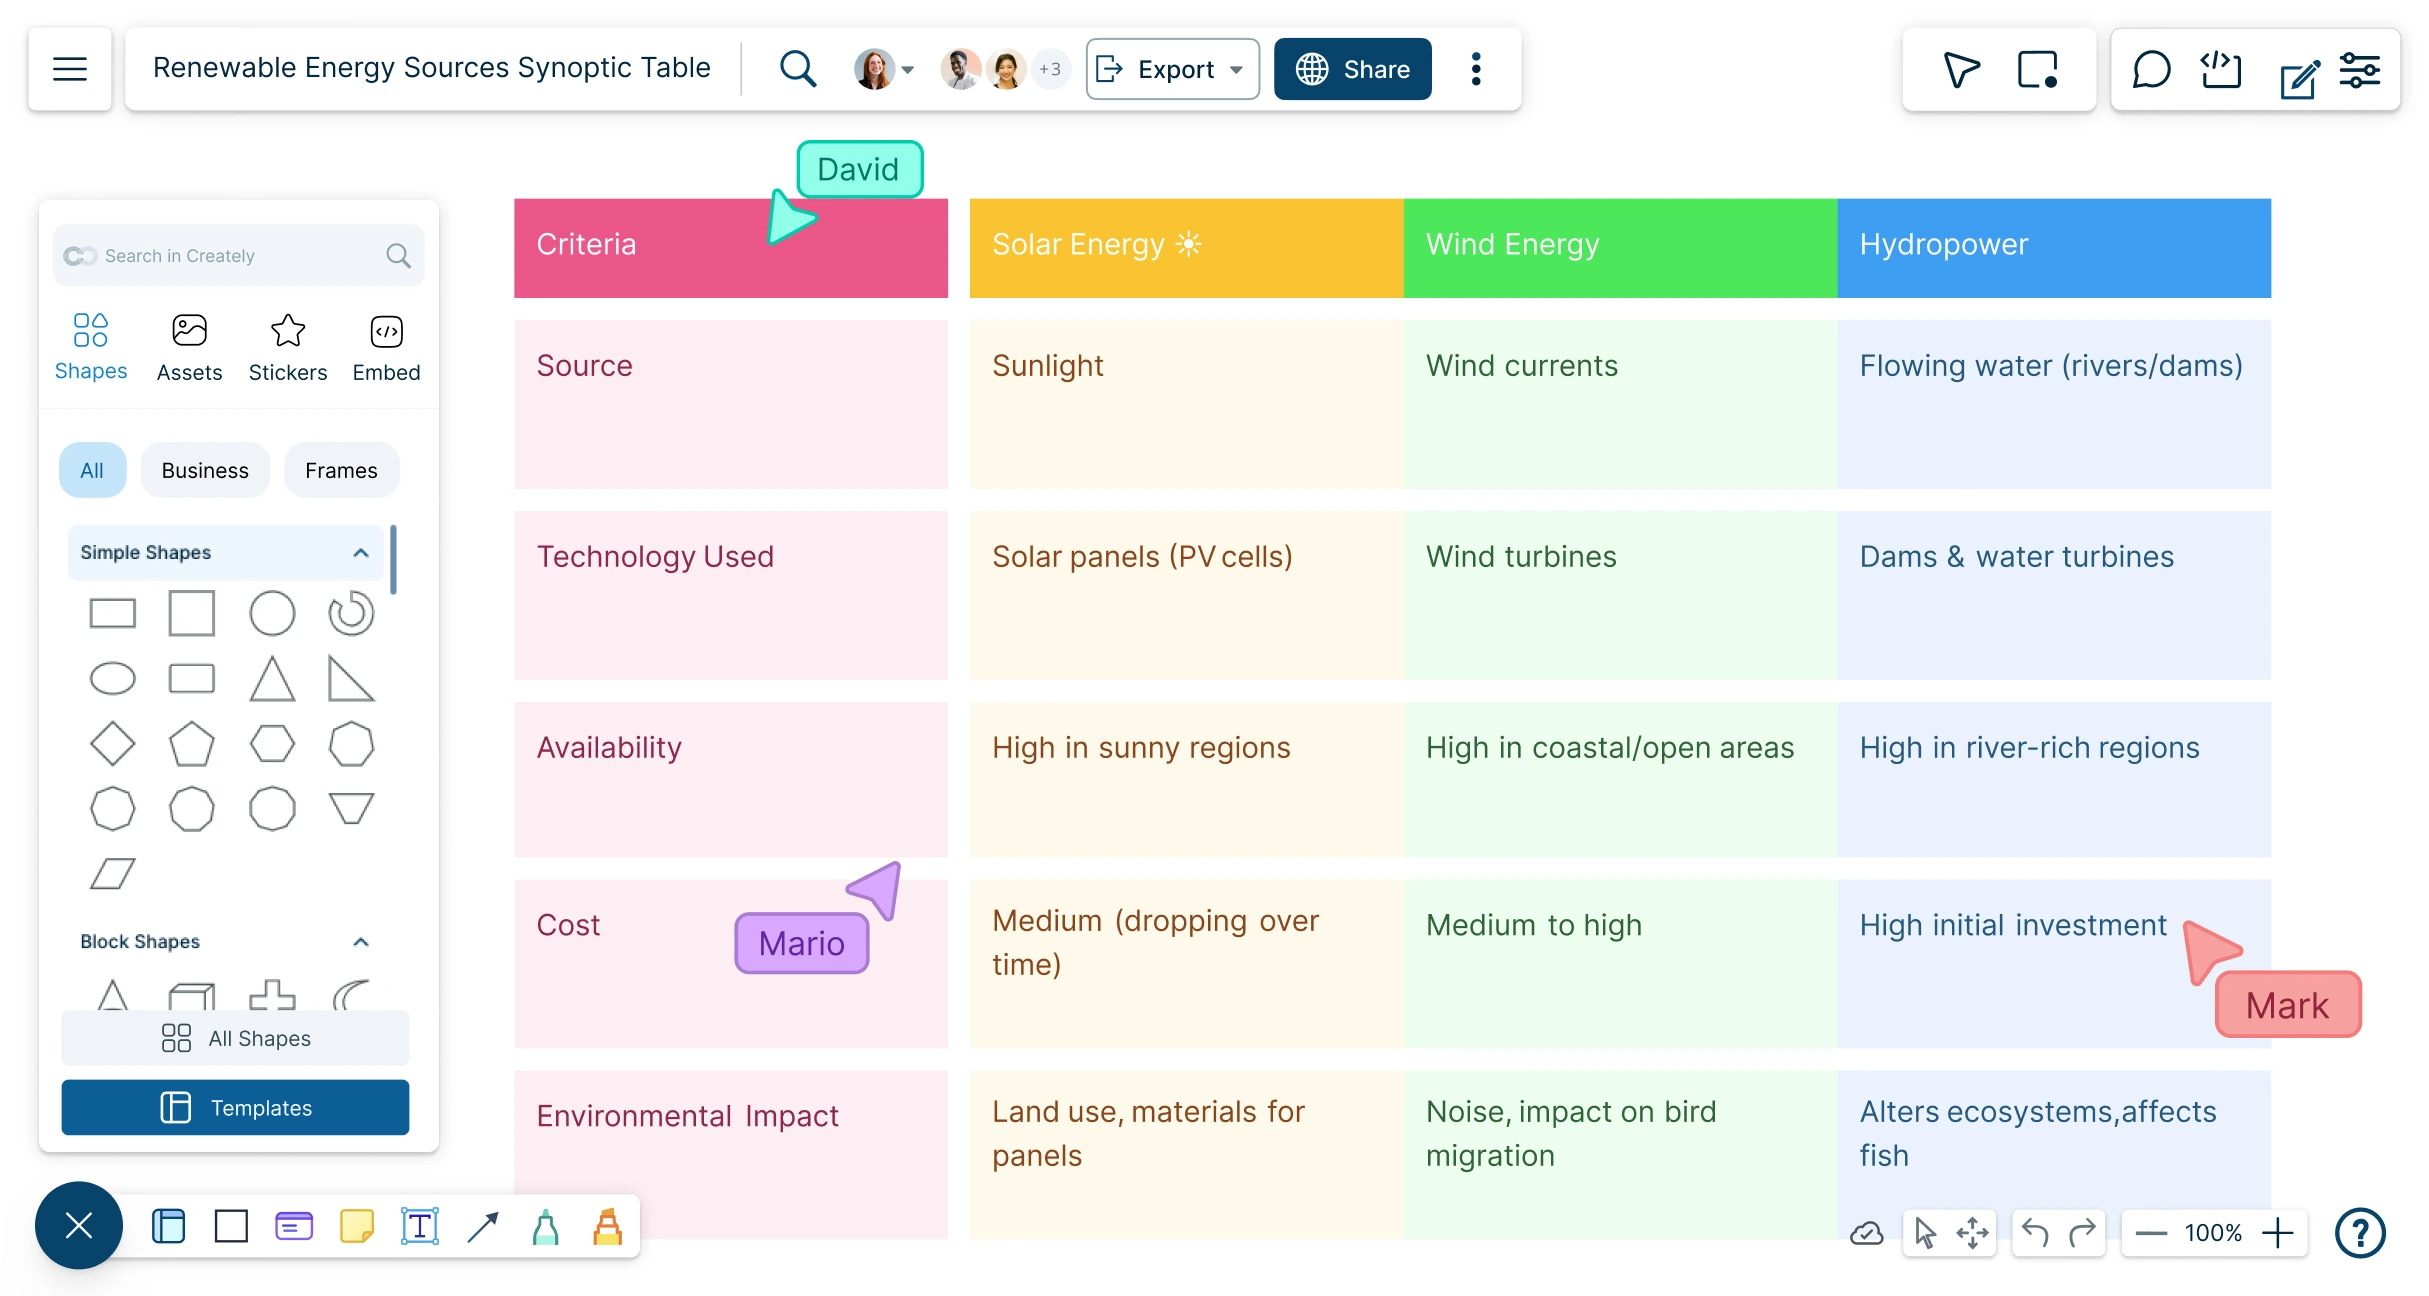
Creately’s Synoptic Table Maker lets you organize information side by side, highlight key similarities and differences, and uncover patterns and trends to help you make faster, more informed decisions.
Powerful table shape to create comparison tables & matrices
Built-in collaboration tools for team brainstorming sessions
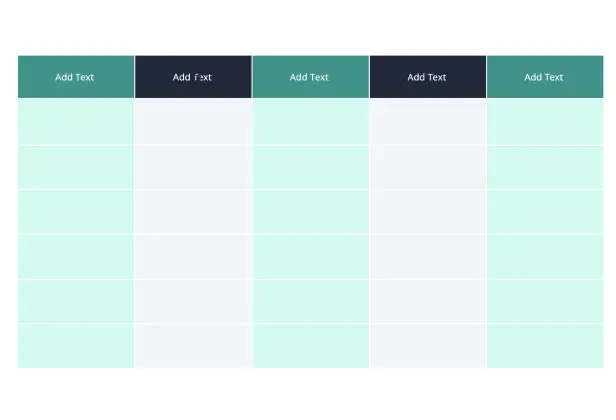
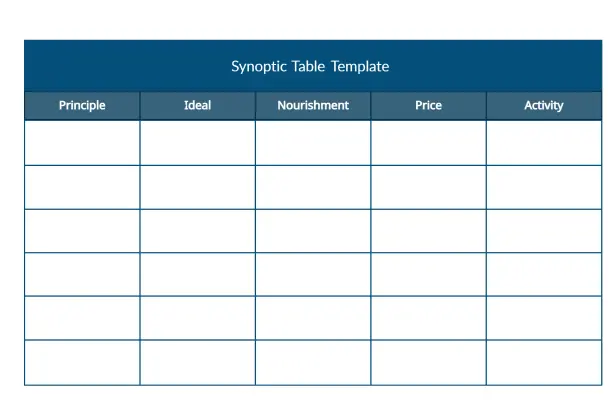
Multiple synoptic table templates to get a head start


 Diagramming Visual Collaboration Org Chart


Create a Logical Hierarchy of Your Ideas

Quickly group information together with intuitive drag and drop tools.
Add detailed docs, attachments, links and more with integrated notes.
Highlight information and sketch out ideas with freehand drawing.
Intuitive tables and grids to create customizable synoptic tables with ease.

Keep Your Ideas Organized
Import videos, photos, documents, screenshots, etc. on the topic onto the canvas.
Highlight key areas with powerful styling and formatting options.
Find information easily on complex synoptic tables with universal text search.
Explore Concepts Collaboratively

Collaborate with peers on a shared canvas with real-time mouse cursors.
Comment with context, have discussions and follow-ups on the same canvas. Async!
Share your synoptic table with others using secure sharing links.

Deliver Compelling Presentations
Built-in tools to quickly create interactive presentations right on the canvas.
Export synoptic tables as SVGs, PDFs, and PNGs to publish, present, print, or share.
Navigate to specific points on your synoptic table using frames.
What is a Synoptic Table?

When Can Teams Use Synoptic Tables to Organize Information?
Synoptic tables are a useful tool for teams to organize and present information in a structured and concise way. Here are some examples of how teams can use synoptic tables:
- Project management
A team can use a synoptic table to track the progress of a project. The table can include columns for tasks, due dates, assigned team members, and completion status. This allows the team to quickly see which tasks are on schedule and which ones need attention.
- Sales tracking
A sales team can use a synoptic table to track their leads and sales. The table can include columns for lead source, contact information, sales stage, and conversion rate. This allows the team to easily track their progress and identify areas where they need to focus their efforts.
- Customer support
A customer support team can use a synoptic table to track customer issues and resolutions. The table can include columns for customer name, issue description, assigned support staff, and resolution status. This allows the team to efficiently manage customer issues and ensure timely resolutions.
- Marketing campaigns
A marketing team can use a synoptic table to track their campaigns and results. The table can include columns for campaign name, target audience, channels used, budget, and ROI. This allows the team to evaluate the effectiveness of their campaigns and make data-driven decisions for future marketing efforts.
- Training and development
A team responsible for training and development can use a synoptic table to track employee training progress. The table can include columns for employee name, training modules, completion dates, and scores. This allows the team to quickly identify areas where employees may need additional training and track their progress over time.
How to Create a Synoptic Table
Open a Template in Creately
Launch Creately and start with a prebuilt synoptic table template to get started quickly. Creately’s synoptic chart tool also lets you create your own using the table shape.
Customize Columns and Rows
Define the features or elements you want to compare as column headers. Add the options, products, or solutions you’re comparing as rows, and label them clearly.
Add Content and Details
Enter comparisons into each cell. Use sticky notes, the notes panel, or images/charts to add descriptions, analysis, or supporting details.
Collaborate with Your Team
Invite your team to the workspace with edit or review privileges. Use real-time cursors, synced previews, and version history to track changes as participants brainstorm and update the table with relevant details.
Review, Update, and Share
Check that your table is clear and well-formatted. Adjust font, colors, and alignment if needed. Then share it via a workspace link, export it as an image or PDF, or embed it for publishing and printing.
Create a Synoptic TableCreate Synoptic Tables Faster with Premade Templates

FAQs about Synoptic Tables
Why should you use a synoptic table?
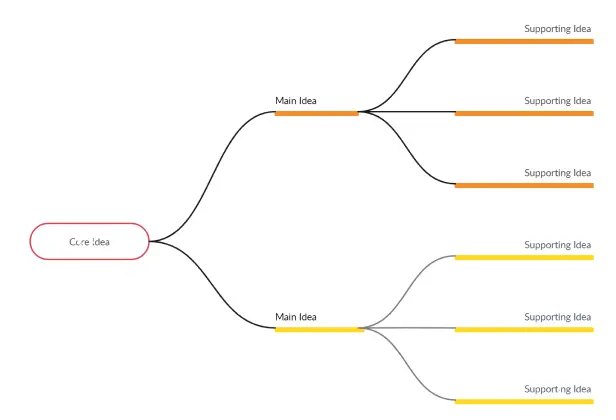
What is the difference between a synoptic table and a concept map?
How do I embed or share my synoptic table?
You can share your synoptic table in multiple ways using Creately. To get a link to embed in a particular site, go to the share option at the top left-hand corner of the workspace. Select ‘embed’ to get the required link.
You can download the workspace as an SVG, PNG, JPEG, or PDF to share. If you want to collaborate and give access to your co-workers to edit, go to collaborators in the share panel and send an invite by including their email. Don’t forget to select the ‘can edit’ option when sending the invite.
What’s the best free tool to create synoptic tables?
Can I customize the layout, colors, or styles of the table?
Who can benefit from using synoptic table software?