If you’ve ever tried value stream mapping and felt overwhelmed by unfamiliar icons, cluttered diagrams, or symbols that weren’t clearly explained, you’re not alone. This guide breaks it all down, starting with what value stream mapping is, followed by a clear explanation of value stream mapping symbols and meanings. You’ll see what each value stream icon represents, when to use it, and how it fits into the bigger picture, along with practical tips to avoid overcomplicating your map and turning insights into action.
What Is Value Stream Mapping?
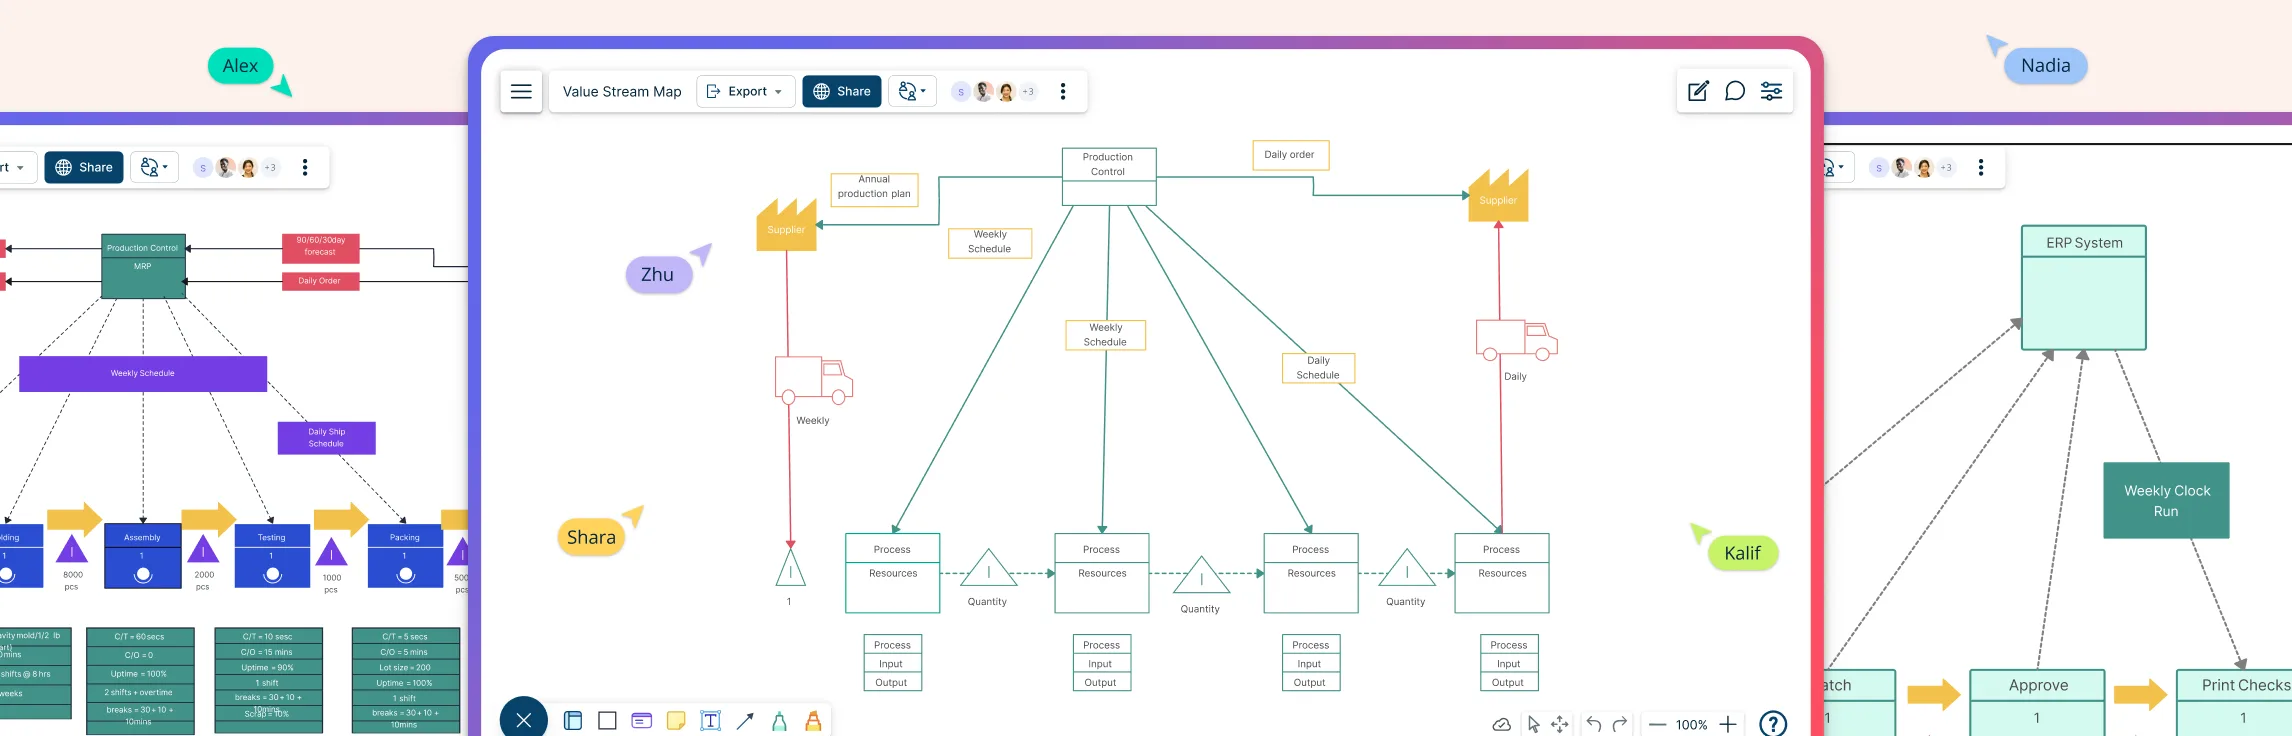
Value stream mapping (VSM) is a visual way to understand how work actually flows from start to finish. Instead of focusing on individual tasks, it shows the full journey of a product or service—making it easier to spot delays, bottlenecks, rework, and steps that don’t really add value. Teams use value stream maps to see what’s working, what’s slowing things down, and where effort is being wasted, so they can simplify processes and improve flow. A value stream map uses a standard set of symbols to represent process steps, information flow, inventory, delays, and timing, which keeps everything clear and easy to follow.
VSM Symbols and Their Meanings
Value Stream Mapping symbols provide a shared visual language that makes complex processes easier to read, compare, and improve. By using consistent symbols across process, material, information, and general elements, teams can quickly spot bottlenecks, delays, handoffs, and improvement opportunities without needing lengthy explanations or assumptions. Let’s look at the most common value stream map icons used across each category.
Value Stream Mapping Process Symbols
Process symbols are used to show where and how work happens in a value stream. They represent the core steps, responsibilities, and data points involved in delivering value, helping teams understand how different processes function and connect.
| Symbol | Name | Meaning |
|---|---|---|
| Customer/Supplier | Represents the supplier when placed at the upper left of the map and the customer when placed at the upper right | |
| Dedicated process flow | Shows continuous material flow through a specific department, process, operation, or machine | |
| Shared process | Represents a process, operation, work center, or department shared by multiple value stream families | |
| Data box | Displays key process data such as cycle time, output quantity, waste, or frequency | |
| Workcell | Indicates multiple processes integrated into a single manufacturing workcell |
Value Stream Mapping Material Symbols
Material symbols visualize how materials and inventory move through the value stream. They help identify waiting time, excess inventory, and whether materials are pushed or pulled between processes.
| Symbol | Name | Meaning |
|---|---|---|
| Inventory | Represents inventory or work-in-progress between processes | |
| Shipment | Shows the movement of raw materials from suppliers and finished goods to customers | |
| Push arrow | Indicates materials being pushed from one process to the next | |
| Supermarket | Represents a Kanban stock point where downstream processes pull inventory | |
| Material pull | Used when materials are pulled from a supermarket to a downstream process | |
| FIFO lane | Represents a First-In-First-Out system with a defined maximum inventory limit | |
| Safety stock | Indicates buffer inventory used to protect against disruptions | |
| External shipment | Represents shipments of materials to or from suppliers or customers |
Value Stream Mapping Information Symbols
Information symbols show how instructions, signals, and communication flow through the value stream. They clarify how production is triggered, scheduled, and controlled.
| Symbol | Name | Meaning |
|---|---|---|
| Production Control | Represents a central production scheduling or control function | |
| Manual Information | Shows information flow via memos, reports, or manual communication | |
| Electronic Information | Represents digital information flow such as internet, LAN, or ERP systems | |
| Production Kanban | Indicates the quantity to be produced based on customer pull | |
| Withdrawal Kanban | Instructs movement of parts from a supermarket to a process | |
| Signal Kanban | Signals when inventory levels are low and replenishment is required | |
| Kanban post | Represents the location where Kanban signals are collected | |
| Sequenced pull icon | Represents a pull system that eliminates the need for a supermarket | |
| Load leveling | Used to batch Kanbans and level production volume | |
| MRP/ ERP | Indicates scheduling and planning via MRP or ERP systems | |
| Go see | Represents direct observation used to gather information | |
| Verbal information | Indicates the flow of verbal or person-to-person information |
Value Stream Mapping General Symbols
General symbols are used to add context, timing, people, and improvement cues to a value stream map. They help teams understand delays, communication methods, movement, and where improvements are needed beyond the core process and material flow.
| Symbol | Name | Meaning |
|---|---|---|
| Kaizen burst | Highlights problem areas or opportunities for improvement in the value stream | |
| Operator | Represents the need for an operator or person at a specific location in the process | |
| Other information | Indicates additional information that may be useful for understanding the process | |
| Timeline | Shows processing time and waiting time, helping calculate lead time and total cycle time | |
| Transportation | Represents the movement of materials via trucks, ships, trains, or airplanes | |
| Warehouse | Indicates internal or external storage locations for inventory | |
| Cross-Dock | Represents direct transfer of materials from inbound to outbound without storage | |
| Phone | Indicates communication via phone or phone-based orders | |
| Batched Kanban | Represents Kanban signals or cards that are sent or received in batches |
Tips for Using Value Stream Mapping Symbols
Value stream icons make it easier to turn complex workflows into clear, actionable visuals, but using them effectively is just as important as choosing the right ones. Below are some practical tips to help you use value stream mapping symbols clearly, consistently, and with purpose.
Stay consistent with symbols: Use standard value stream icons throughout the map to avoid confusion and make the flow easy to follow.
Start with the current state: Map how the process actually works today before jumping into improvements or future-state designs.
Keep data boxes clear and relevant: Only include metrics that matter, such as cycle time, lead time, or inventory levels, to avoid visual clutter.
Highlight delays and bottlenecks clearly: Use inventory, timeline, and kaizen burst symbols to draw attention to waiting time and problem areas.
Separate material and information flows: Make it easy to distinguish how work moves versus how instructions or signals flow.
Don’t overcomplicate the map: If the map becomes hard to read, simplify it—clarity is more valuable than completeness.
Use symbols to drive discussion, not decoration: Every icon should support analysis, improvement, or decision-making.
Create, customize, and collaborate on value stream maps using Creately’s value stream mapping software. With a ready-made symbol library, drag-and-drop editing, and real-time collaboration, you can map current and future states faster, and turn insights into action without starting from scratch.
FAQs about Using Symbols of Value Stream Mapping
Are value stream mapping symbols standardized?
Can value stream mapping symbols be used outside manufacturing?
Can I create both current-state and future-state maps using the same symbols?
Resources
Haefner, Benjamin, et al. “Quality Value Stream Mapping.” Procedia CIRP, vol. 17, 2014, pp. 254–259, https://doi.org/10.1016/j.procir.2014.01.093.
Vamsi Krishna Jasti, Naga, and Aditya Sharma. “Lean Manufacturing Implementation Using Value Stream Mapping as a Tool.” International Journal of Lean Six Sigma, vol. 5, no. 1, 25 Feb. 2014, pp. 89–116, https://doi.org/10.1108/ijlss-04-2012-0002.