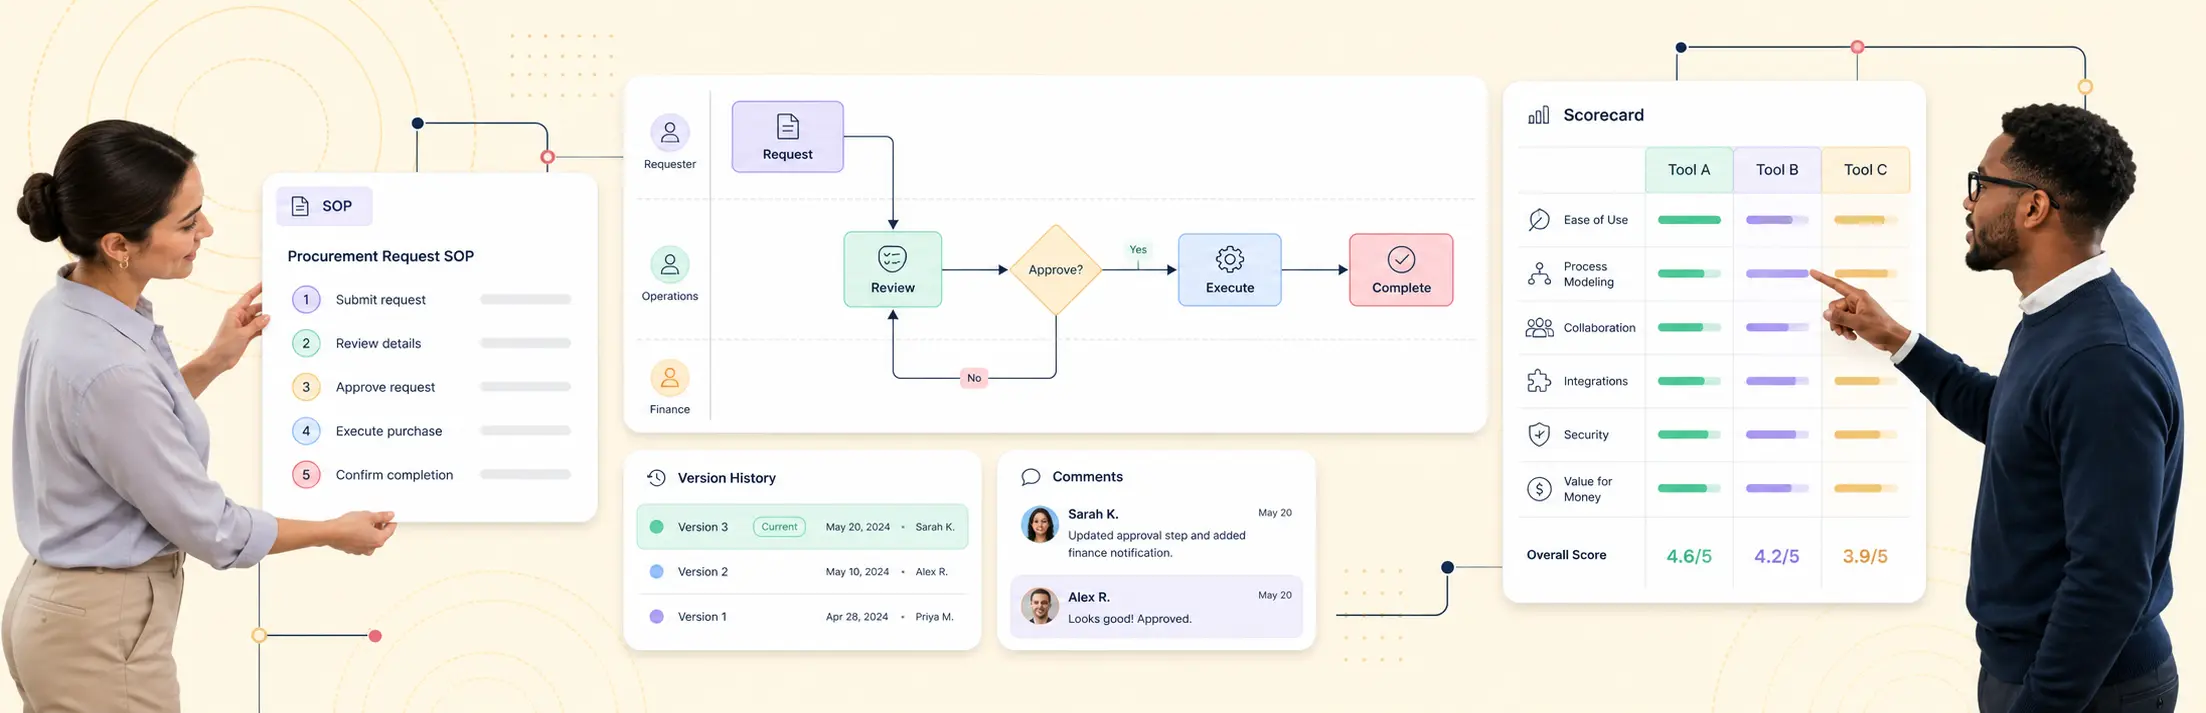
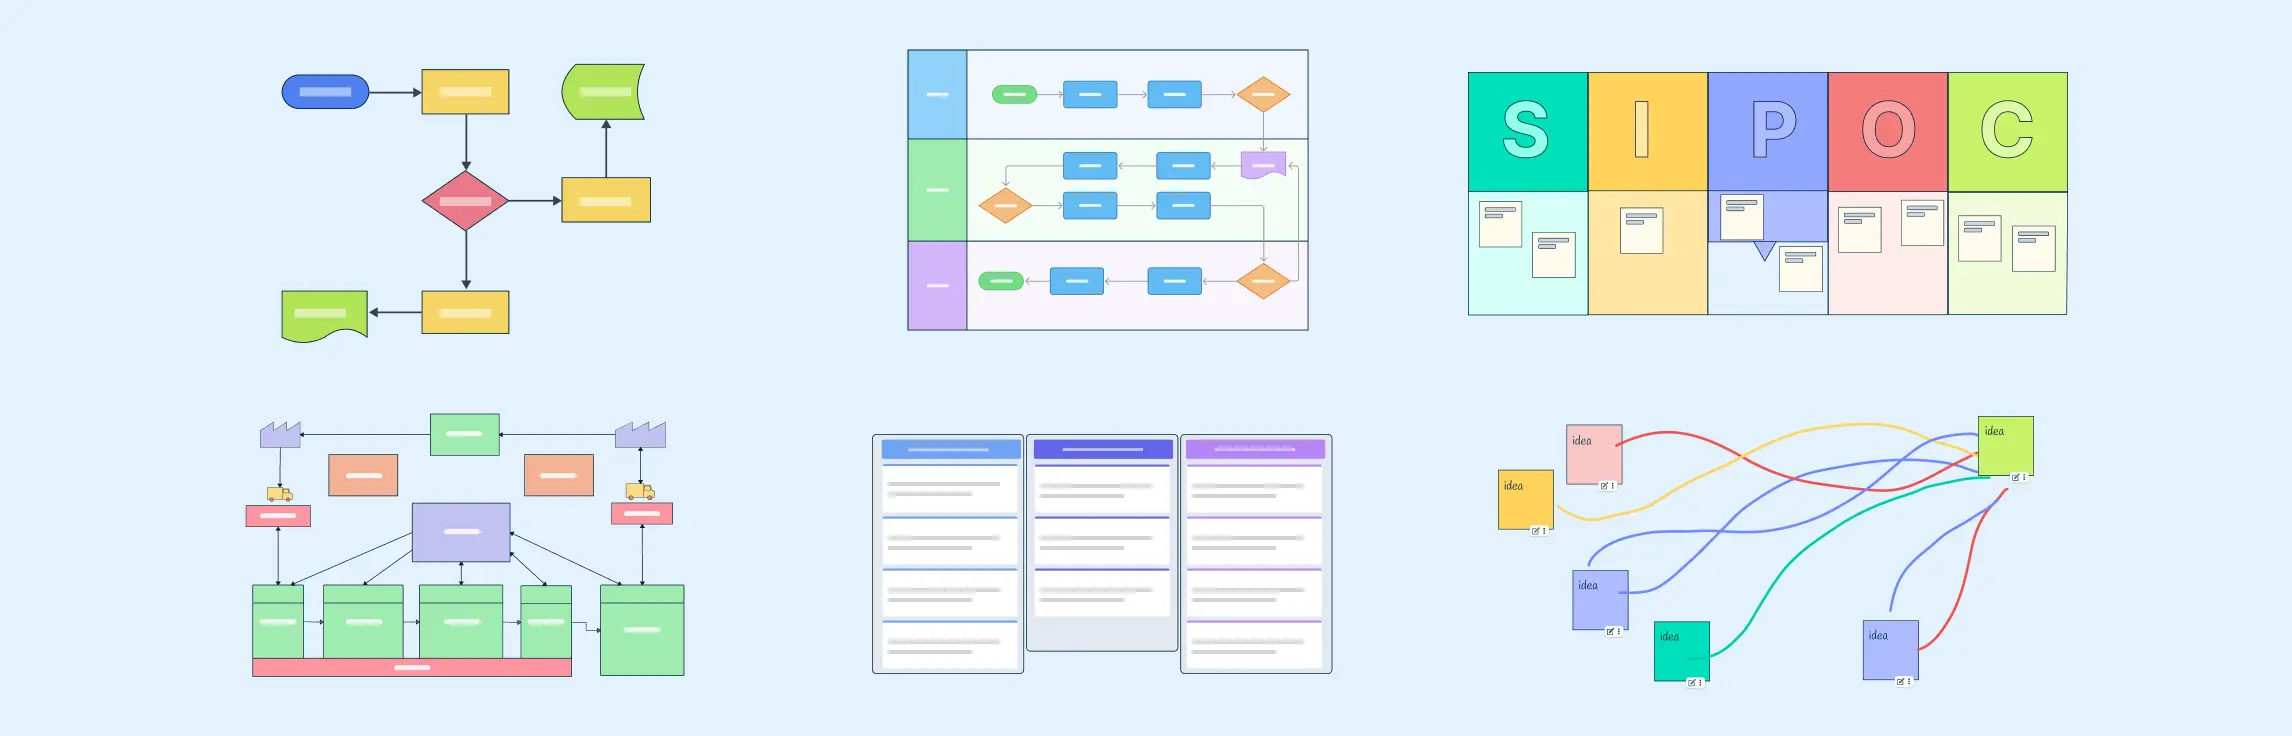
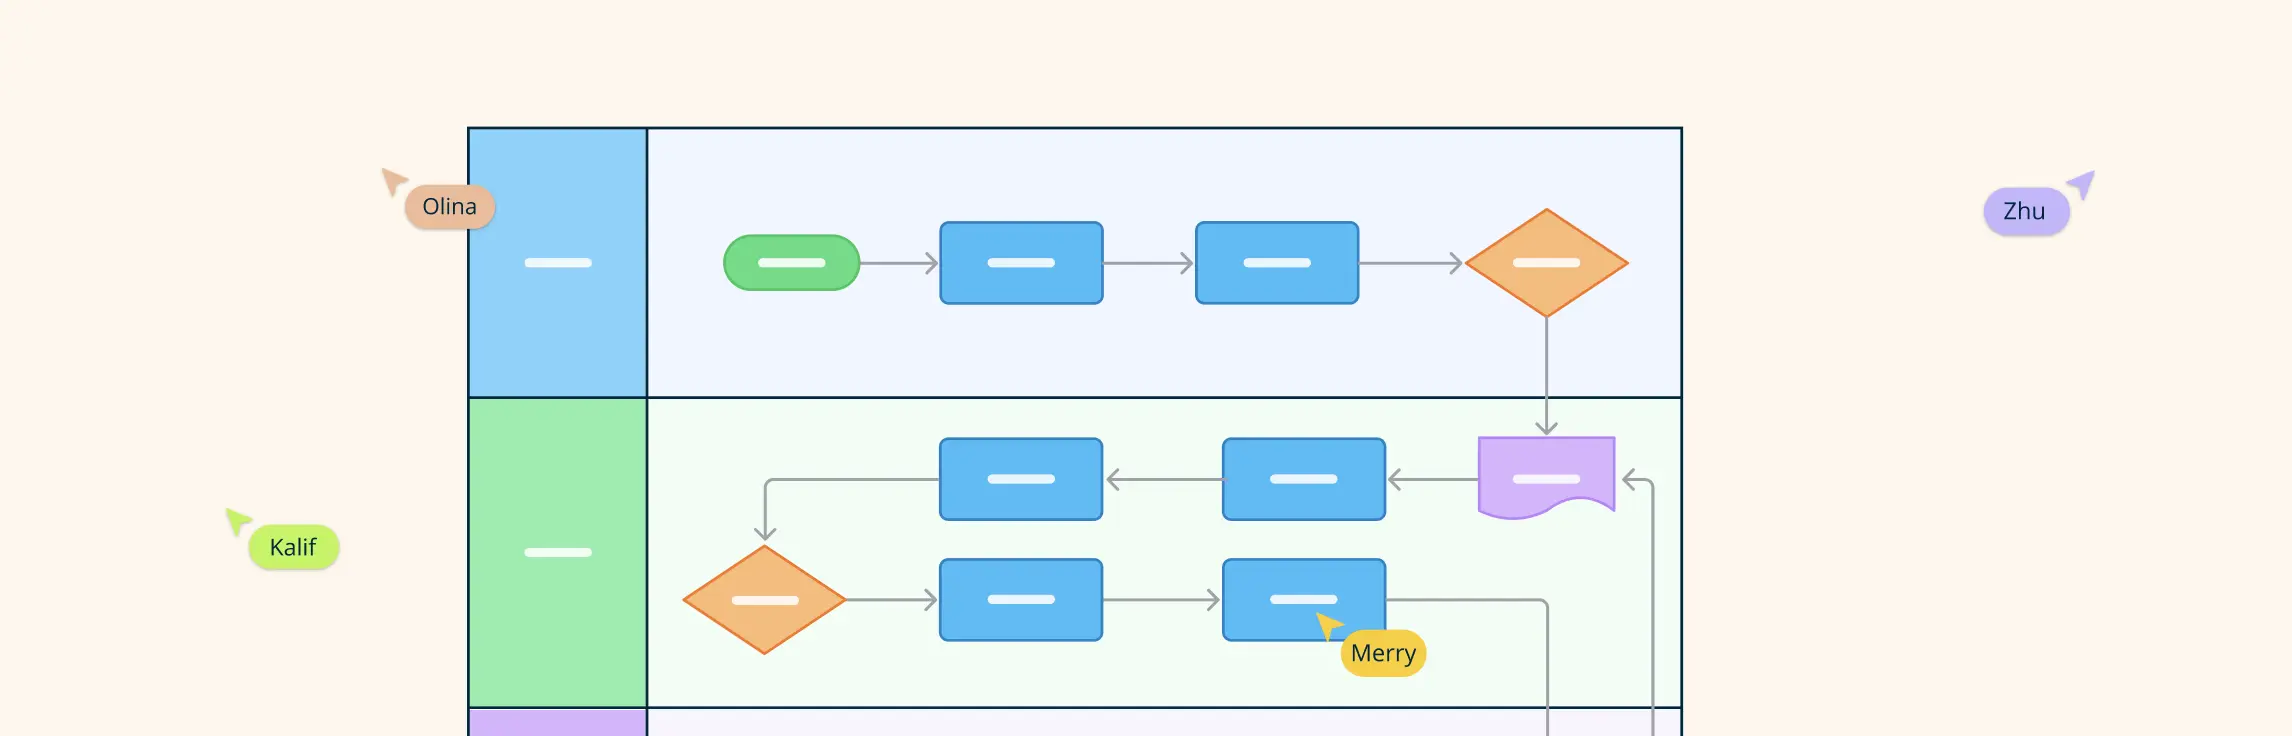
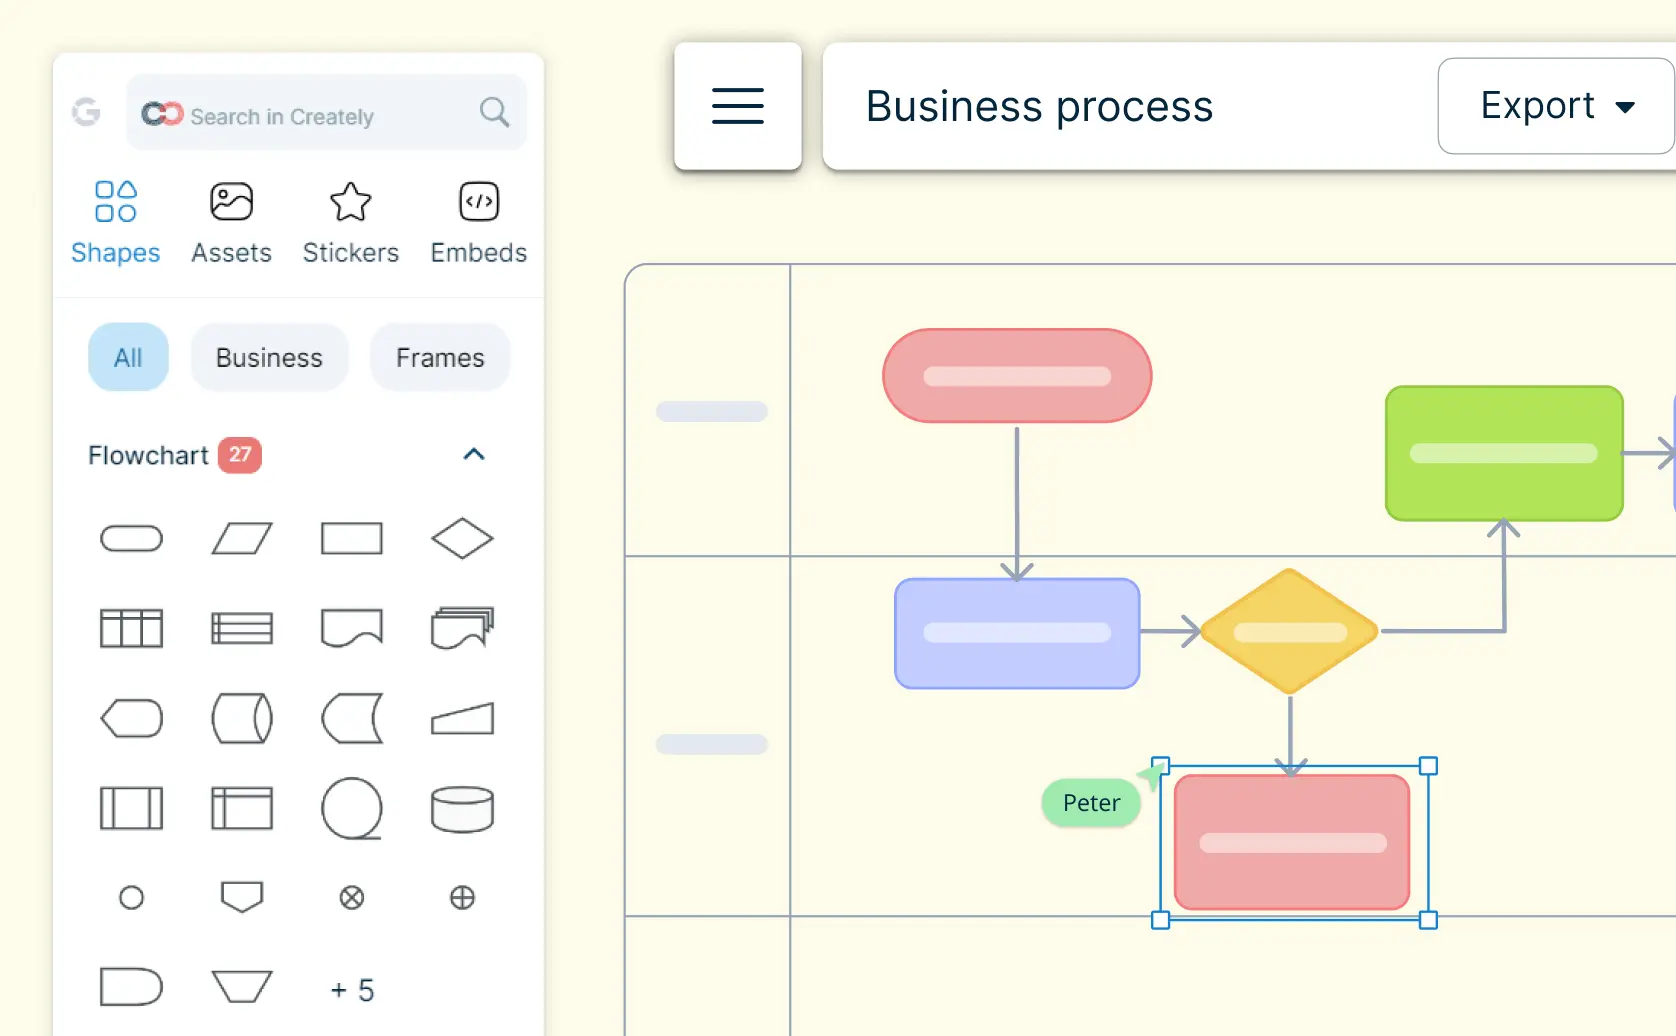
If you need a short answer, use a screen-capture tool when speed matters most, use a wiki-first tool when your main job is publishing procedural knowledge, and use a process-modeling platform when you need documentation that stays governed, visual, and current across teams. For most ops and process owners, the right choice depends less on template count and more on whether the tool can handle ownership, change control, and cross-functional process logic without turning your documentation into another stale folder of files.
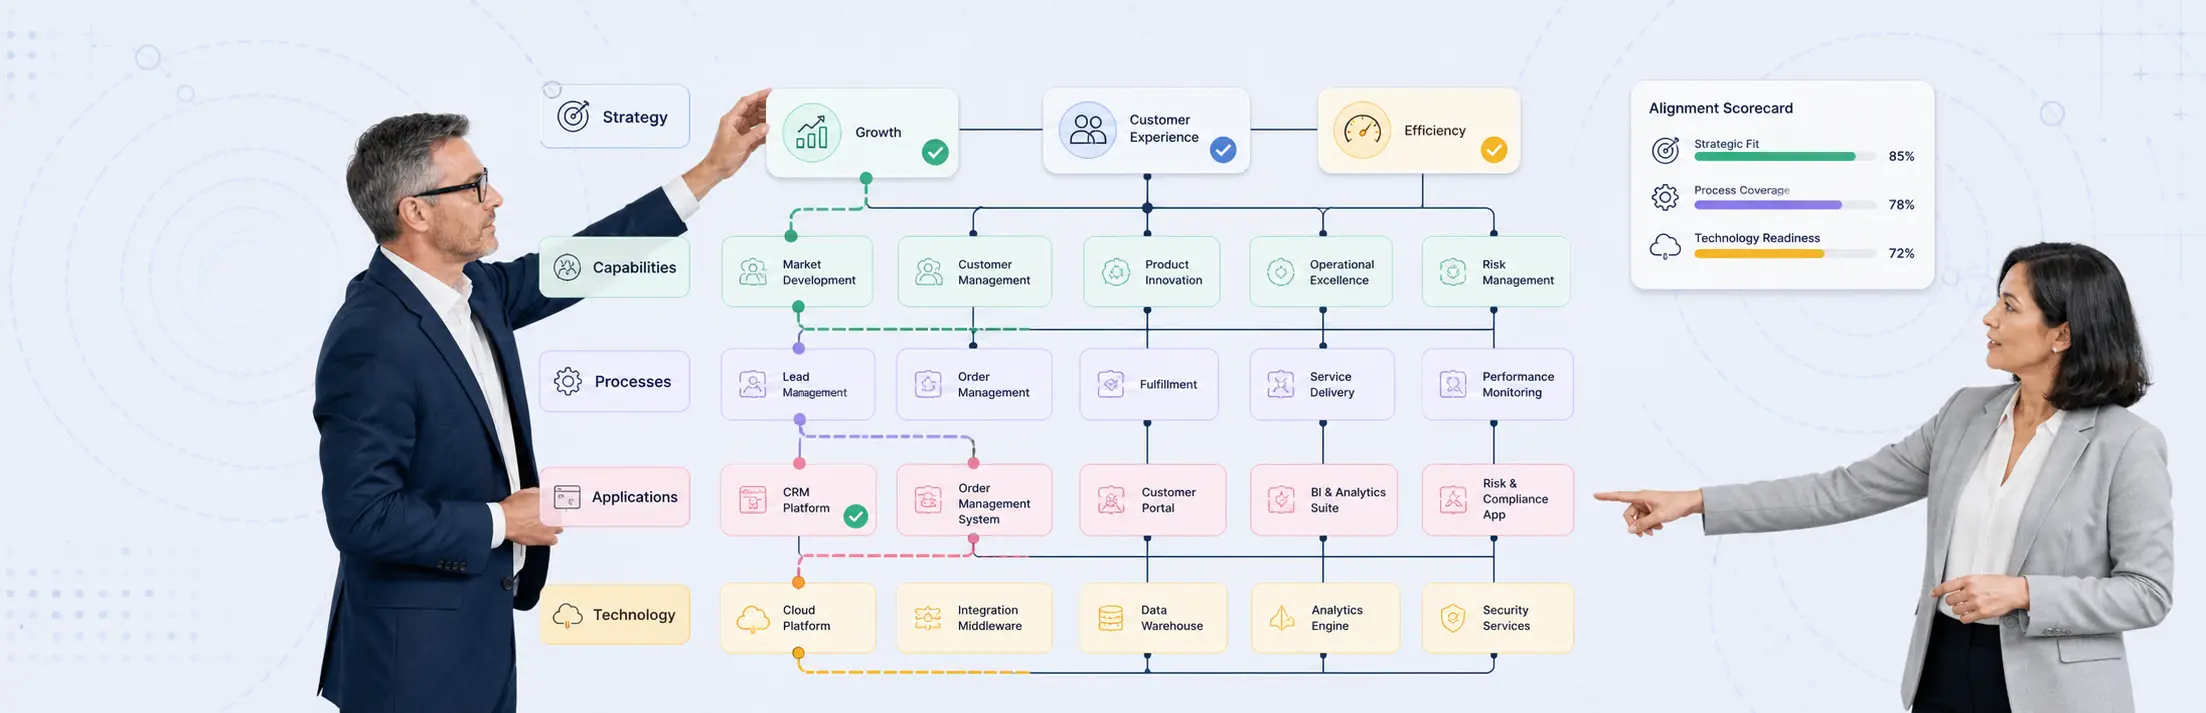
The right EA and strategy-alignment tool is the one that supports your next decision without creating more repository work than your team can sustain. Use a collaborative visual tool when the job is alignment, scenario comparison, and executive communication. Choose a traditional enterprise architecture suite when you need governed metamodels, portfolio analytics, lifecycle controls, and formal traceability across a large technology estate.
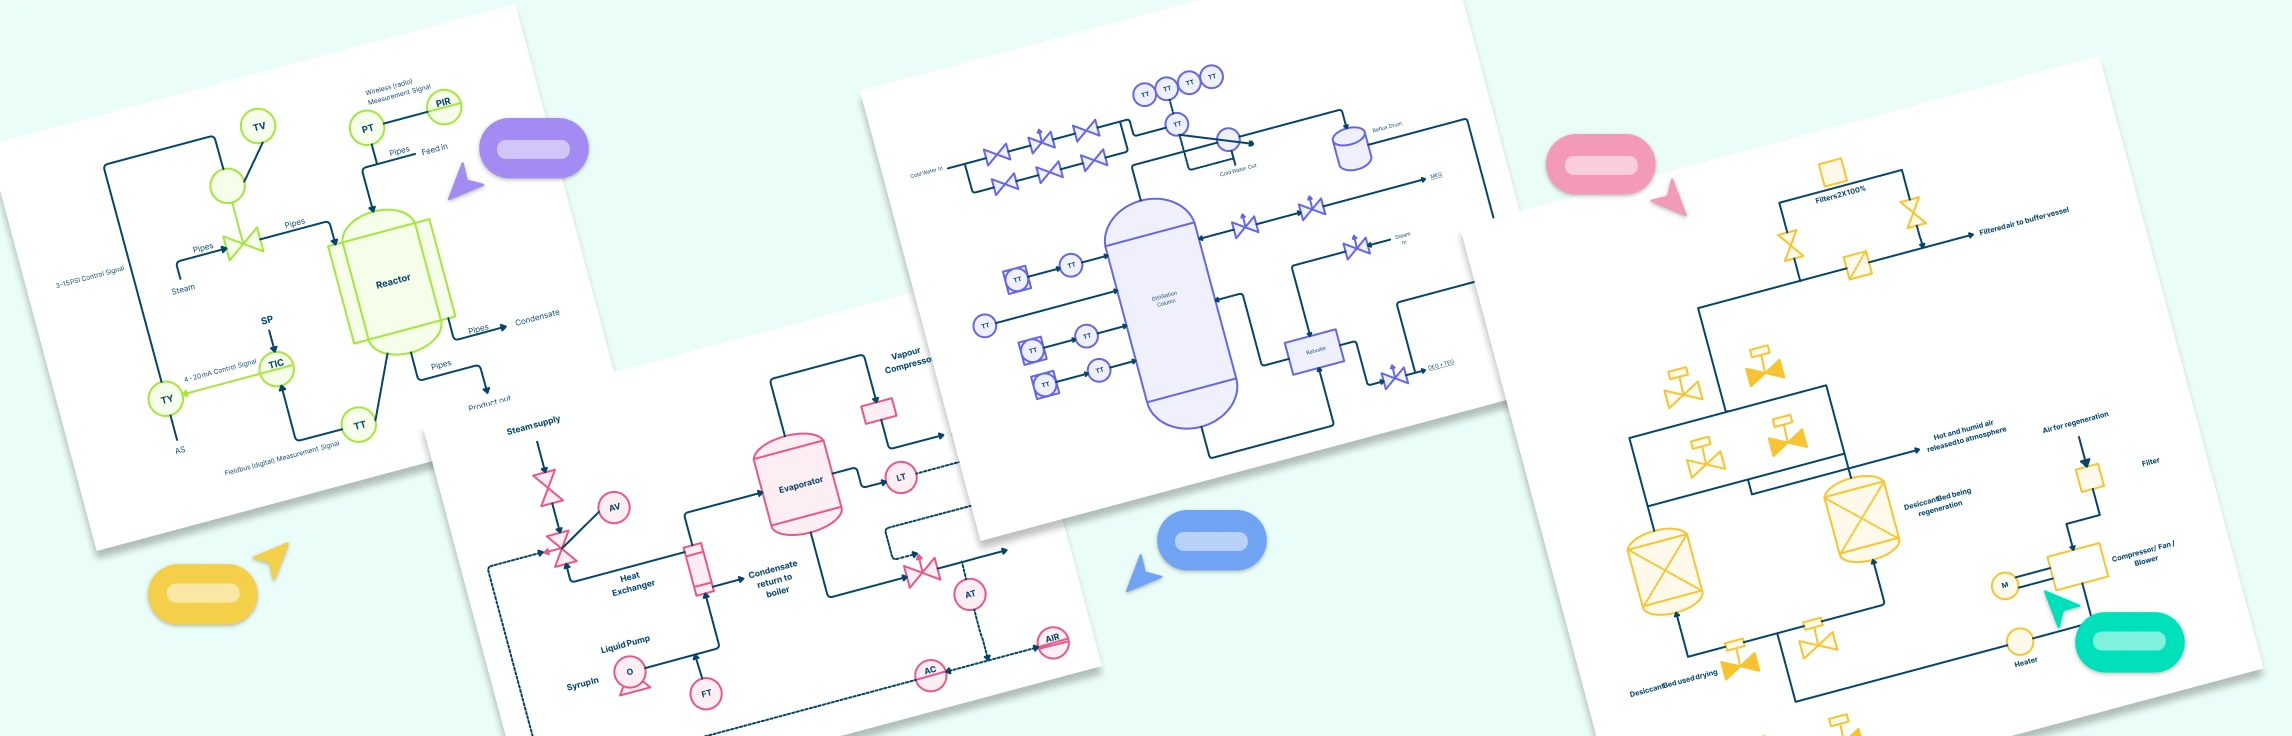
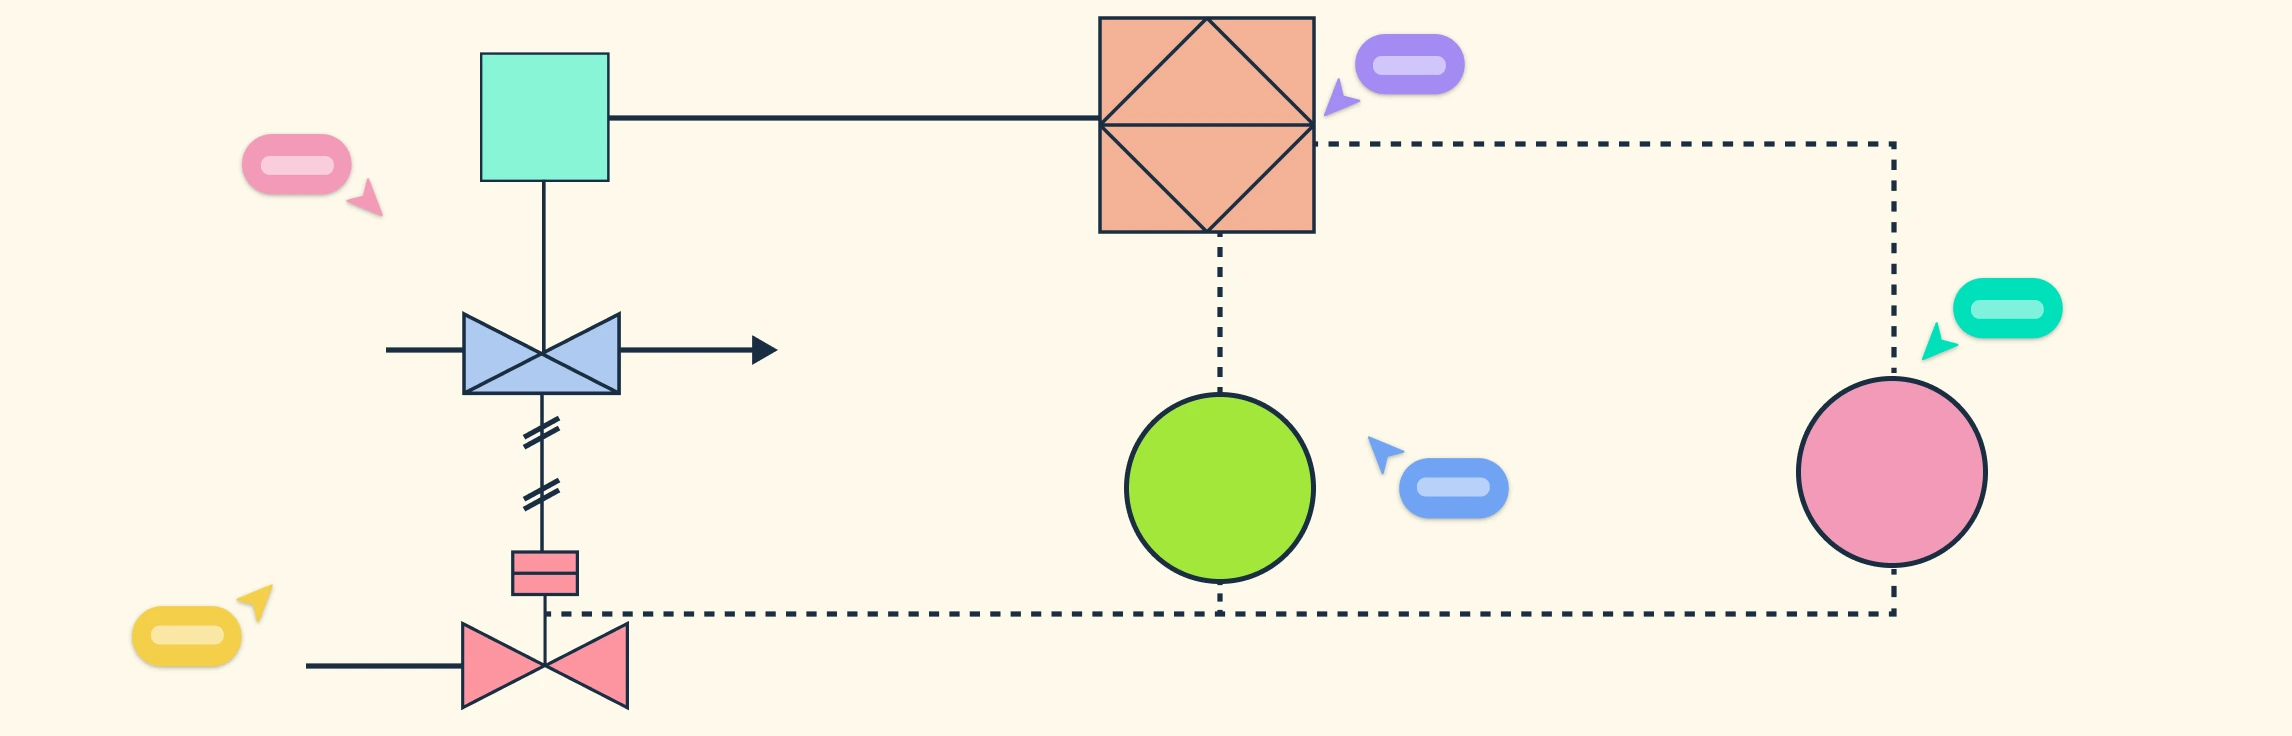
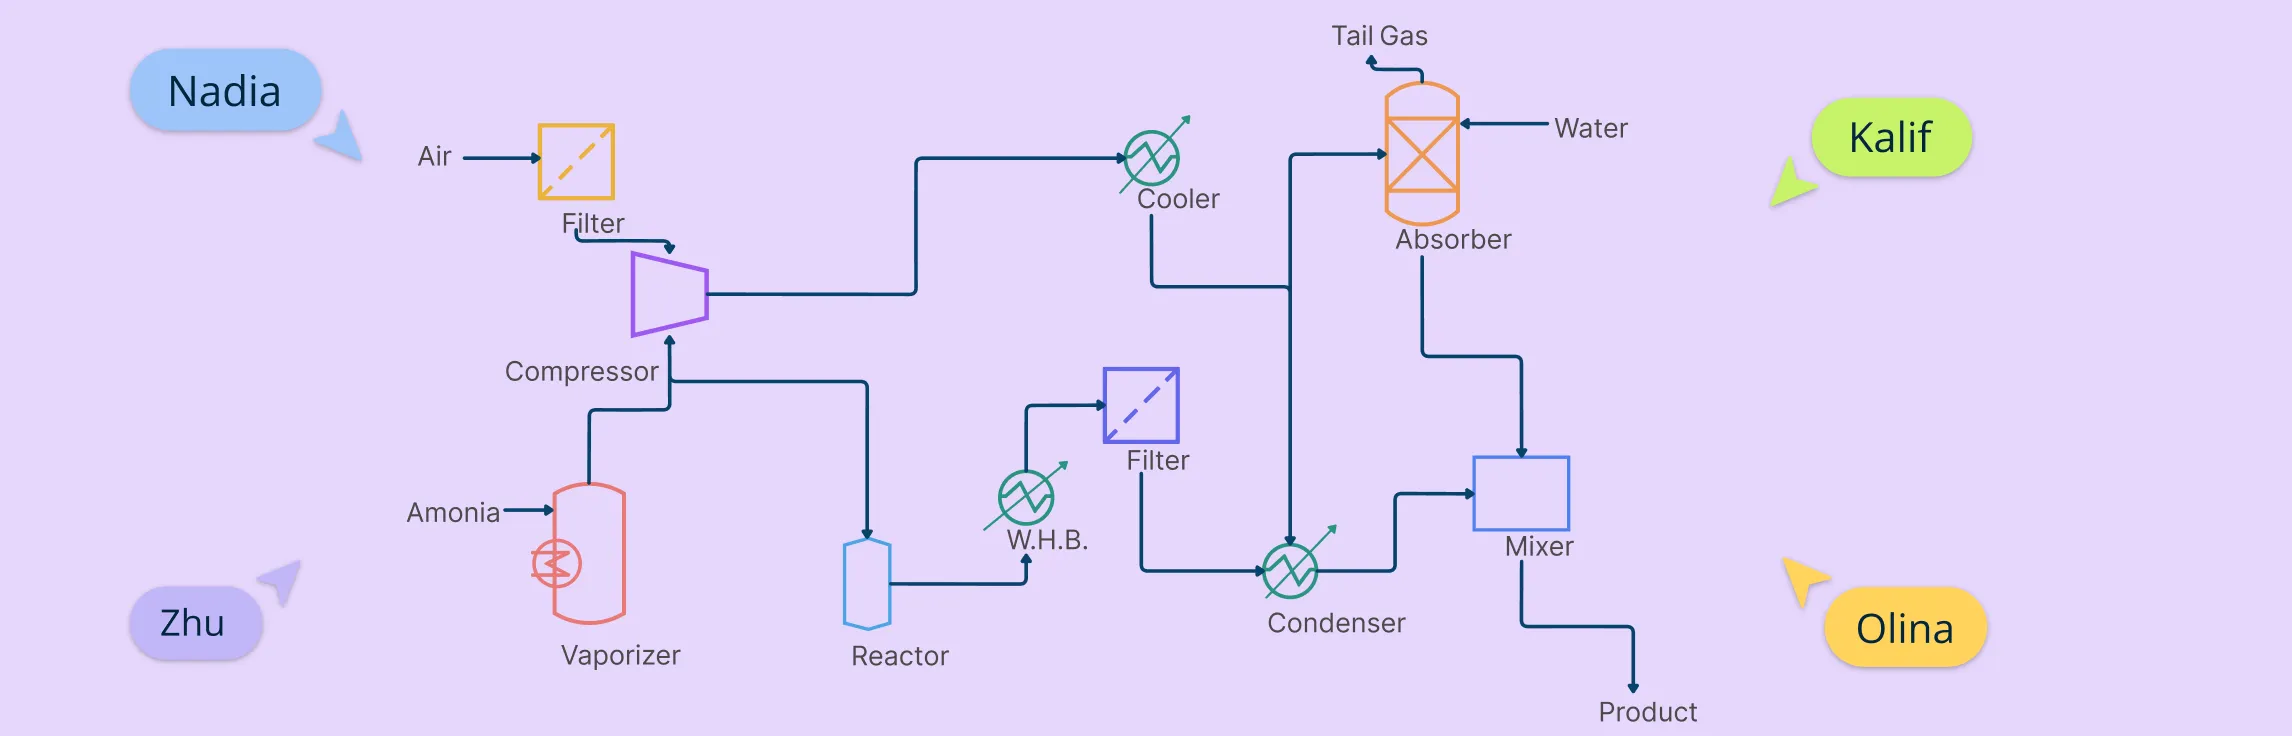
Piping and Instrumentation Diagrams (P&IDs) are essential tools in process engineering, helping professionals visualize systems, monitor controls, and optimize workflows. Whether you’re designing a chemical reactor, managing a heat exchanger, or planning large-scale production processes, having clear and accurate P&ID examples can save time and reduce errors.
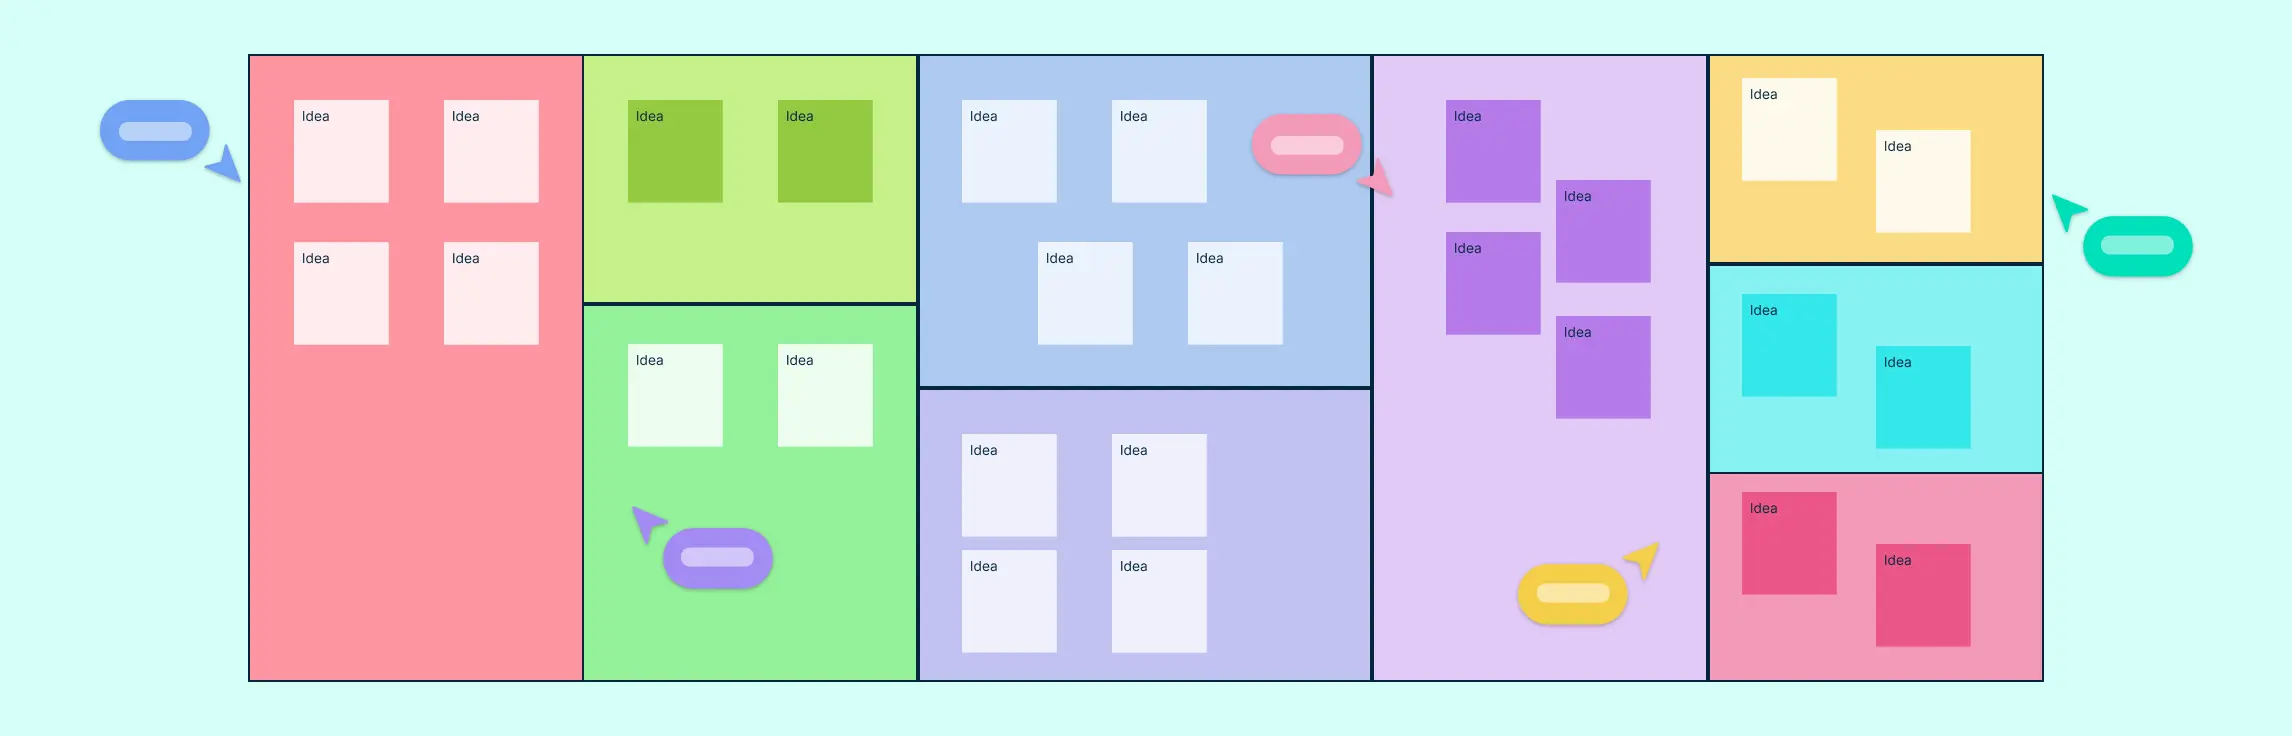
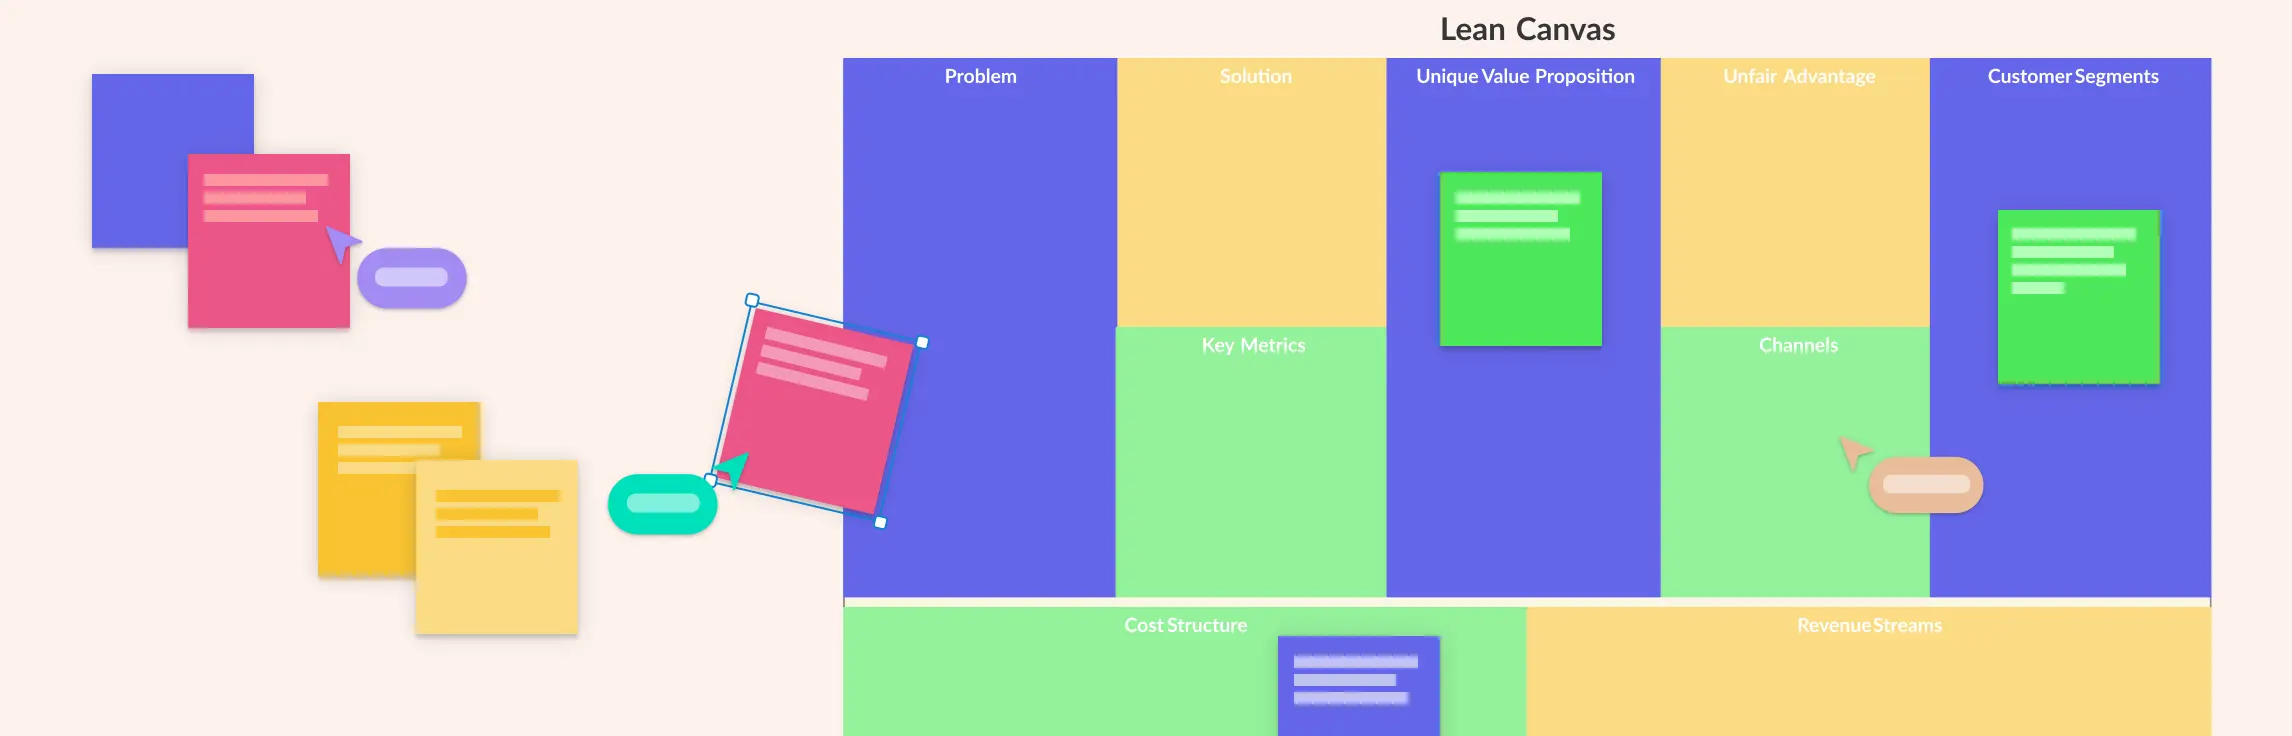
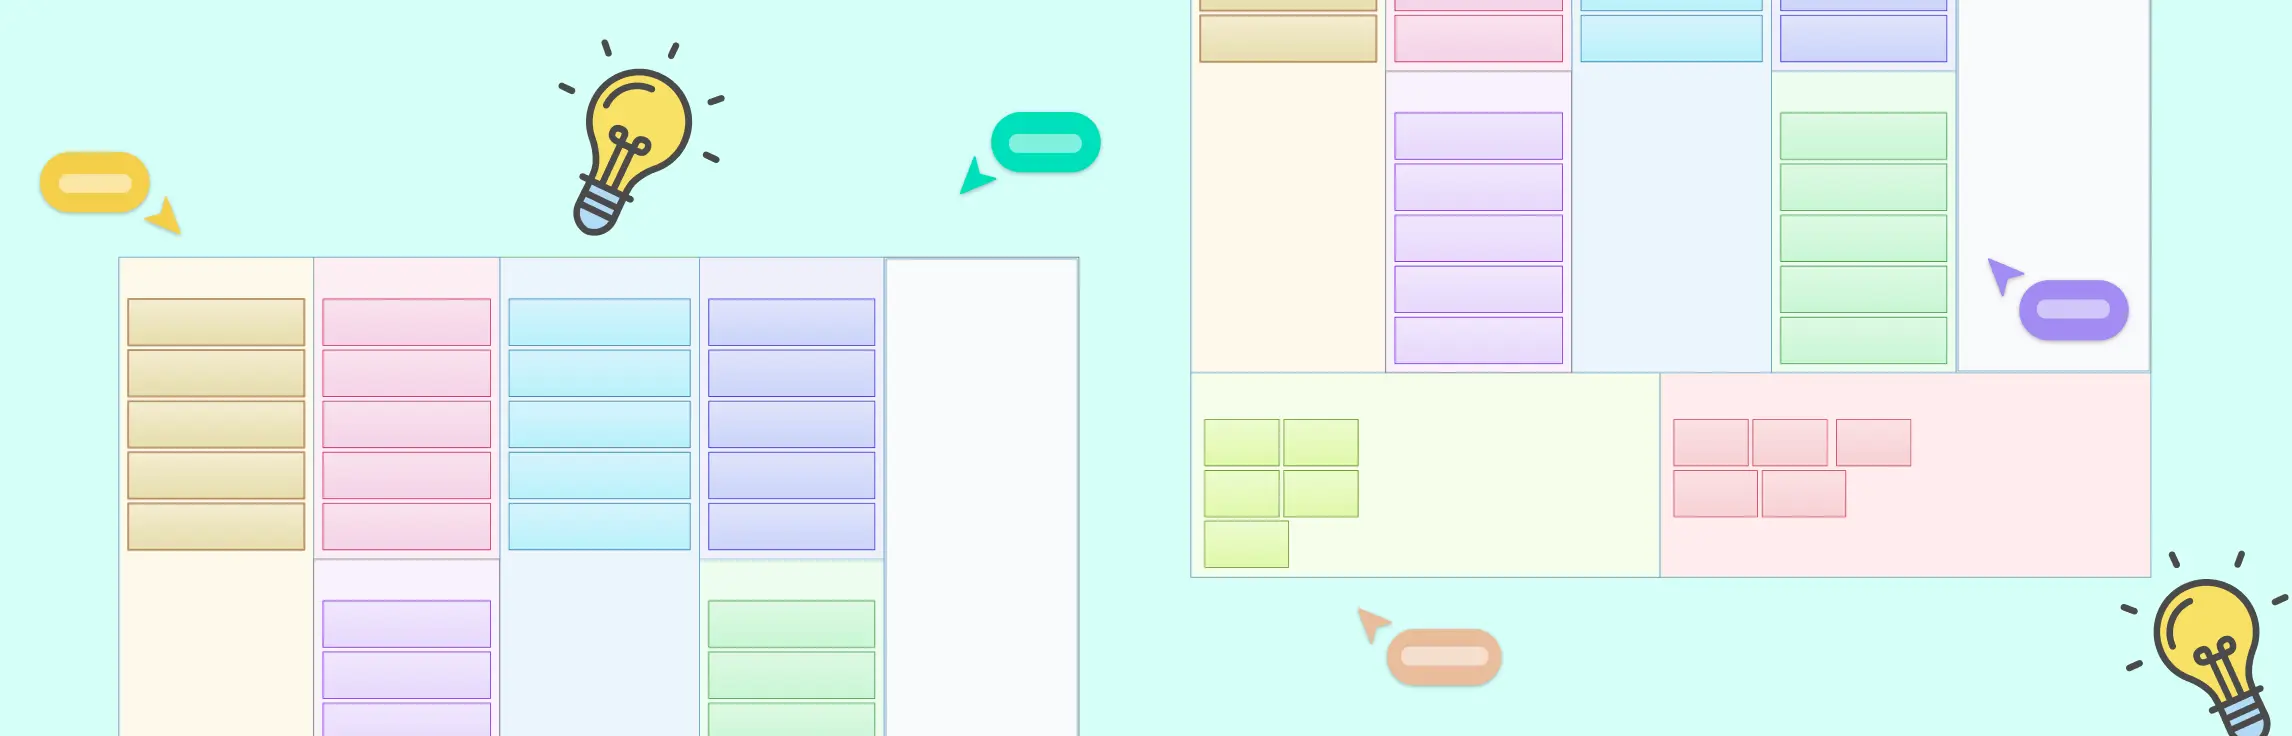
Starting a business is exciting, but turning an idea into a working business model can feel overwhelming. That’s where the Lean Canvas comes in—a simple, one-page tool that helps you map out your idea, identify key problems, and plan how to deliver value to your customers. In this guide, we’ll walk you through real-world Lean Canvas examples from successful startups, showing you exactly how to structure your own canvas.
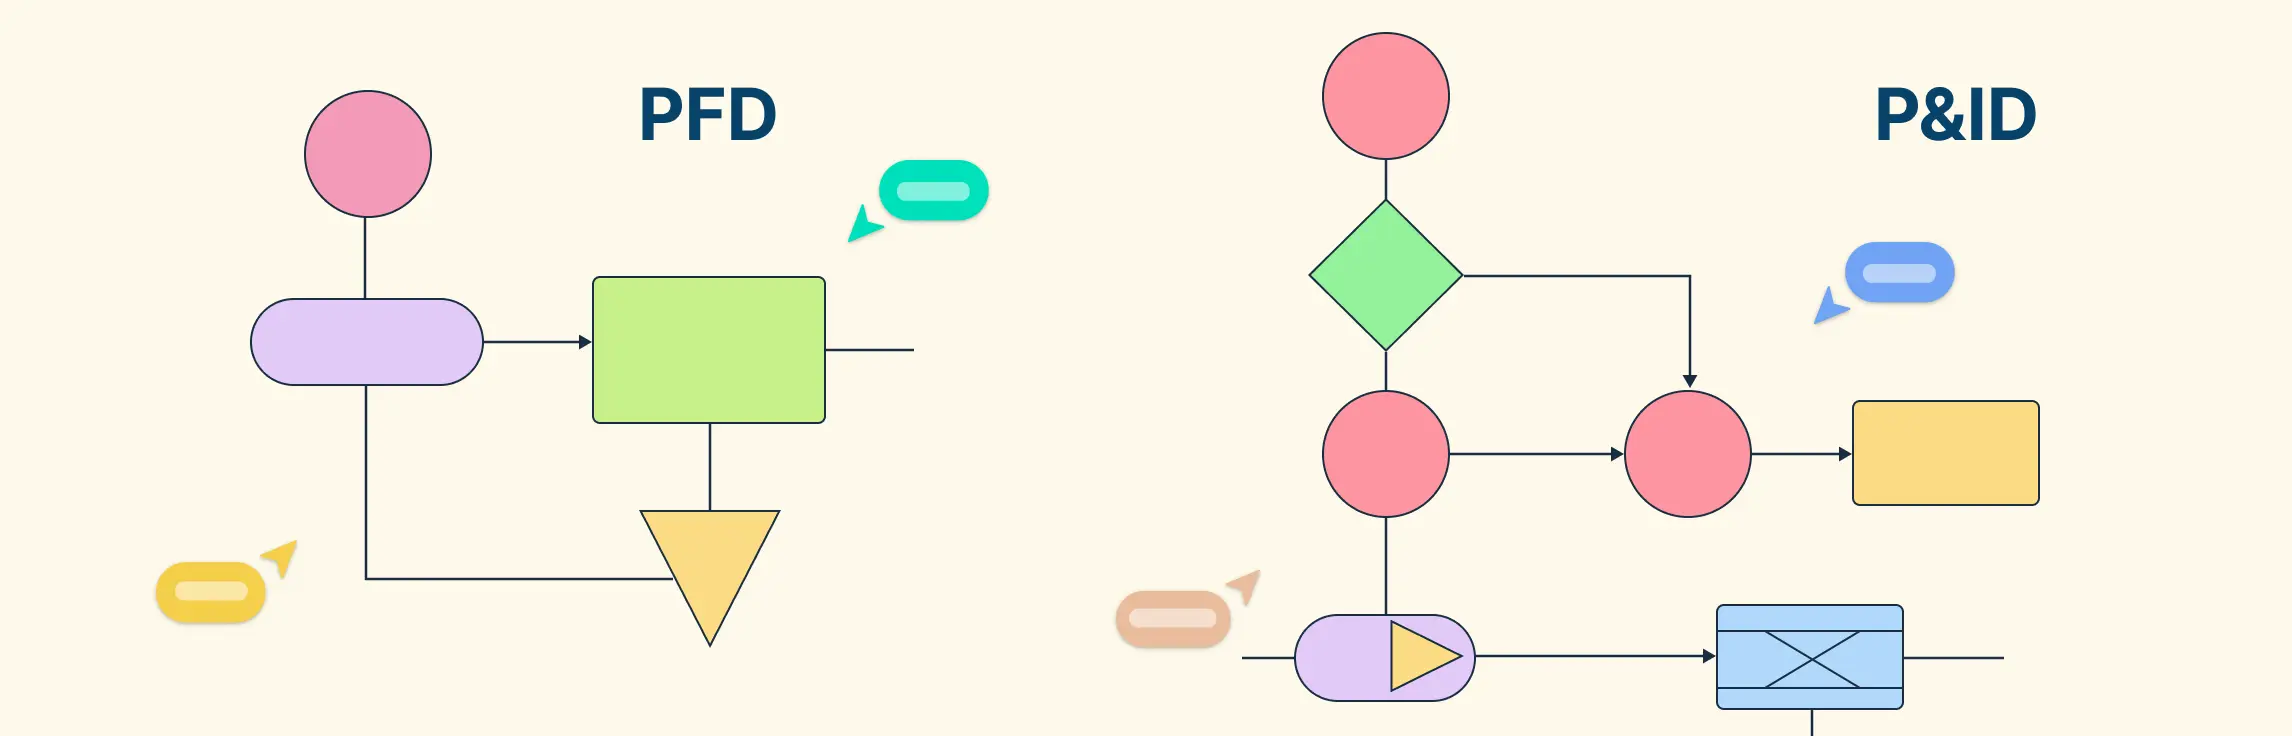
In industries like chemical, mechanical, and process engineering, diagrams help teams plan, design, and run complex systems. Two key diagrams are the process flow diagram and the piping and instrumentation diagram ( PFD and P&ID).
In this guide, we’ll explain why it’s important to understand piping and instrumentation diagrams, break down how to interpret lines, labels, and tags, and walk you through a step-by-step method for how to read piping and instrumentation diagrams. This also covers common notations, abbreviations, and best practices to help you confidently analyze and work with these critical technical documents.
Understanding Piping and Instrumentation Diagram (P&ID) symbols is essential for anyone involved in process design, engineering, or plant operations. These standardized symbols form the visual language of process systems, allowing engineers to design, communicate, and maintain complex industrial setups accurately. In this guide, we’ll break down the different types of P and ID symbols, the international standards that define them, and the best practices to follow when creating or reading P&ID diagrams.
Understanding what is a Piping and Instrumentation Diagram (P&IDs), is essential for anyone involved in process design, engineering, or plant operations. These diagrams serve as the foundation for building, analyzing, and maintaining complex systems safely and efficiently. In this guide, we’ll explore what is P and ID, their purpose, key components and real-world engineering applications.
In this guide, we’ll explain what a block flow diagram is, its purpose in process design, the key components that make it effective, and how to create one. You’ll also learn how it compares to more detailed diagrams like process flow diagrams, along with its benefits, limitations, and practical uses in engineering workflows.
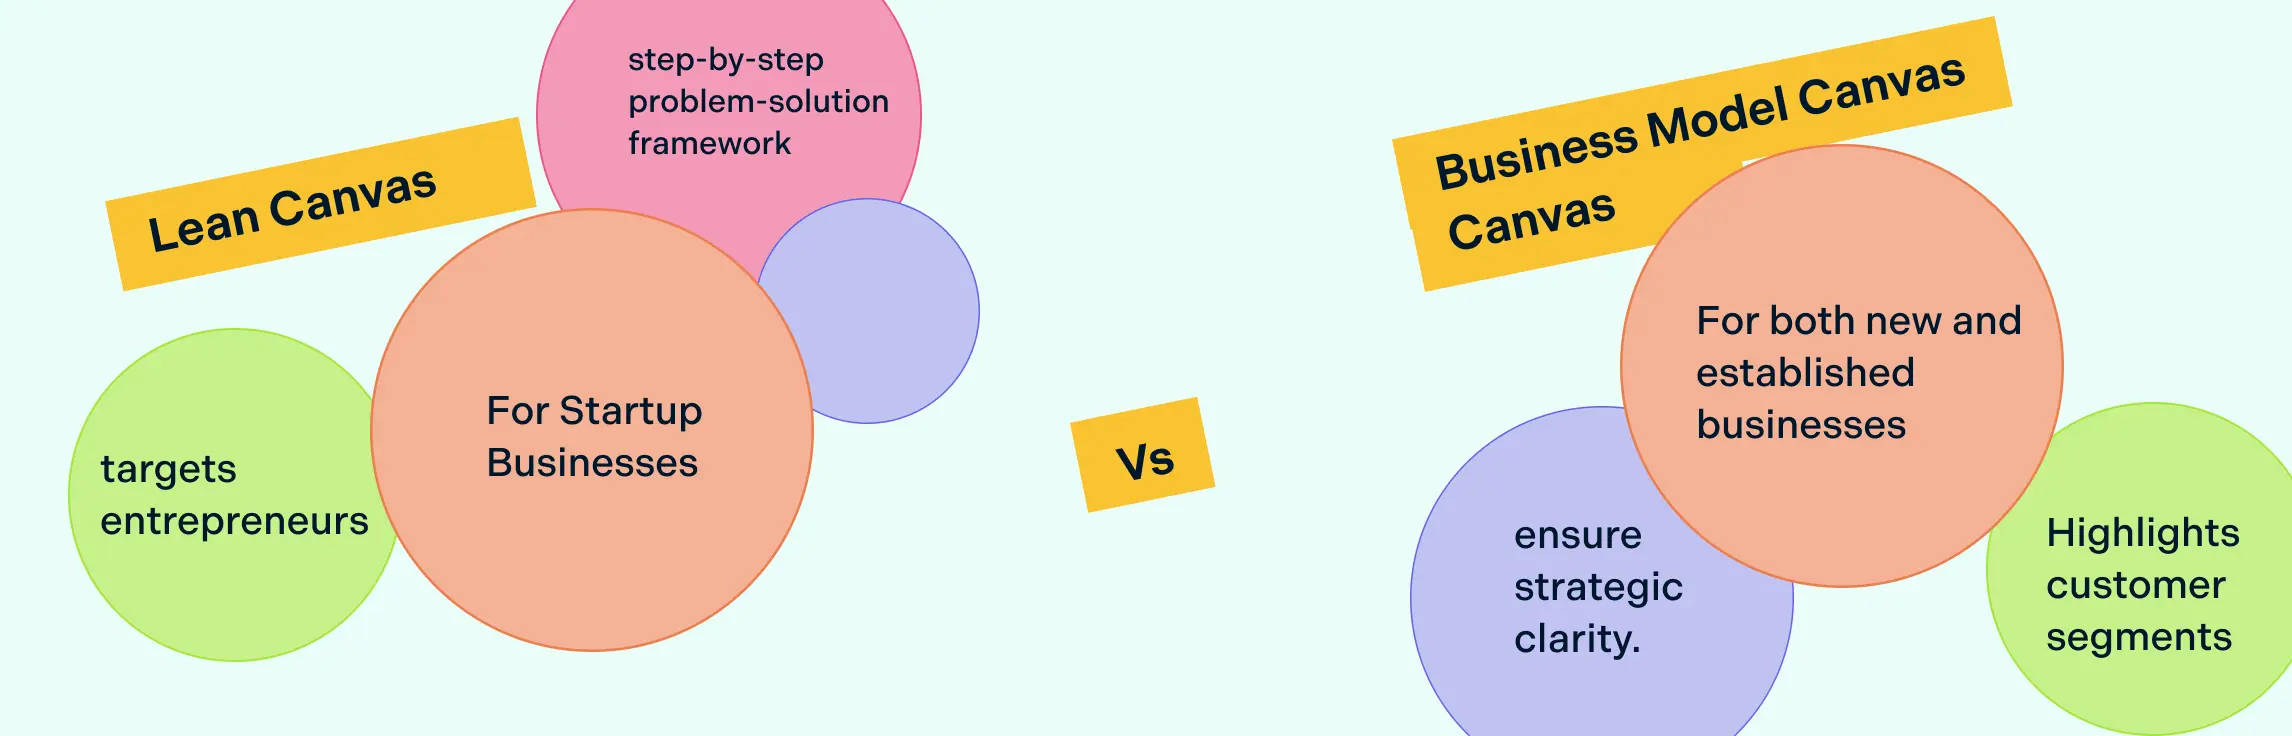
Building a business idea doesn’t have to start with a long, complicated plan. Single-page canvases like the Lean Canvas and the Business Model Canvas help you quickly map out how your idea creates value and works as a business. In this guide, you’ll learn what makes each canvas unique, when to use them, and how to choose the right one for your stage. We’ll also look at lean canvas vs. business model canvas examples and ready-to-use templates to help you put your ideas into action fast.
Starting a business can feel overwhelming, with countless decisions to make and uncertainties to navigate. The Lean Business Model Canvas helps entrepreneurs focus on what truly matters—understanding customers, testing ideas quickly, and iterating on solutions without wasting time or resources. In this guide, we’ll walk you through a practical approach to using the canvas effectively, offering tips, examples, and strategies to turn your ideas into actionable plans.
In today’s fast-paced business environment, aligning strategy with execution is more critical than ever. Business architecture modelling provides a clear, structured view of an organization’s capabilities, processes, information flows, and stakeholders, helping leaders make informed decisions and drive operational excellence. Whether you’re a startup, an enterprise, or a growing e-commerce business, understanding and visualizing your business architecture can unlock clarity, efficiency, and strategic alignment, turning complex operations into actionable insights.
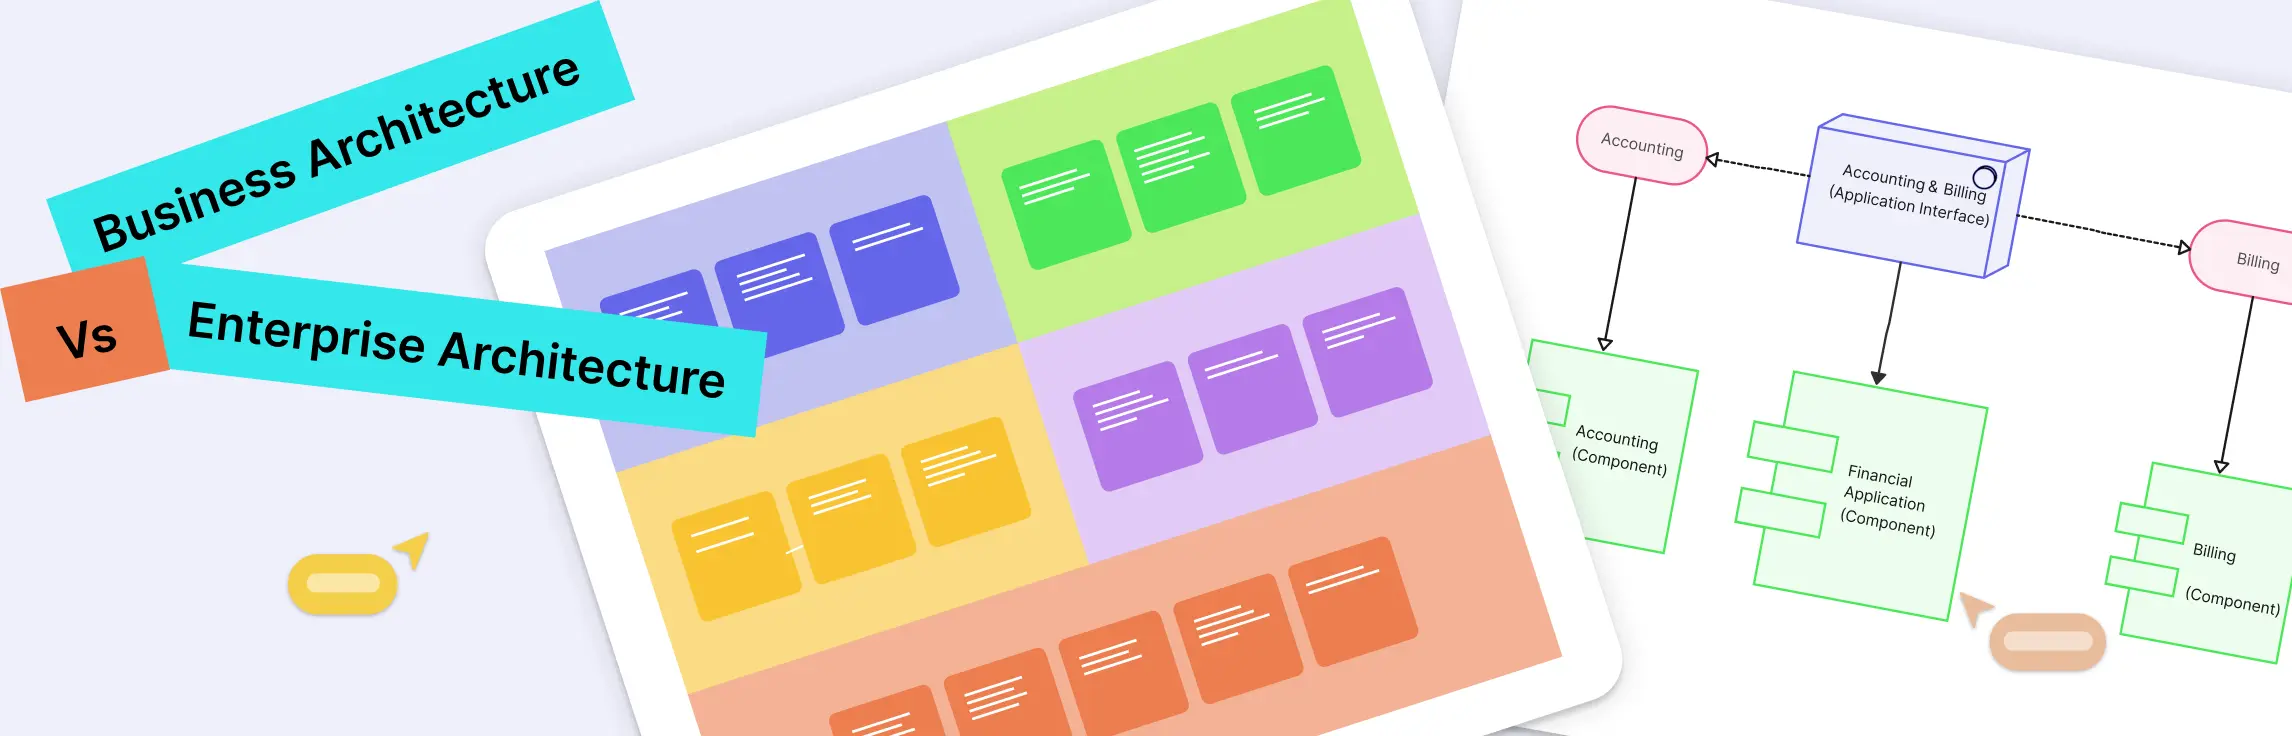
Business architecture maps what the business needs to do through capabilities, value streams, and operating context. Enterprise architecture coordinates business, data, application, and technology architectures to guide enterprise-wide change. Use business architecture when the main job is strategic alignment and capability design; use enterprise architecture when the main job is coordinating business and technology change across the organization.
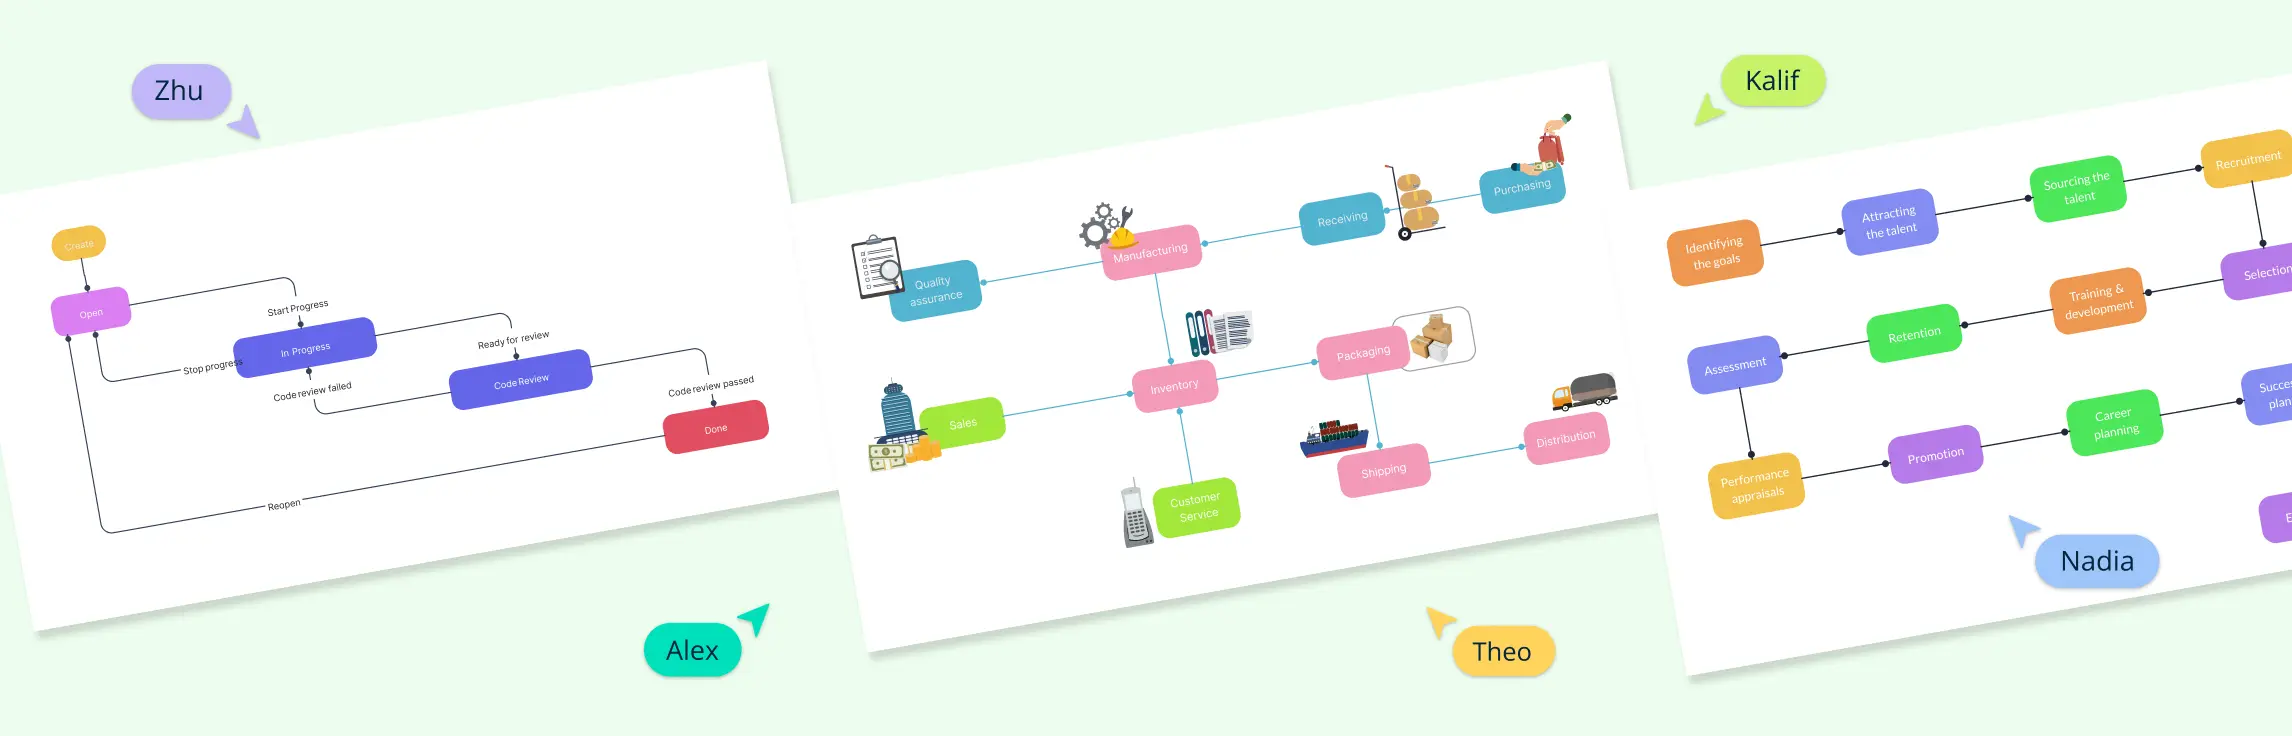
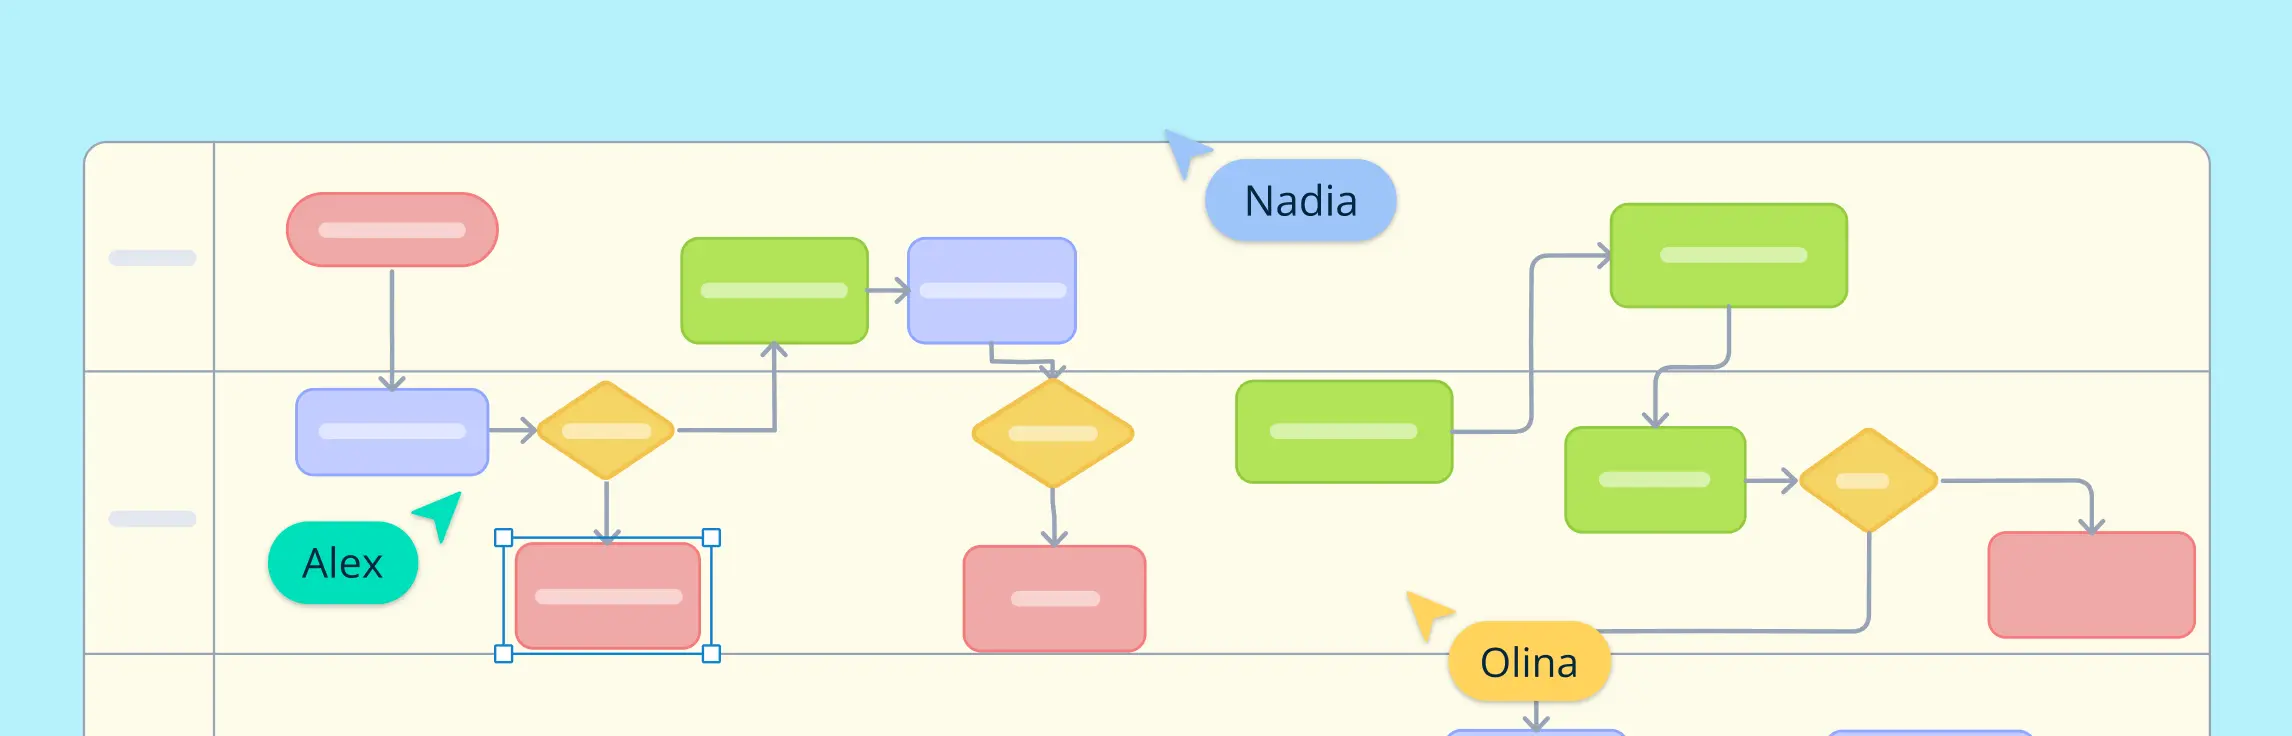
Workflow diagrams make it easier to see how work gets done, who owns each step, and where delays or handoff issues appear. Whether you are managing a project, standardizing an operation, or improving a recurring process, a clear workflow diagram helps teams work from the same operating view instead of disconnected notes and assumptions. In this guide, we will walk through practical workflow diagram examples across different functions so you can adapt them to your own processes and improve how work moves across your team.
In this guide, we’ll explain what workflow mapping is, why it matters, and how to create one step by step, with examples and templates you can use to streamline processes like onboarding, content publishing, or purchase approvals.
Ever feel like your organization’s strategy lives in one place, but execution happens somewhere completely different? Misaligned goals, unclear responsibilities, and disconnected processes can turn even the best strategies into missed opportunities.
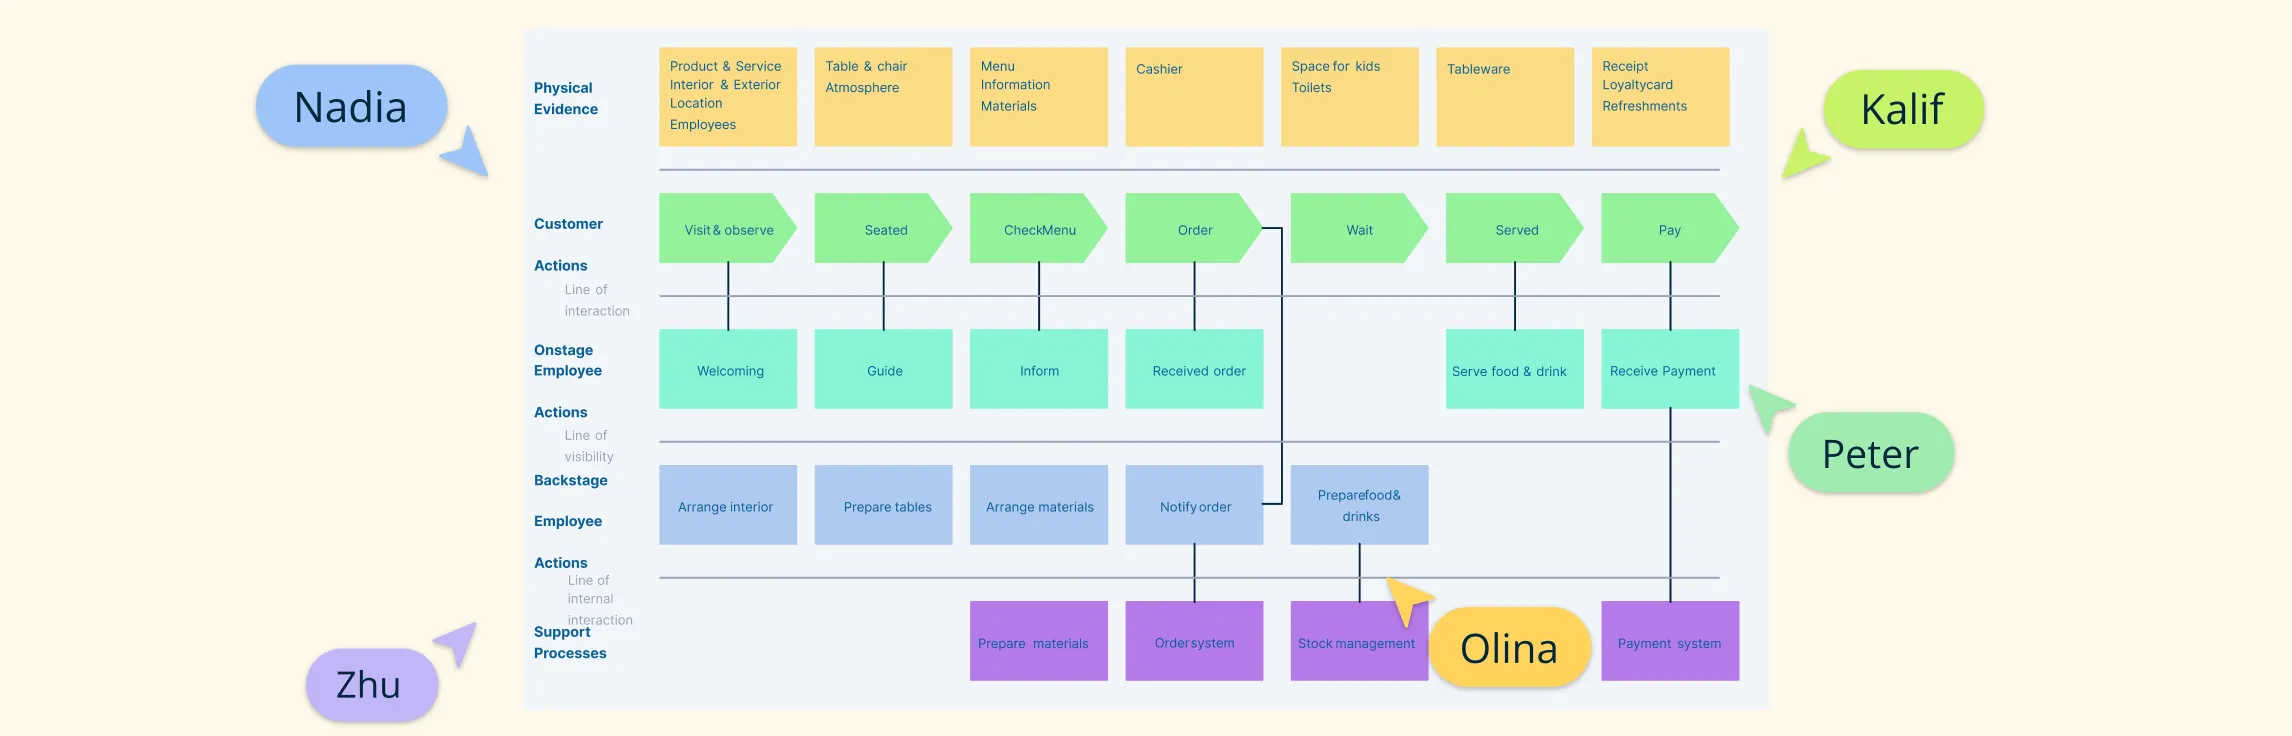
Service blueprint software helps teams map both the customer-facing and behind-the-scenes parts of a service. It’s a key tool for improving experiences and operations. In this guide, we’ve rounded up the best service blueprint software available today — covering both free and paid options. Whether you’re looking for deep collaboration features, flexible templates, or just a simple way to visualize service processes, this list has you covered.
The service blueprint methodology is a structured way to understand and improve how a service works—both for customers and the teams behind the scenes. Unlike a one-time diagram, it’s a repeatable process that helps businesses design better experiences, fix gaps, and align everyone involved in delivering a service.
Process maps and service blueprints make complex work easier to understand, but they answer different questions. A process map shows how work flows through a process, while a service blueprint connects the customer journey with the frontstage and backstage activities that deliver it. A service blueprint vs process map comparison helps teams choose the right view, identify gaps, and improve both operations and service experiences. This guide compares their purposes, components, similarities, and use cases, then explains how to turn a process map into a service blueprint.
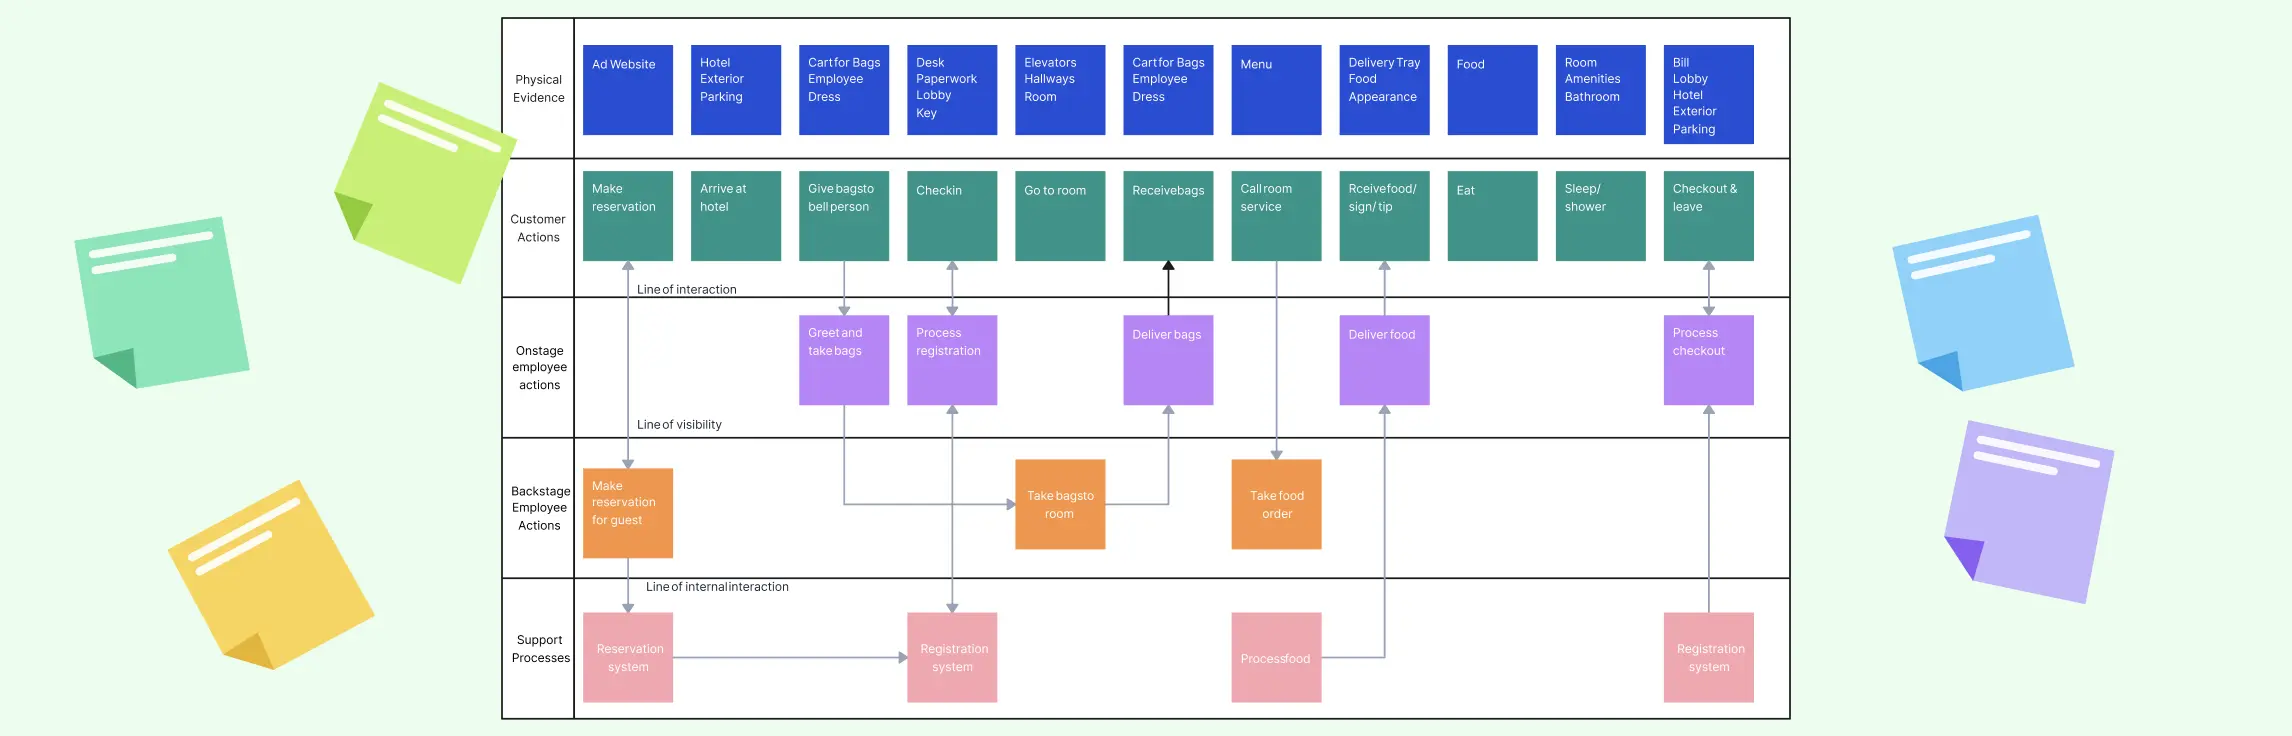
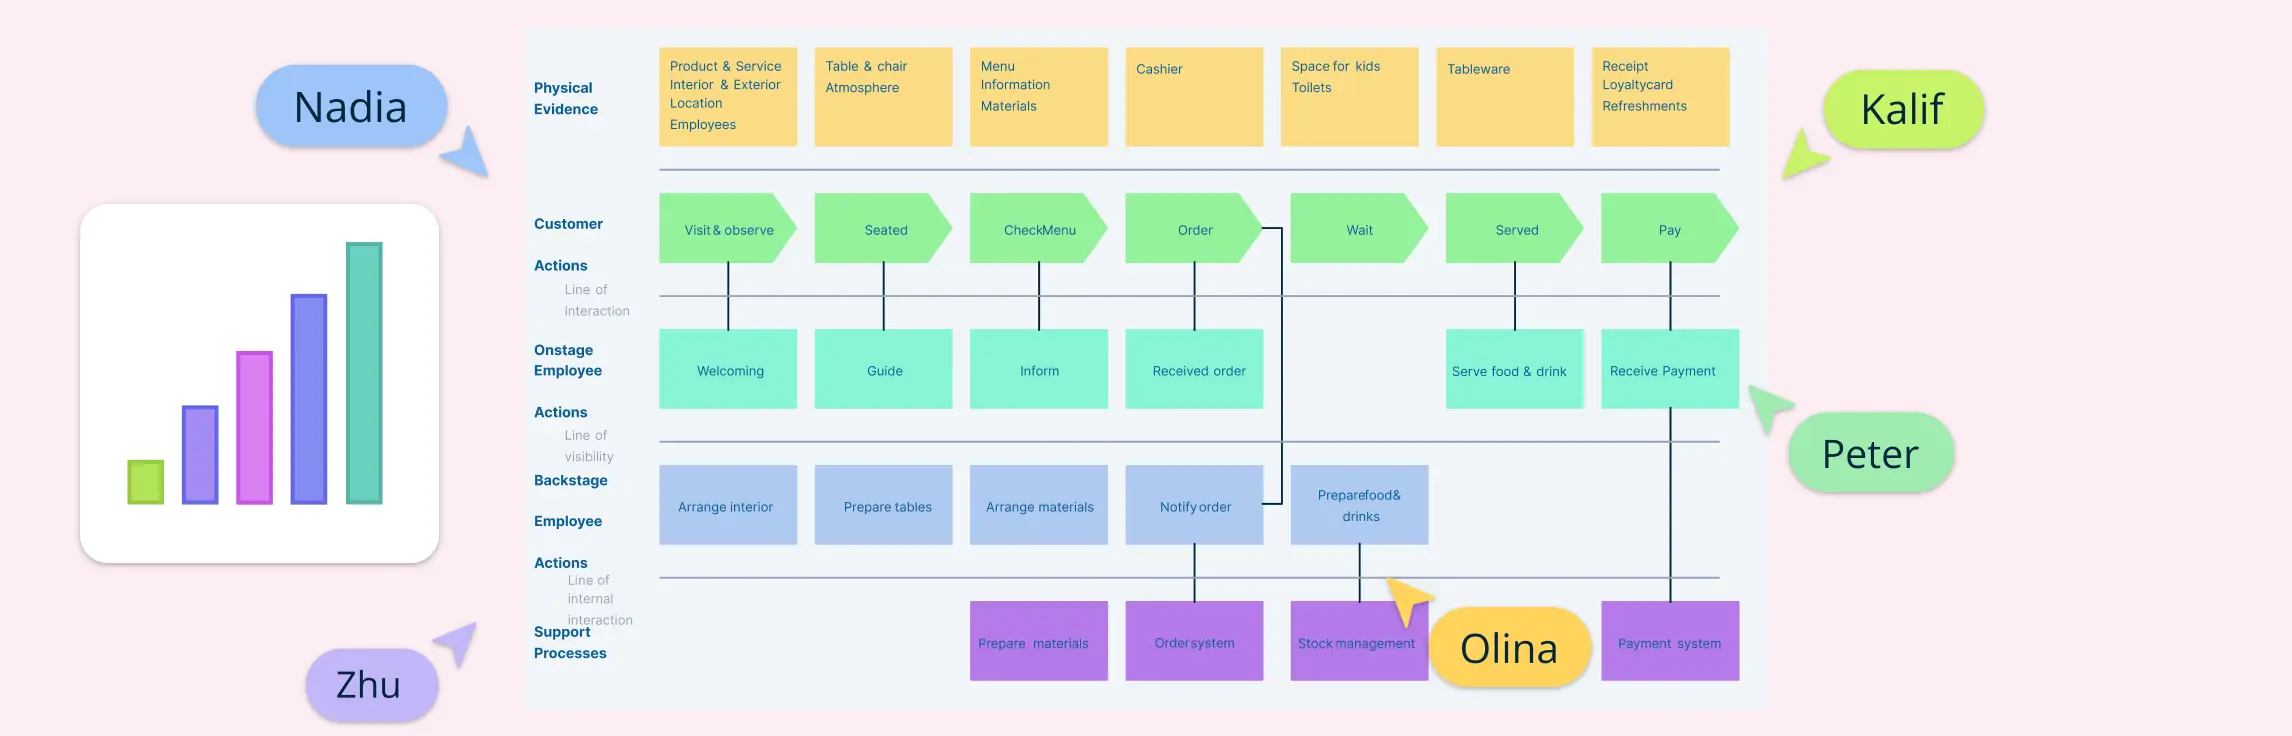
A service blueprint is a visual map that shows how a service works—from what the customer experiences to what happens behind the scenes. It helps teams see the full picture, align better, and improve how services are delivered.
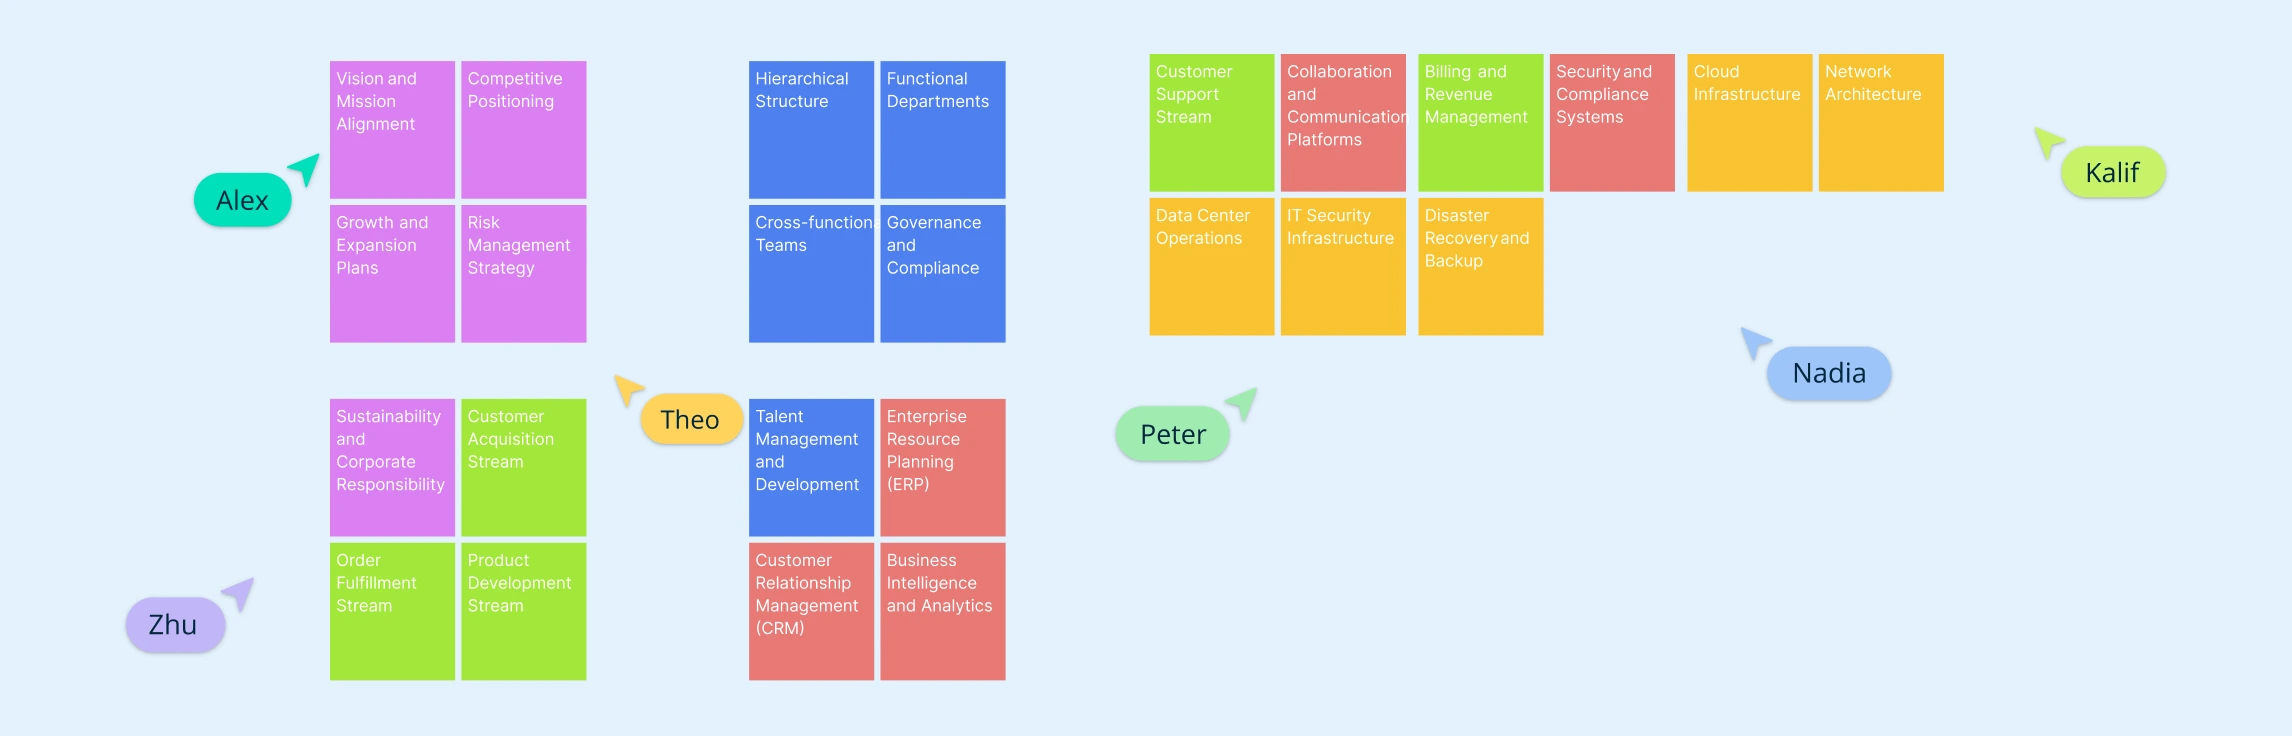
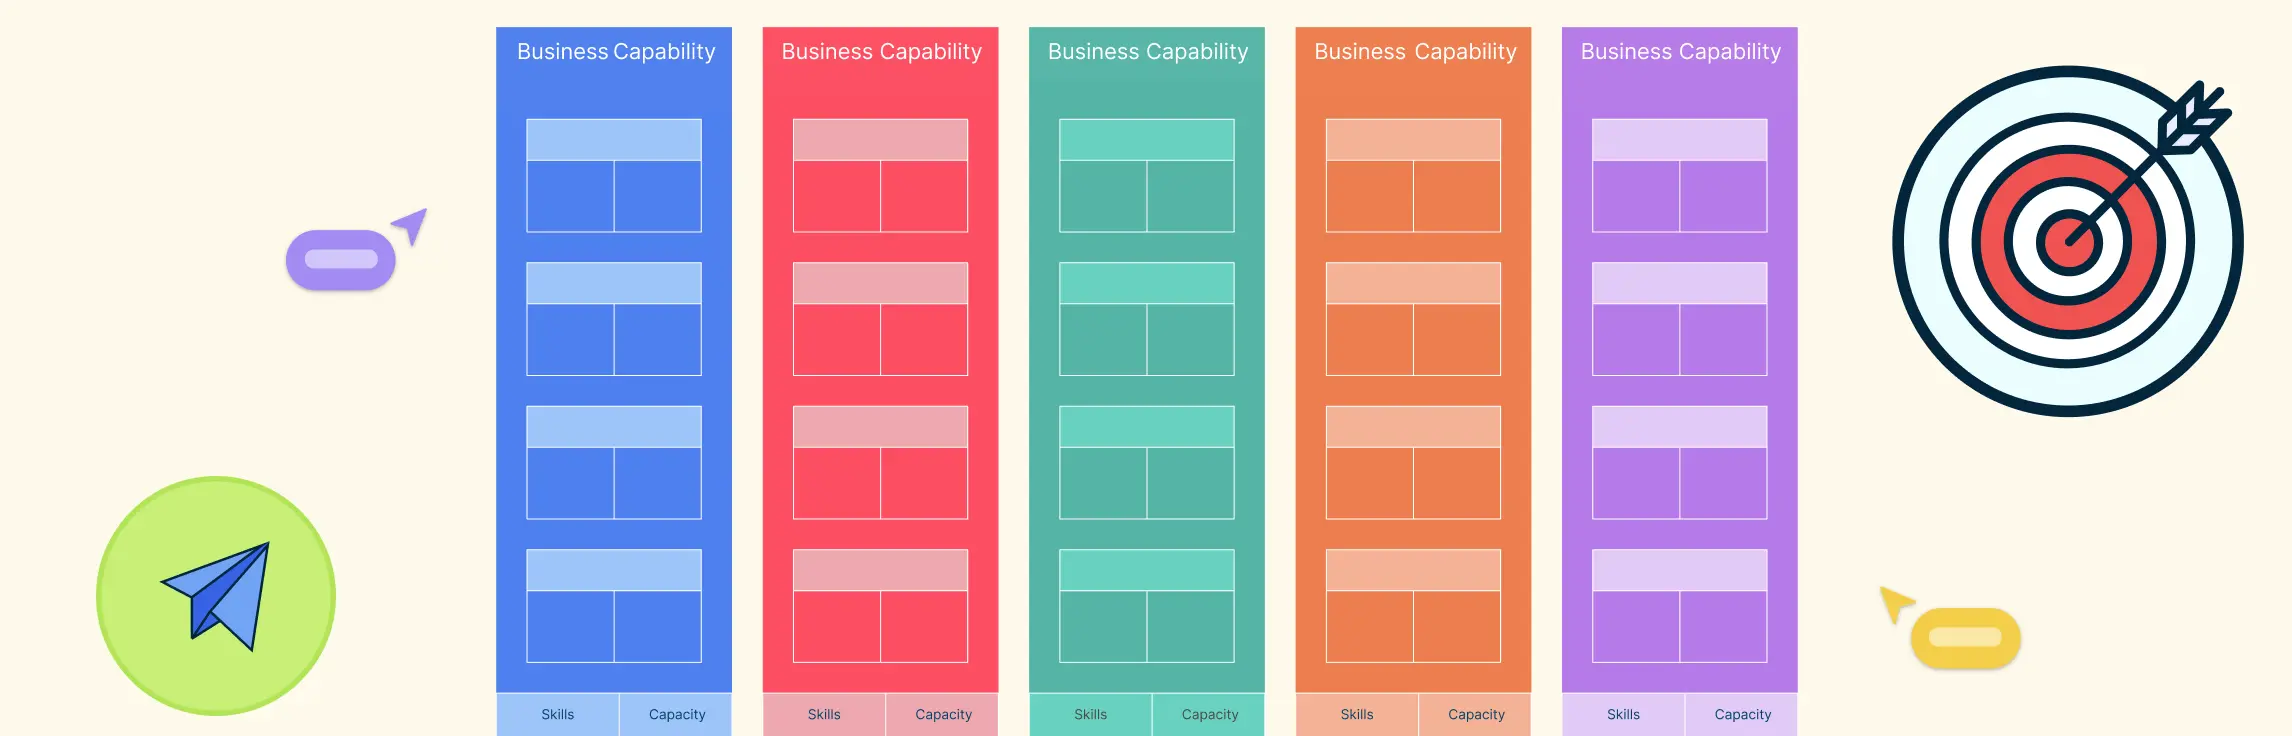
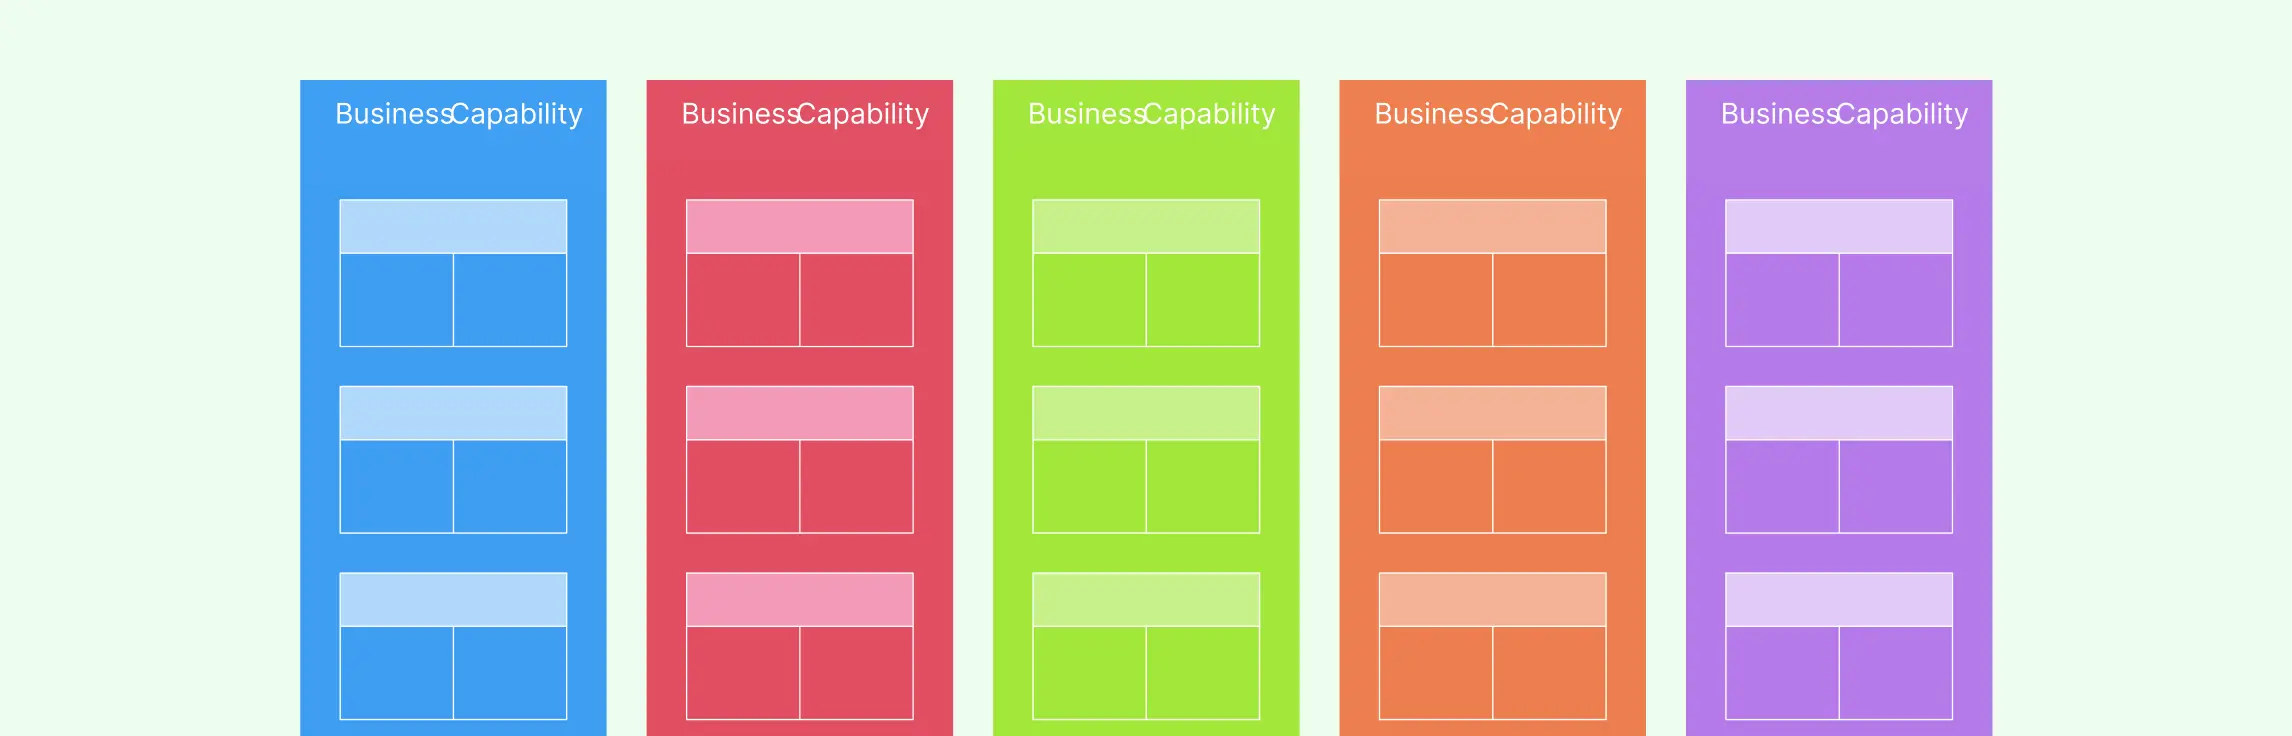
What Is a Business Capability Model? A business capability model is a visual representation of what a business does to deliver value, completely independent of how it’s done, who does it, or what systems are used.
What Is an Enterprise Capability Model An enterprise capability model is a structured, hierarchical representation of what an organization does, independent of how, where, or by whom the work is performed. It defines an organization’s capabilities—the core functions or outcomes it must deliver to succeed—without tying them to specific processes, systems, departments, or people.
If you work in chemical, mechanical, or process engineering, chances are you’ve come across a process flow diagram (PFD). These aren’t your everyday business flowcharts—they’re high-level technical blueprints that show how materials and energy move through a system. In this guide, we’re going beyond the theory. You’ll learn how to create a process flow diagram, step by step.
Creating a business capability map might sound complex, but it’s really about stepping back and taking a thoughtful look at what your business needs to be able to do — not how it does it or who does it. The goal is to create a big-picture view of your organization’s abilities so you can plan better, make smarter decisions, and stay aligned. Let’s see how to create a business capability map.
In this guide, we’ll show you how to create a service blueprint step by step. Whether improving support, onboarding, or checkout, a blueprint helps you see the full picture—including behind-the-scenes processes. If you’re new to service blueprints, check out our what is a service blueprint guide first.
A business capability map is a high-level view of what your organization does to deliver value, focusing on core areas like customer management, product development, or logistics. It strips away the complexity of roles and processes to highlight the actual capabilities that drive the business. In strategic management, capability maps help leaders see where the organization is strong, where it needs improvement, and where to invest. They provide a clear, shared view that connects strategy with real execution. Let’s see how to use business capability maps for strategic management.
What Are Service Blueprints A service blueprint is a visual tool that shows how a service is delivered—from what the customer experiences to the behind-the-scenes processes that support it. It breaks down each step of the service, including what the customer does, what employees do (both seen and unseen), and the internal systems involved.
Service blueprints visualize how a service works—from what customers experience to the people, systems, and processes behind each touchpoint. They can help teams surface dependencies, failure points, unclear ownership, and improvement opportunities across digital, physical, and internal services.
A business capability map is a visual representation that shows what an organization is able to do. It doesn’t focus on how the work gets done, who does it, or what tools are used. Instead, it outlines the core abilities that allow the business to operate, deliver value to customers, and achieve its goals. These abilities, called capabilities, are stable over time even when processes, people, or technologies change.
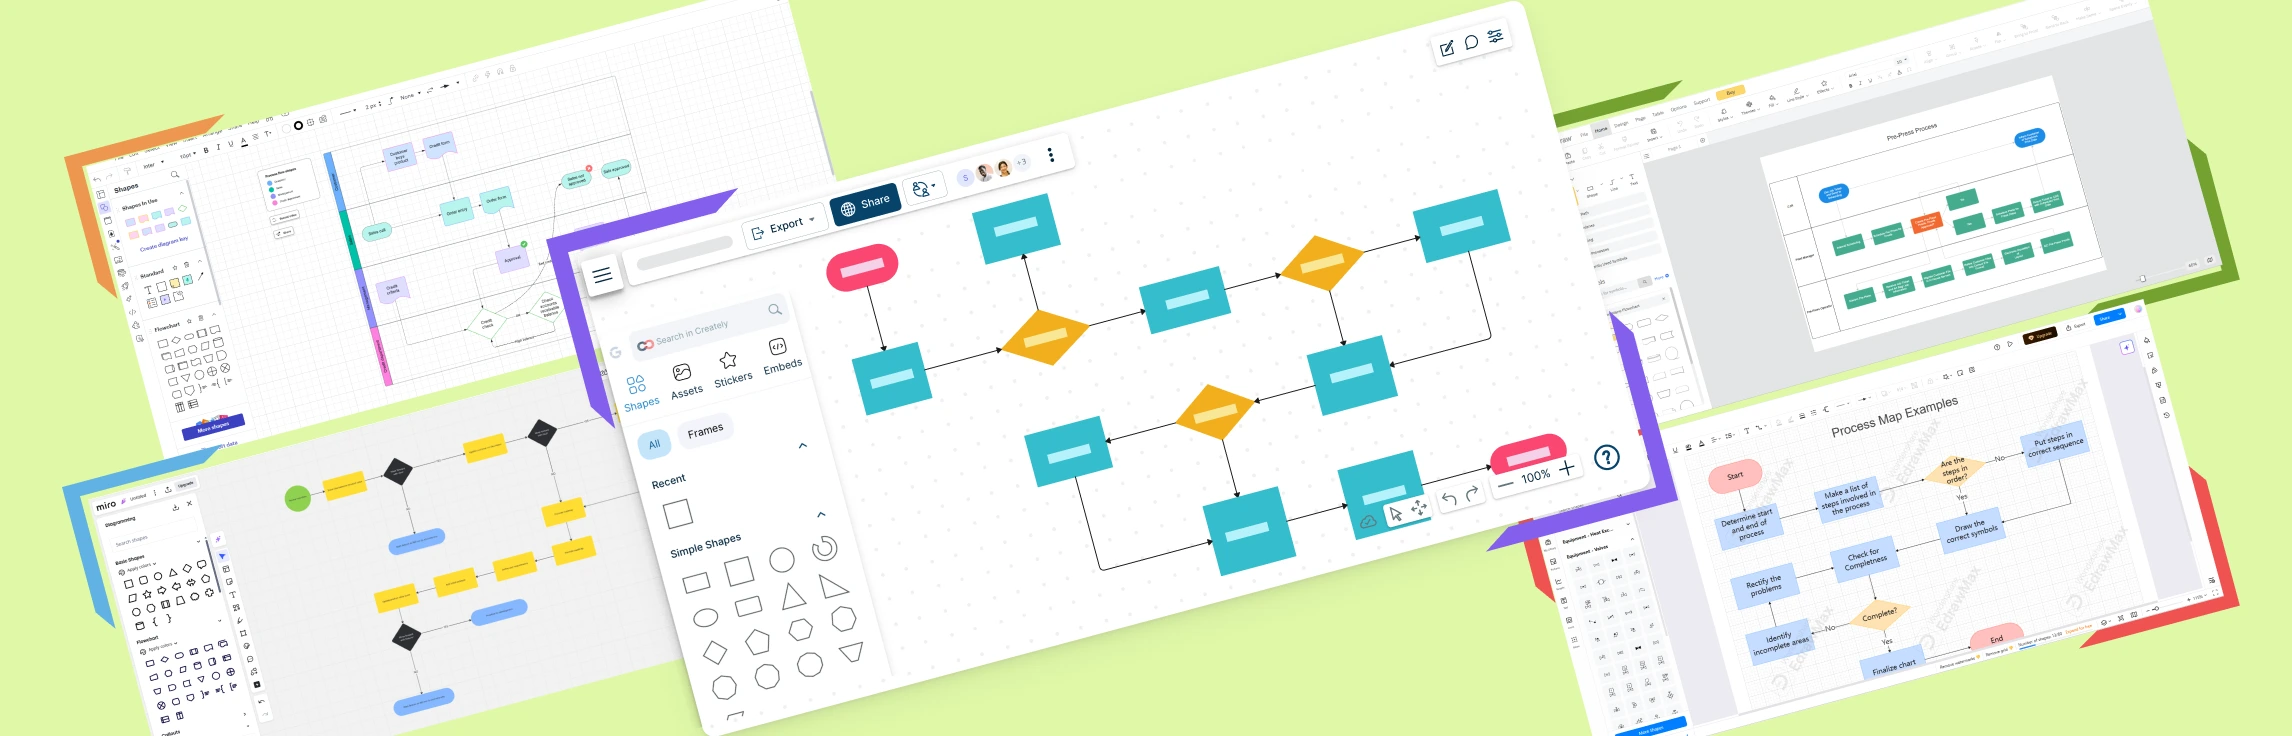
Process flow diagram software helps teams visualize how activities, decisions, information, materials, or systems connect. The term can refer to business process flows or to engineering process flow diagrams, so the best tool depends on the notation, symbols, data, and level of technical precision your use case requires.
Process Flow Diagram Symbols represent the key equipment, lines, and instruments in a process, helping you visualize how materials flow through a system. Knowing these standard PFD symbols makes reading and creating PFDs easier.
A screen flow diagram is a visual tool that shows how users move through an app, website, or software. It maps out the different screens, the paths between them, and the decisions users make along the way. By laying out this journey step by step, teams can design smoother, more intuitive digital experiences.
A process flow diagram (PFD) visually maps out the steps in a process from start to finish using standard symbols. It helps teams understand, analyze, and improve workflows across fields like engineering, business, and software. This guide explains what a PFD is, its main components, key symbols, and why it’s useful.
An Event-Driven Process Chain (EPC) diagram models the chronological and logical flow of a business process through events, functions, and AND, OR, or XOR connectors. It is especially useful when teams need to show what triggers an activity, what state results from it, and which role or system supports the work.
Flowcharts are one of the simplest yet most powerful tools for visualizing processes, making them easier to understand and optimize. In this guide on flowcharting basics, we’ll walk you through the essential symbols, best practices, and ready-to-use templates to help you create clear and effective flowcharts.
Specification and Description Language (SDL) diagrams describe the structure and behavior of reactive, message-based systems. Defined by the ITU-T Z.100 series, SDL combines hierarchical system decomposition with communicating extended finite-state machines. This guide explains SDL meaning, core concepts and symbols, creation steps, applications, limitations, comparisons, and editable examples for telecommunications, software, and embedded-system work.
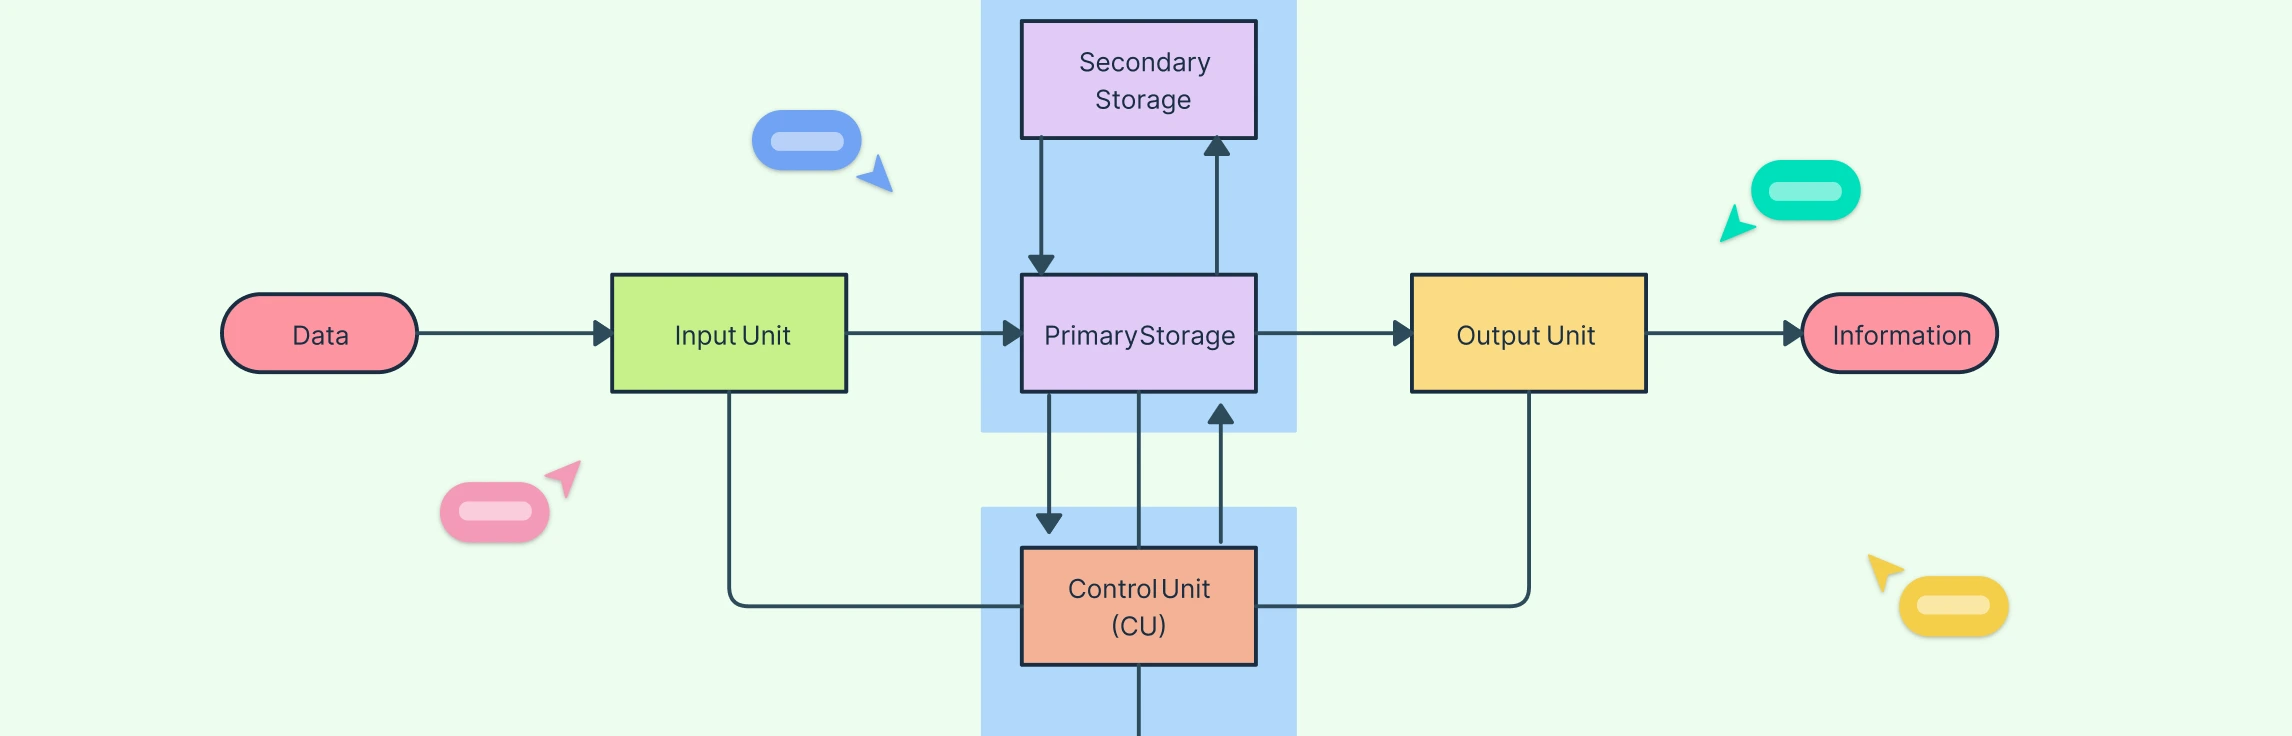
A system flowchart is a simple but powerful way to visualize how a process works. It breaks down complex systems into easy-to-follow steps using standard symbols and logical connections. Whether you’re designing a business workflow, developing software, or improving efficiency in an organization, a system flowchart helps you see the bigger picture.
Have you ever felt lost in a complicated process at work or struggled to explain how something gets done? That’s where a workflow diagram comes in. It’s a simple, visual way to show the steps of a process from start to finish. By mapping out tasks, decisions, and who is responsible for what, workflow diagrams help teams work more efficiently and avoid confusion.
Every business, big or small, has a journey to turn ideas into products or services that customers love. But what makes this journey efficient and successful? The answer lies in understanding the value chain.
Projects rarely unfold in a linear, predictable manner. Like a complex chess match, each task interacts with others, creating a dynamic landscape of dependencies and potential challenges. Successful project managers don’t just manage tasks—they orchestrate intricate relationships, anticipating how one activity might impact another. Understanding these interconnections is less about rigid planning and more about creating flexible, adaptive strategies that can navigate the unpredictable terrain of project execution. Whether you’re leading a software development sprint, constructing a building, or launching a marketing campaign, mastering the art of mapping project dependencies can transform potential chaos into a synchronized, efficient workflow.
Creating an organizational chart might seem like a big task, but with tools like Google Sheets, it’s surprisingly easy. In this guide, we’ll walk you through every step of the process, from setting up your data to designing a chart that makes your hierarchy easy to understand. With just a few clicks, you’ll learn how to make an org chart in Google Sheets that’s clean, professional, and ready to share with your team.
A process improvement plan is a structured roadmap for finding inefficiencies, addressing their root causes, and measuring whether changes deliver better results. It connects the current process, improvement goals, proposed solutions, owners, timelines, and success metrics in one actionable plan.
Swimlane diagrams are a visual tool that breaks down tasks by roles or departments, helping everyone involved understand their responsibilities and how they fit into the larger process. In this guide, we’ll cover everything you need to know about swimlane diagrams—from understanding their key components to learning how to create and use them effectively. Whether you’re new to process mapping or looking for a way to improve your workflow management, this guide will provide practical tips and examples to get you started.
Process mapping software has become essential for businesses of all sizes because teams need more than a one-time diagram. They need a reliable way to map workflows, assign ownership, manage handoffs, and keep process documentation current as work changes. Without the right tool, process maps quickly become outdated, scattered, and hard to use during reviews or improvement work.
Business process mapping often fails for one simple reason: teams either create maps that are too high-level to improve day-to-day work or too detailed to maintain as processes change. This guide explains business process mapping levels you can use to document the same workflow at the right depth for the right user. You’ll learn the 4 core levels (plus an optional Level 5 for work-instruction detail), see practical examples for each level, compare using 4 vs. 5 levels, and understand how to choose the right level for goals like alignment, improvement, training, compliance, and automation.
Process mapping is a powerful tool that helps businesses visualize and improve their workflows. By creating a clear map of each step in a process, teams can see how work flows, identify bottlenecks, and pinpoint opportunities to make things run smoother. But there isn’t just one way to map a process—different process mapping techniques are available, each suited to various types of tasks and levels of detail.
Business process mapping is a way to visualize and understand how a business works step-by-step, making it easier to spot inefficiencies and improve workflows. By creating a clear picture of each task, role, and decision point, it helps teams see where they can save time, cut costs, reduce errors, and keep supporting process knowledge connected to the map. This guide introduces the essentials of business process mapping, from understanding map types to learning best practices and tackling common challenges.
Process improvement is the disciplined practice of understanding how work happens, identifying a measurable problem, testing a change, and checking whether the result improved. The goal is not to change every process continuously; it is to focus effort where evidence shows avoidable delay, risk, rework, waste, or poor stakeholder outcomes.
Workflows and processes often get mixed up — but they’re not the same. A process is the big picture of how work gets done, while a workflow is the step-by-step path that brings that process to life. Knowing the difference helps teams work faster, find bottlenecks, and automate smarter. In this guide, we’ll break down workflows vs processes, show where they overlap, and share practical examples to help you decide which one your team needs.
What Is a Service Blueprint? Service blueprints help teams visualize how a service is delivered across customer touchpoints, employees, systems, and supporting processes. This guide explains the core components, when to use a blueprint, how to read one, and how to build one step by step with practical templates. It also shows how to assign ownership, examine backstage handoffs, and keep the blueprint current as the service changes.
Workflows are the backbone of any team’s work, but without clear rules, even the best workflows can get messy. Workflow guidelines provide a framework to keep work consistent, organized, and efficient.