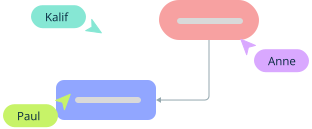
Specification and Description Language (SDL) diagrams describe the structure and behavior of reactive, message-based systems. Defined by the ITU-T Z.100 series, SDL combines hierarchical system decomposition with communicating extended finite-state machines. This guide explains SDL meaning, core concepts and symbols, creation steps, applications, limitations, comparisons, and editable examples for telecommunications, software, and embedded-system work.
What Is an SDL Diagram?
An SDL (Specification and Description Language) diagram is a graphical representation of a formal language for specifying reactive systems. SDL models system structure through systems, blocks, and processes, and represents behavior with states, transitions, inputs, outputs, decisions, tasks, timers, and procedures. Processes communicate using signals carried through defined channels.
SDL was designed for the unambiguous specification and description of telecommunications systems, but the ITU notes that it is generally suitable for reactive systems described through discrete message exchanges. A conforming SDL model can support rigorous analysis or tool-based simulation; a visual sketch that merely resembles SDL does not automatically have formal SDL semantics.
SDL Diagram Symbols
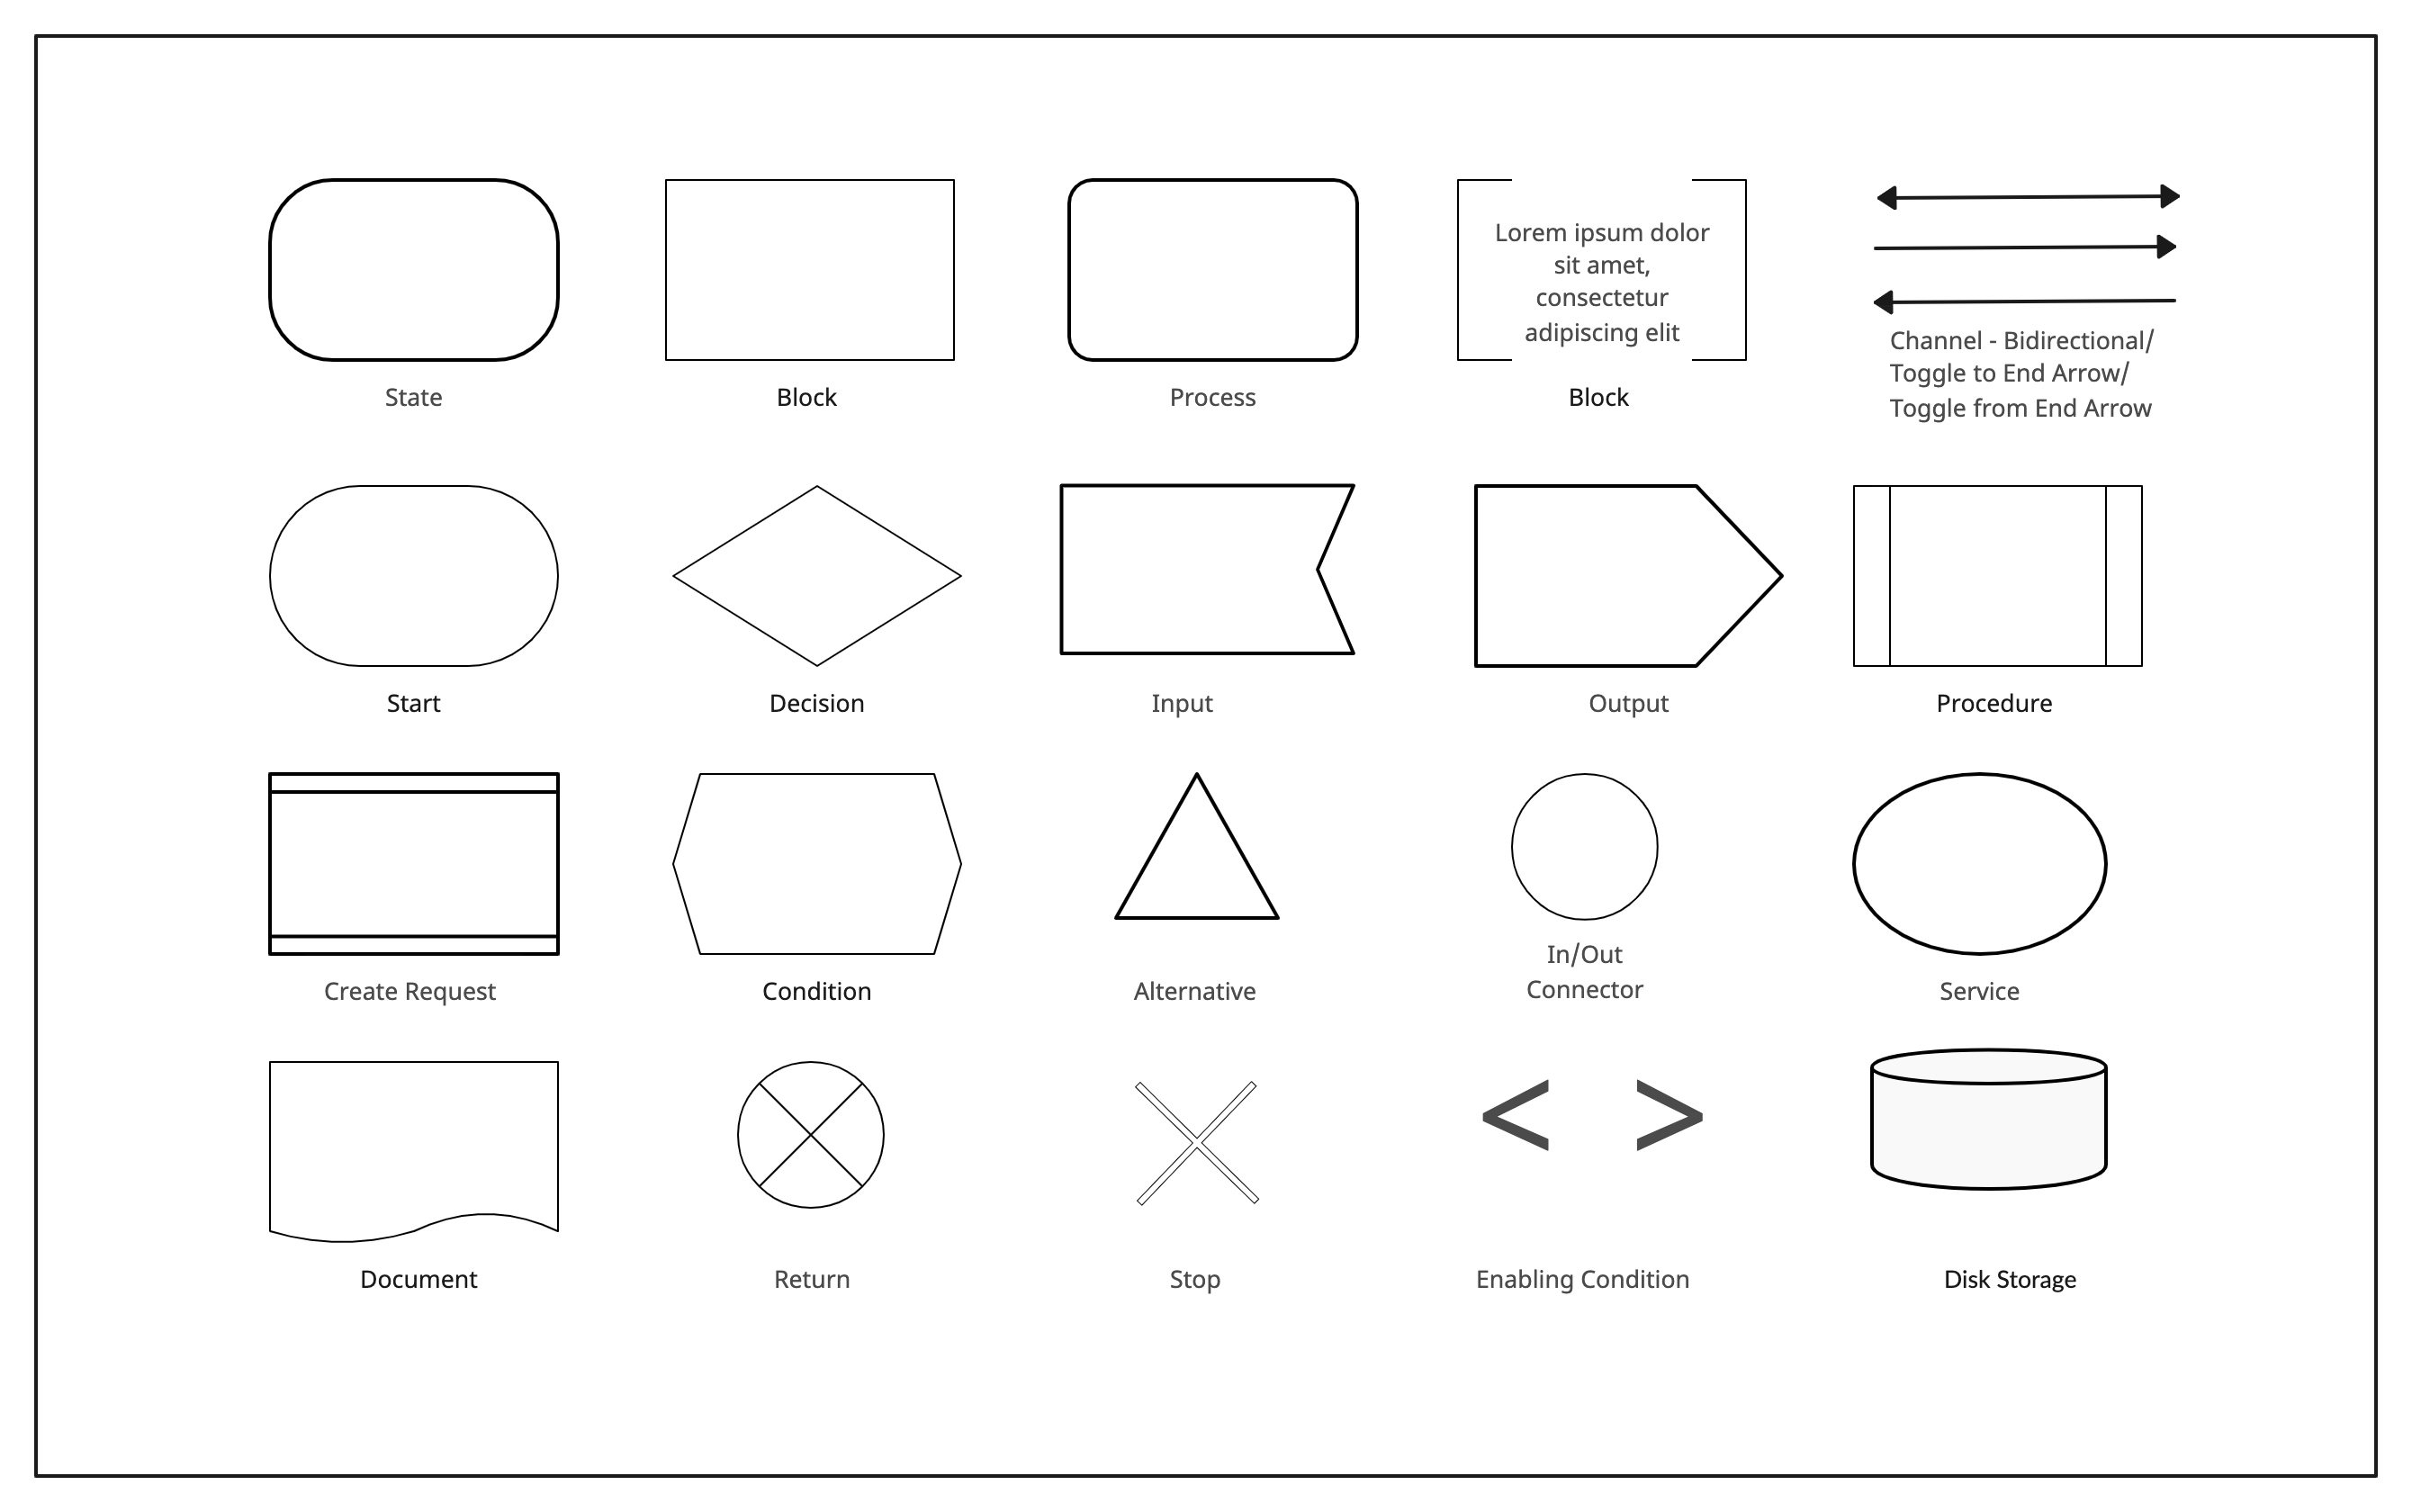
SDL-2010 has graphical and textual grammars covering structure, behavior, data, and communication. The table below combines common SDL concepts with several general documentation symbols available in diagramming libraries. Elements such as systems, blocks, processes, states, inputs, outputs, signals, channels, decisions, tasks, procedures, timers, create operations, and stop behavior have defined SDL meanings. Generic notes, documents, storage symbols, and styling aids can provide context but should not be presented as formal SDL semantics unless the selected notation or tool defines them that way.
| Symbol | Description |
| State | Represents a specific condition or situation in which a process can exist. |
| Block | Denotes a major component or subsystem within the overall system architecture. |
| Process | Illustrates an individual operation or function that occurs within a block. |
| Signal | Depicts a message or communication sent between processes or blocks. |
| Note | Provides additional information or comments within the diagram for clarification. |
| Channel | Represents the medium or pathway through which signals are transmitted between components. |
| Start | Indicates the initiation point of a process or flow within the system. |
| Decision | Shows a branching point where a decision is made, leading to different outcomes or paths. |
| Input | Represents the receipt of an input signal by a process and can trigger a transition from the current state. |
| Output | Represents an output signal sent by a process to another agent or to the system environment. |
| Procedure | Illustrates a predefined sequence of operations or a sub-process within the system. |
| Create Request | Symbolizes a command or action to initiate the creation of a new process or entity. |
| Condition | Represents a specific criterion or state that influences the flow of the process. |
| Alternative | Indicates multiple possible paths or choices within the process flow. |
| In/Out Connector | Serves as a connector to link different parts of the diagram, especially when the flow continues on another page or section. |
| Service | Depicts a function or set of operations offered by a component to other parts of the system. |
| Document | Represents a report or document produced or used within the process. |
| Return | Indicates the return of control or data to a previous point in the process. |
| Stop | Marks the termination or end point of a process or flow. |
| Enabling Condition | Specifies a condition that must be met for a particular action or transition to occur. |
| Disk Storage | Represents data stored on a disk or other storage medium. |
How to Create an SDL Diagram
Creating an SDL diagram involves breaking down a system into structured components to model its behavior clearly. Here’s a step-by-step guide to help you create an SDL diagram effectively:
Step 1. Understand the system you’re modeling
Before you start drawing your SDL diagram, take time to analyze and break down the system. This step ensures that you have a clear idea of what needs to be represented. Follow these steps:
Identify the purpose of the system – What problem does it solve? What is its primary function?
List the major components – Identify the key functional parts of the system, such as user inputs, processing units, and outputs.
Understand interactions – Determine how different parts of the system communicate. What kind of messages (signals) do they send and receive?
Consider time-dependent actions – If the system has delays, waiting times, or events that happen after a specific duration, take note of them.
Step 2. Identify the key elements of your SDL diagram
An SDL diagram consists of several key components:
System – The highest level of the model, representing the entire system.
Blocks – Large functional units that make up the system.
Processes – Smaller components inside blocks that define system behavior.
Signals – Messages exchanged between processes or blocks.
Channels – The paths through which signals travel.
Timers – Elements used to manage time-based events.
Step 3. Define the system structure
Start by outlining the major blocks that make up your system. These blocks represent different functional areas, such as input processing, data management, or output generation.
- Draw a box to represent each block.
- Label the blocks according to their function.
- Ensure the structure logically reflects how the system operates.
Step 4. Break down each block into processes
Within each block, identify the process agents responsible for behavior. For each process, define its initial state, the input signals it can receive, the transitions those inputs trigger, the tasks or decisions performed, and the resulting outputs. Use the graphical syntax supported by the SDL method or tool rather than assigning improvised shapes.
Step 5. Establish signal flows between components
Signals are discrete messages exchanged between processes, blocks, or the environment. Name each signal clearly, identify its sender and receiver, and show the channel or route used for communication. In SDL, signals are asynchronous by default, so avoid inventing arrow styles for synchronous behavior unless the notation extension or modeling convention explicitly defines them.
Step 6. Define communication channels
Channels define communication paths between agents or between the system and its environment. Connect the correct endpoints and document which signals the channel can carry. Confirm that every input expected by a process has a valid source and route.
Step 7. Add timers if necessary
Use SDL timer operations when behavior depends on a timeout. Define when the timer is set or reset, the signal generated when it expires, and the transition that handles that signal. Follow the timer syntax provided by the SDL tool instead of substituting an unrelated clock icon.
Step 8. Review and refine your diagram
Once the model is drafted:
- Check completeness: Confirm that required agents, states, inputs, outputs, channels, decisions, timers, and termination paths are represented.
- Trace signal behavior: Walk through normal, exceptional, and timeout scenarios to find missing or unreachable transitions.
- Validate with specialists: Have system owners, developers, architects, and testers review responsibilities, message handoffs, assumptions, and expected outcomes.
- Use formal validation appropriately: If syntactic or semantic conformance matters, check the model with a tool that supports the relevant ITU-T SDL-2010 grammar. Visual inspection alone cannot establish conformance.
Step 9. Finalize and document your diagram
Record the model scope, assumptions, signal definitions, interfaces, owner, review date, and links to requirements or test evidence. Publish the validated source model for its intended audience and define who updates it when the system architecture, messages, or behavior changes. This turns the diagram into maintained system documentation rather than a static export.
SDL Diagram Examples and Templates
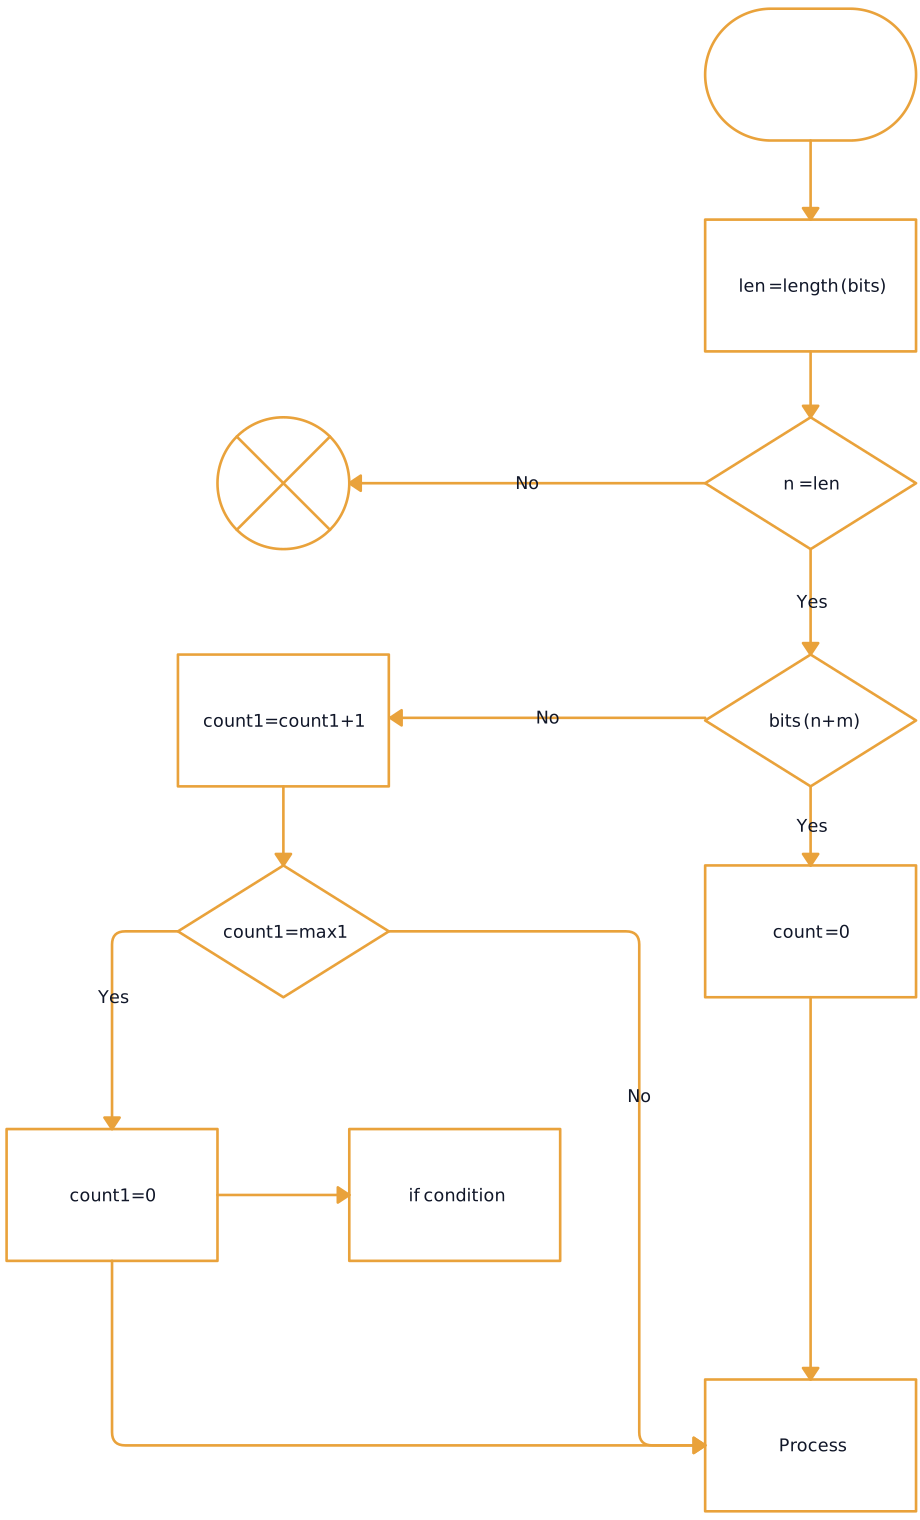
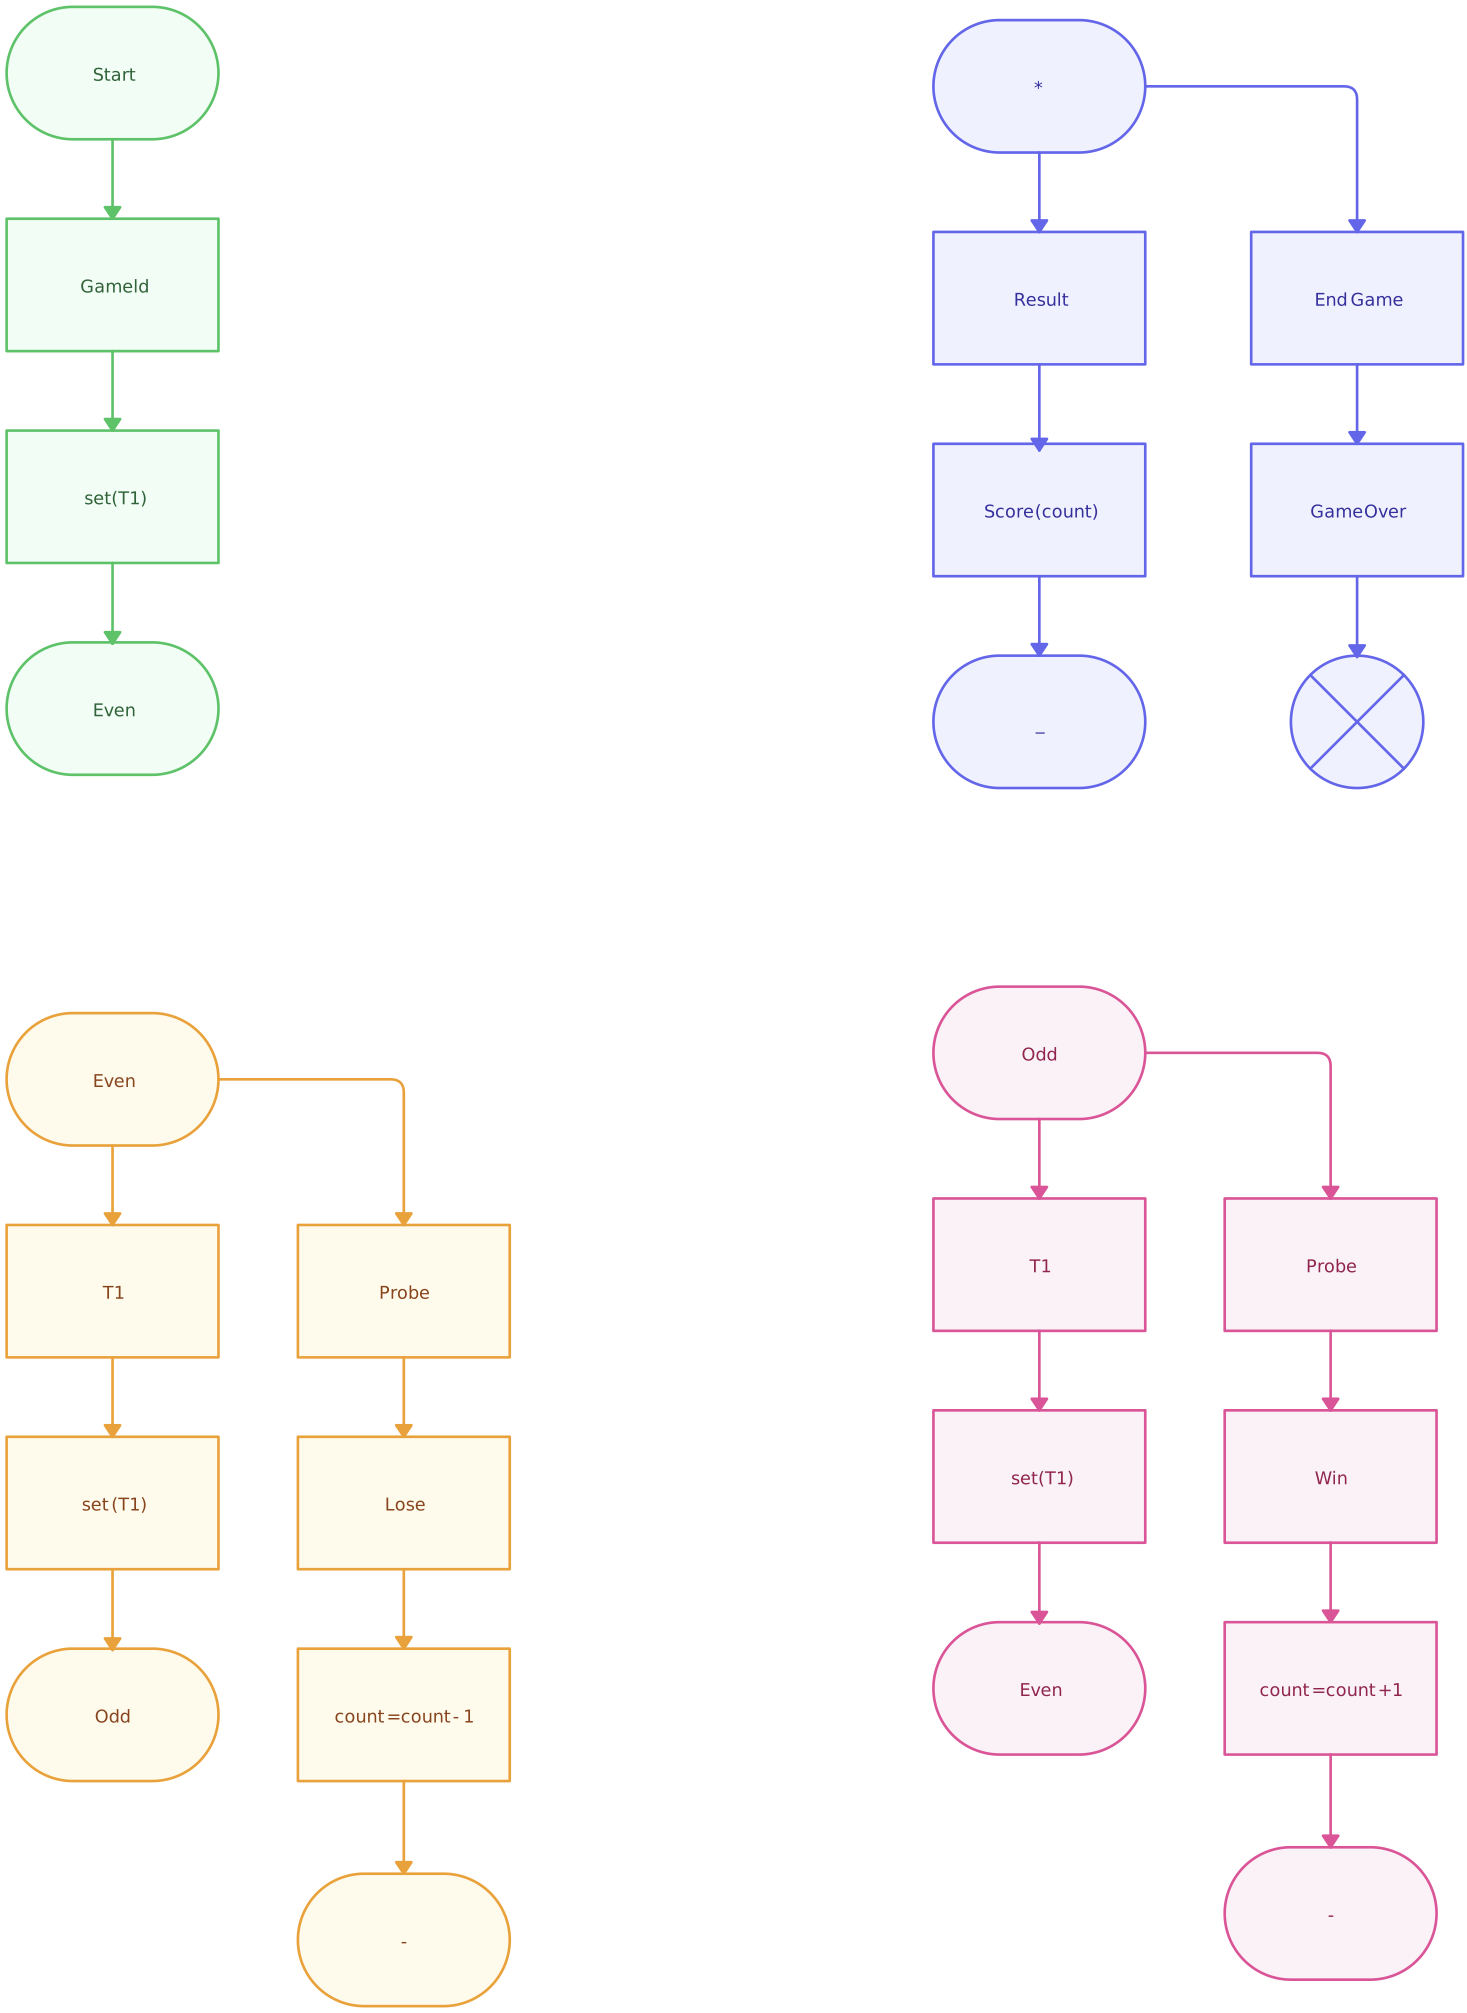
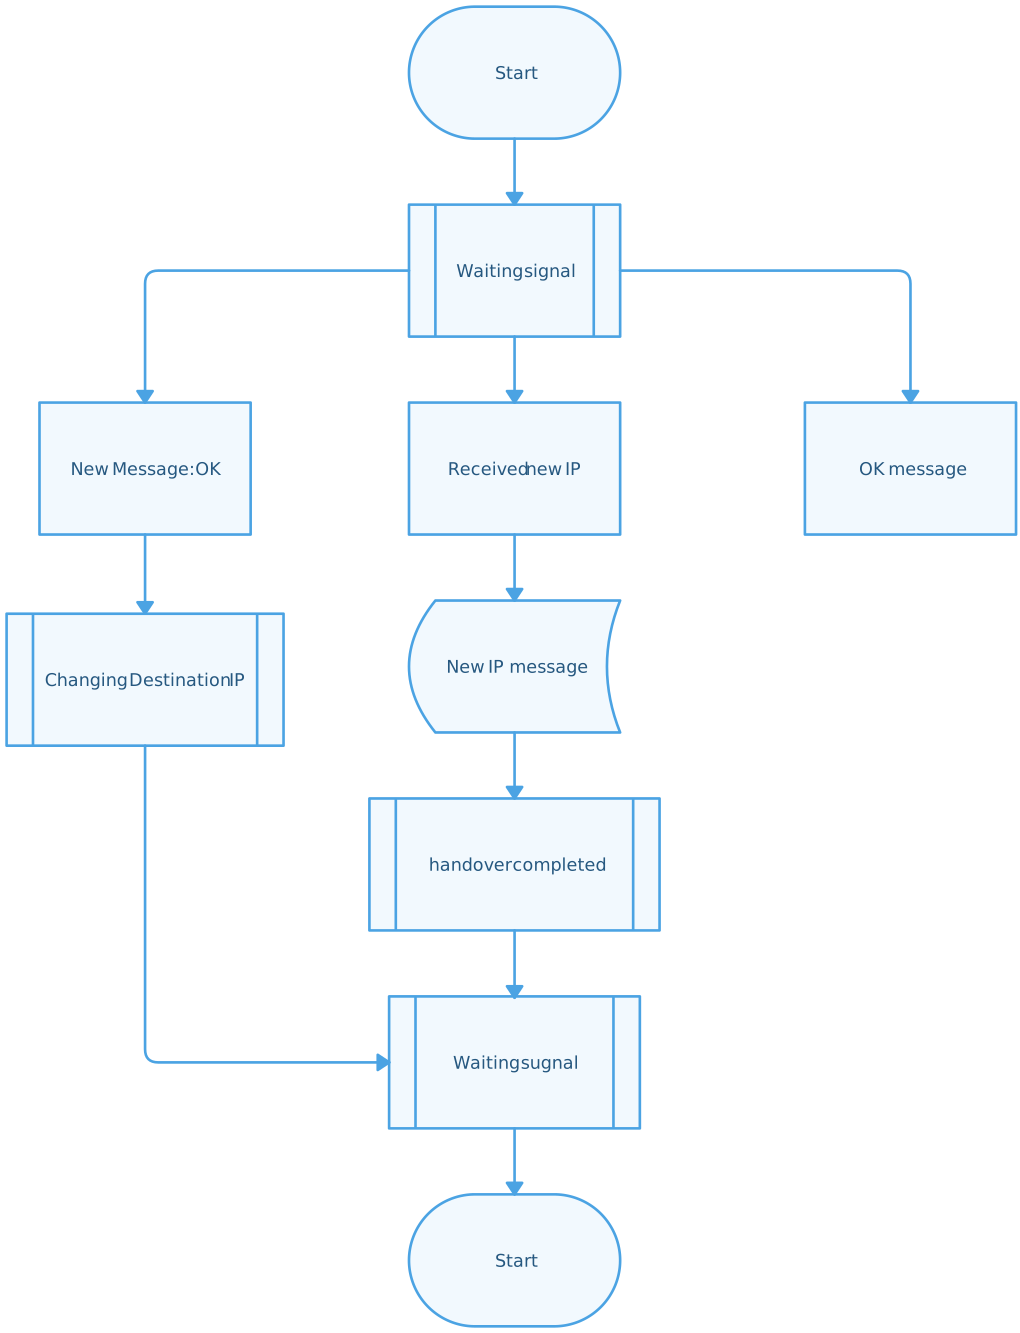
In this section, we’ll explore SDL diagram examples and templates to help you better understand how to structure and visualize your own diagrams.
Sample SDL Diagram
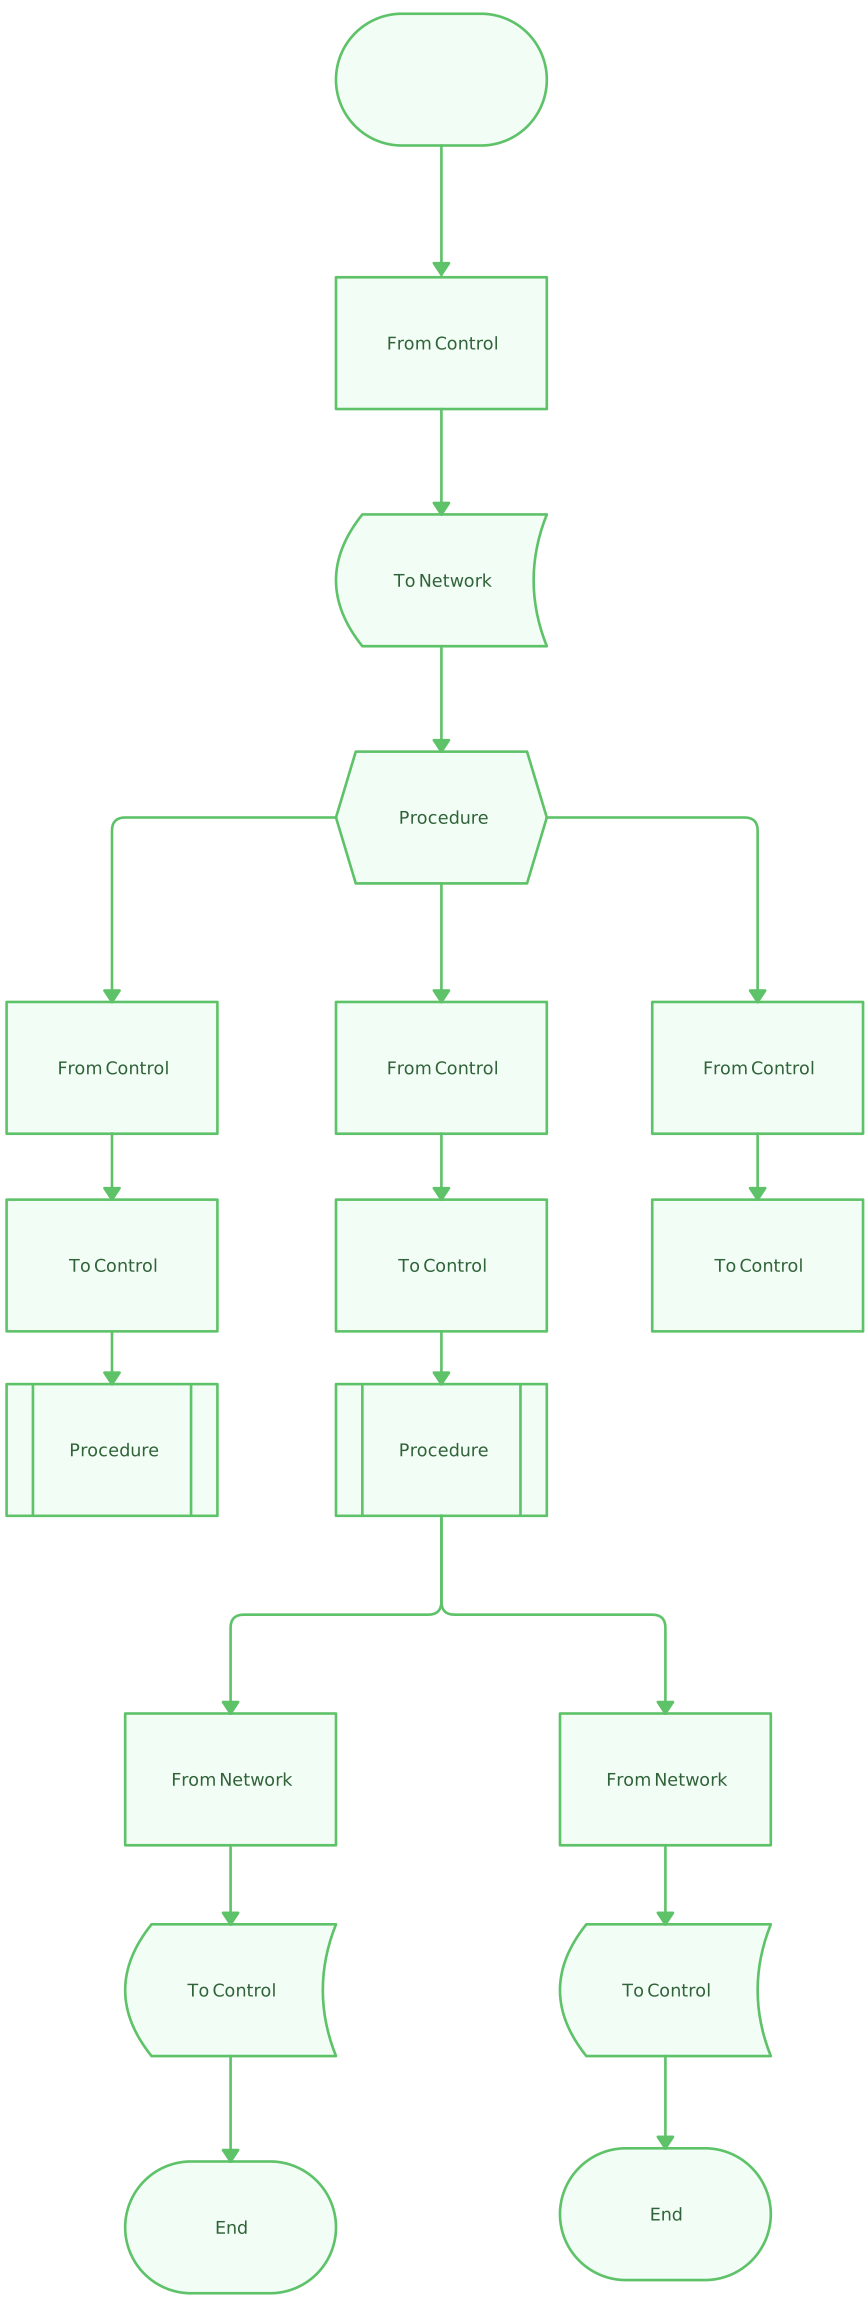

SDL Diagram Style State Machine
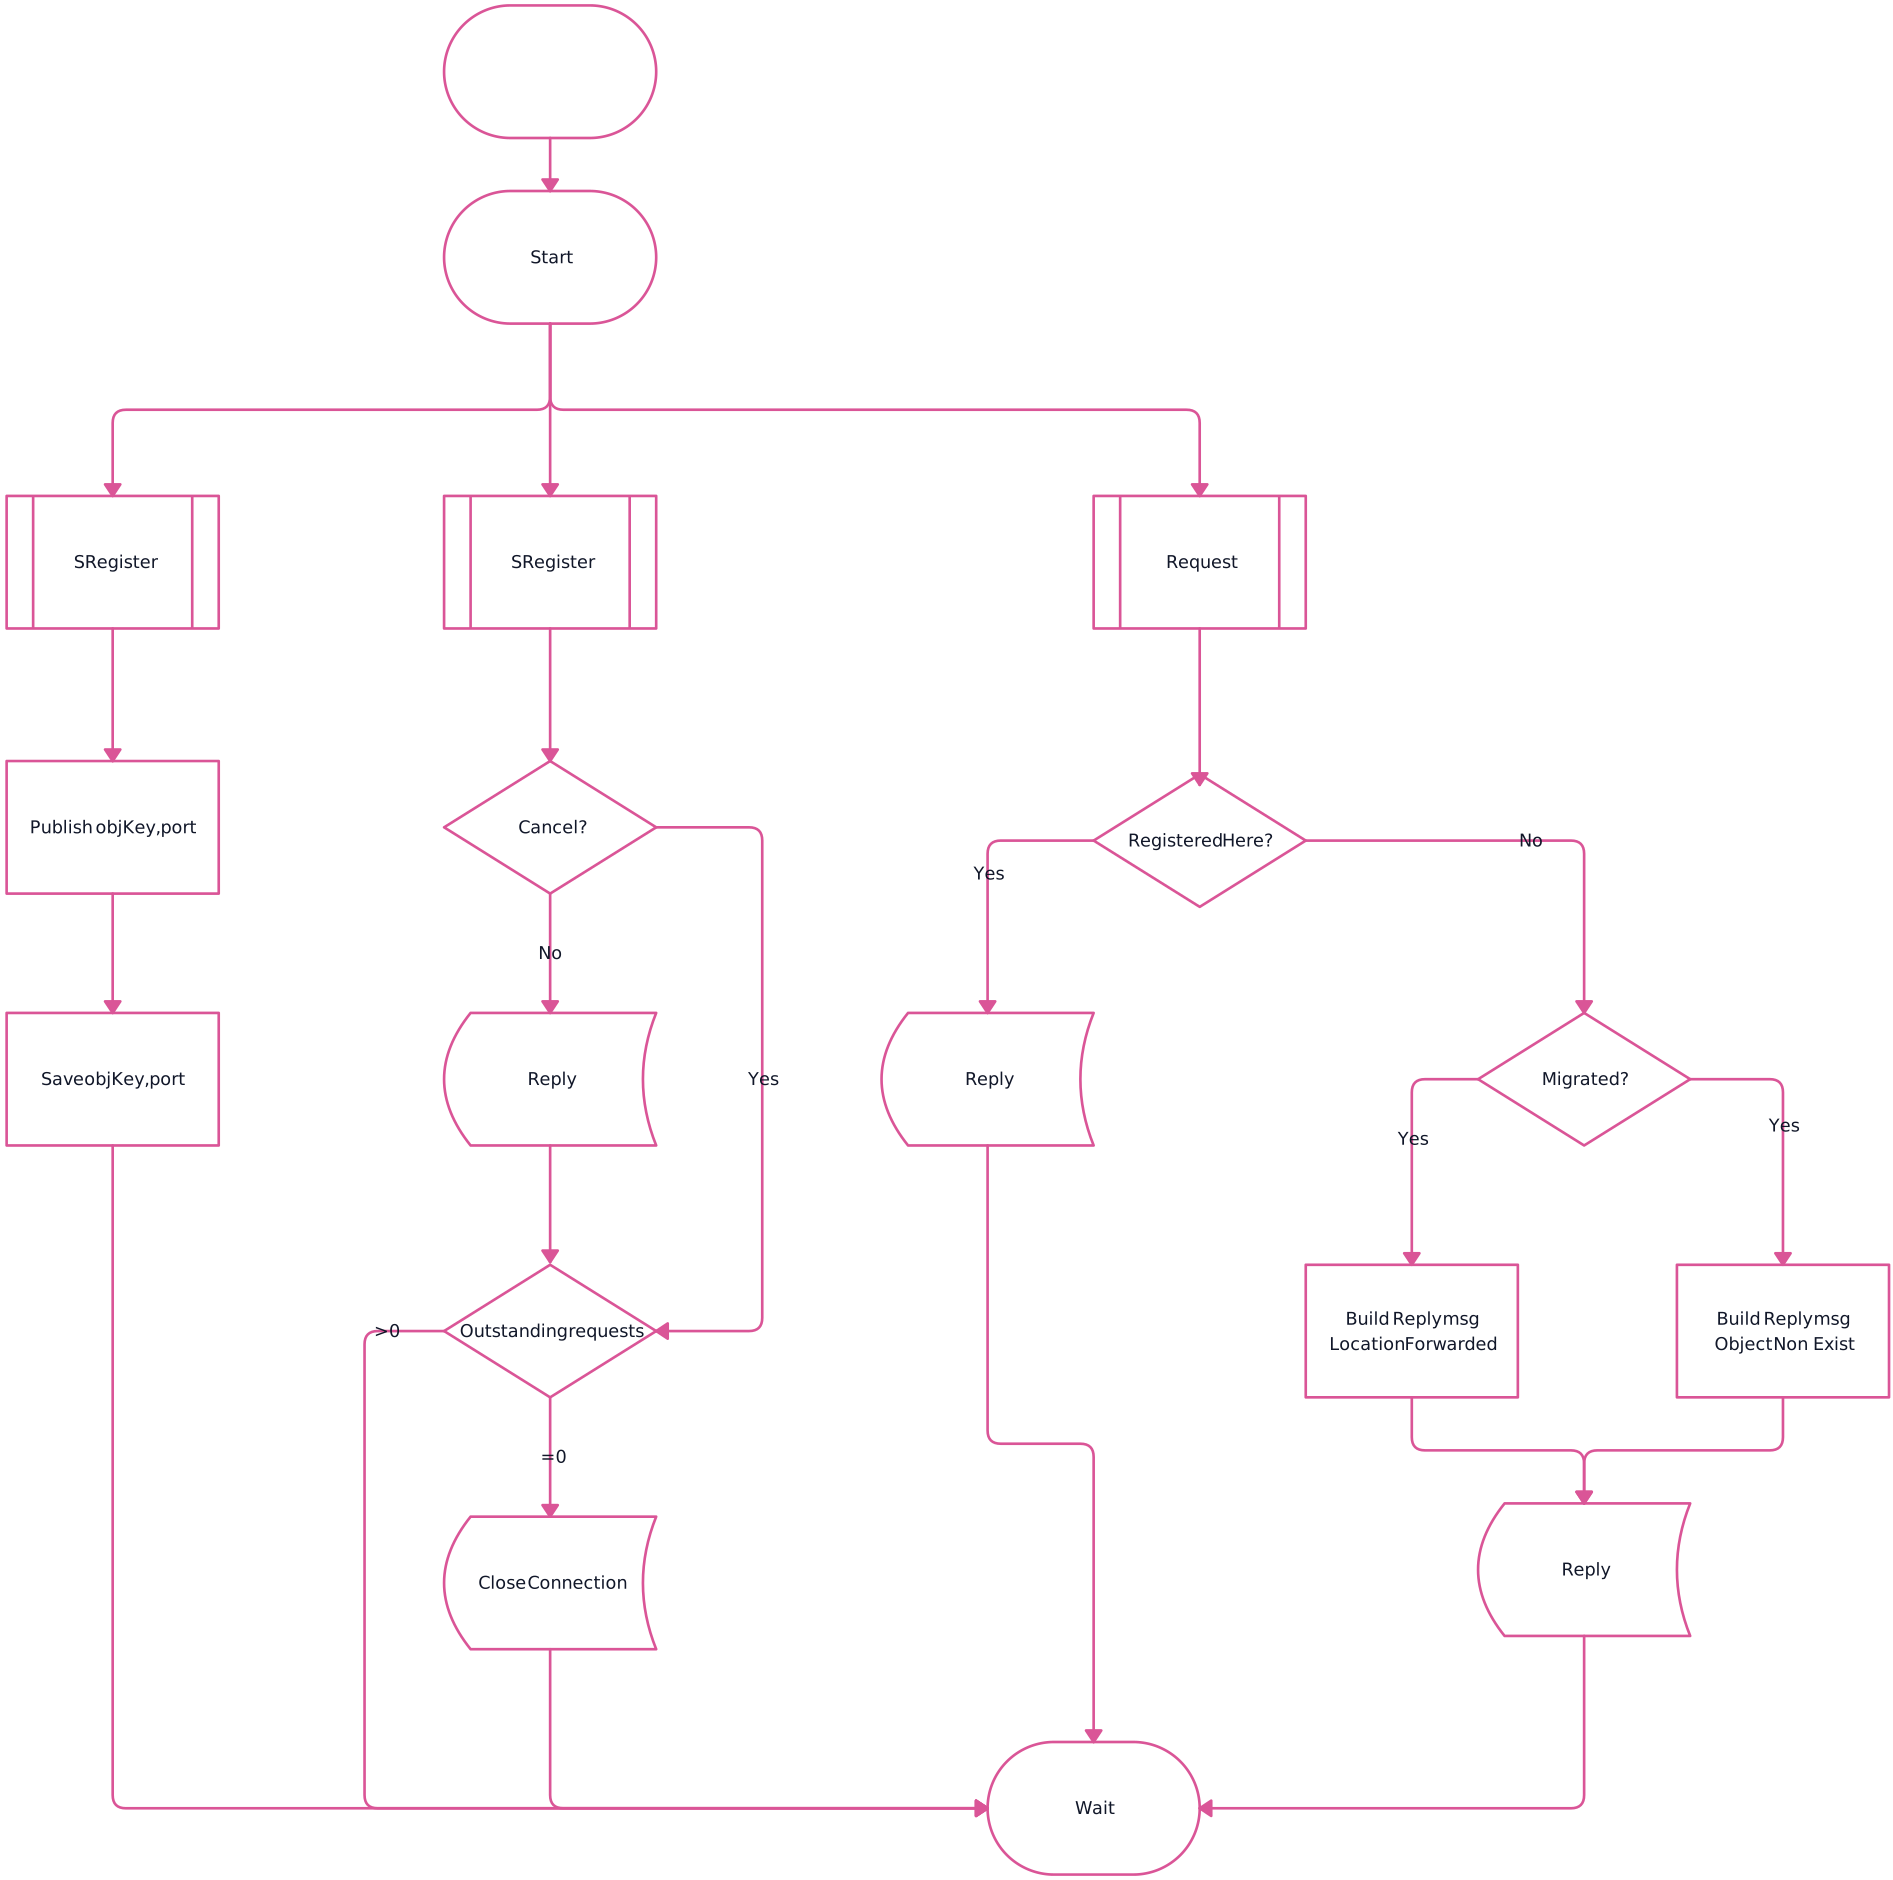
SDL Diagram Example
Gaming SDL Diagram
SDL Procedure Template
How SDL Diagrams Work
SDL diagrams are powerful tools used to model and visualize complex, real-time, and event-driven systems. They offer a structured approach to understanding system architecture and behavior.
Hierarchical structure of SDL diagrams
SDL diagrams are organized hierarchically, allowing for a clear representation of system components and their relationships. At the top level, you have the System, which encompasses the entire system’s architecture. Within the system, there are Blocks, representing major functional units. These blocks can be further decomposed into Processes, detailing specific behaviors and operations. This hierarchical breakdown facilitates a top-down understanding of the system’s structure and functionality.
Interaction between components
Communication between components is modeled through signals conveyed over channels. Signals are asynchronous messages that processes or blocks send and receive; receipt of an input signal can trigger a state transition. Other SDL mechanisms can represent additional interaction patterns, but the model should follow the semantics defined by the applicable SDL-2010 language features.
Behavioral representation of processes
Each Process within an SDL diagram is depicted as a finite-state machine, capturing the dynamic behavior of system components. These state machines consist of various States and Transitions:
States: Conditions or situations during the lifecycle of a process.
Transitions: The movements between states, triggered by events or signals.
This behavioral representation allows for a detailed understanding of how processes respond to different inputs and how they evolve over time, which is crucial for designing responsive and reliable systems.
By utilizing these structural and behavioral elements, SDL diagrams provide a comprehensive framework for modeling complex systems, ensuring clarity in design and communication among stakeholders.
Importance of SDL Diagrams in System Modeling
SDL diagrams play a crucial role in system modeling by providing a clear and structured way to represent complex, real-time, and event-driven systems. They help in visualizing system components, their interactions, and behaviors, leading to better design, analysis, and communication among stakeholders.
Key benefits of SDL diagrams:
Enhanced communication: By offering a standardized visual representation, SDL diagrams bridge the gap between technical and non-technical stakeholders, ensuring that everyone has a clear understanding of the system’s structure and behavior.
Efficient design and analysis: SDL diagrams allow designers and analysts to model system components and their interactions effectively, facilitating the identification of potential issues and optimization opportunities early in the development process.
Support for validation and testing: A sufficiently complete, conforming SDL model can be analyzed or simulated with specialized SDL tools. This can help test behavior against requirements, but a diagram image or informal SDL-style sketch is not executable by itself.
Maintained technical documentation: SDL diagrams can connect structural and behavioral specifications in a form engineers can review. Assigning model ownership and updating the source when interfaces or behavior change helps keep it useful over time.
When to Use SDL Diagrams
SDL diagrams are particularly useful in scenarios where clear communication and precise system behavior descriptions are essential. Here are some instances when SDL diagrams are especially beneficial:
1. Service creation
SDL diagrams assist in defining and designing services by capturing user requirements and specifying system behavior. They provide a visual representation that aids in understanding and developing the desired functionalities of a service.
2. System validation
During validation, an SDL specification can provide expected behavior for reviews, test design, or supported tool-based analysis. Results must still be compared with implementation evidence; the model alone does not prove that the system meets every requirement.
3. Behavior specification
SDL diagrams are effective in detailing the behavior of reactive and distributed systems. They allow developers to specify and document system behaviors clearly, facilitating better design and implementation.
4. Communication system design
In communication-system design, SDL provides defined syntax and semantics for describing structure, message exchanges, states, and transitions. Interoperability and reliability still depend on correct requirements, implementation, testing, and conformance—not the notation alone.
5. Simulation and testing
Conforming SDL models can be simulated or analyzed with specialized tools before implementation. Teams can use these results to investigate behavior and design tests, while recognizing that tool support and model completeness determine what can actually be verified.
Who Can Use the SDL Diagram
Specification and Description Language diagrams are valuable tools used to model and specify the behavior of complex, real-time, and event-driven systems. They are particularly beneficial for professionals involved in designing, developing, and analyzing such systems. Here’s who can effectively utilize SDL diagrams:
1. Software engineers and developers
SDL diagrams assist software engineers in designing system architectures, specifying component interactions, and ensuring that system behaviors align with requirements. They provide a clear visual representation of complex systems, aiding in both development and troubleshooting.
2. System architects
System architects can leverage SDL diagrams to define and document the structure of complex systems. These diagrams help in visualizing how different system components interact, which is crucial for designing scalable and efficient architectures.
3. Telecommunications professionals
Given SDL’s origins in the telecommunications industry, professionals in this field use SDL diagrams to model communication protocols and network behaviors. This ensures that systems meet the stringent reliability and performance standards required in telecommunications.
4. Embedded systems designers
Designers working on embedded systems can utilize SDL diagrams to represent the behavior of hardware-software interactions. This aids in ensuring that embedded systems function correctly within their real-time constraints.
5. Quality assurance and testing teams
QA professionals use SDL diagrams to understand expected system behaviors, design test cases, and validate that implementations conform to specifications. This contributes to the delivery of reliable and robust systems.
6. Educators and researchers
In academic settings, SDL diagrams serve as effective teaching tools for illustrating system modeling concepts. Researchers also use them to document and communicate complex system behaviors and architectures.
SDL Diagram vs State Diagram
SDL diagrams and state diagrams both describe behavior, but they operate at different modeling scopes and use different language definitions.
SDL diagram: comprehensive system modeling
SDL combines hierarchical structure with communicating extended finite-state machines. A model can describe systems, blocks, concurrent processes, channels, signals, data, timers, and the state-based behavior inside each process. It is defined by the ITU-T Z.100 series and was designed primarily for reactive, message-based systems.
State diagram: detailed behavioral analysis
A state diagram focuses on states and transitions for a particular object, component, or system boundary. UML state machine diagrams are one widely used form, but “state diagram” can also refer to other state-machine notations with different semantics.
Key differences:
Scope: SDL can connect system structure, concurrent process behavior, and message communication; a standalone state diagram usually concentrates on the lifecycle of one modeled subject.
Communication: SDL explicitly models signals and channels between agents. A state diagram may show triggering events but does not necessarily define a complete communication architecture.
Standard: SDL is defined by the ITU-T Z.100 series. UML state machines are defined as part of the OMG UML specification.
Choose SDL when the specification must connect distributed structure and message-driven behavior. Choose a state diagram when the main need is to explain the state lifecycle of a particular component.
How to Use Creately to Make SDL Diagrams
Creately’s flowchart software can be used to draft, explain, and collaboratively review SDL-style system diagrams. It is a visual documentation workspace, not a substitute for a conforming SDL compiler, simulator, semantic validator, or code generator. Use a specialized SDL tool when formal Z.100-series conformance or executable-model analysis is required.
1. Pre-built SDL shapes and symbols
Start with the available SDL templates and shapes for blocks, processes, states, signals, inputs, outputs, and transitions. Confirm every symbol against the SDL subset and organizational convention used by the project, particularly when adding general-purpose documentation shapes.
2. Drag-and-drop interface
Arrange the system hierarchy and process behavior visually. Keep system, block, and process boundaries clear, and label states, signals, channels, transitions, decisions, and timers consistently.
3. Smart connectors for clear flow representation
Use attached connectors to keep signal routes and transition flows connected as elements move. Connector behavior helps maintain the visual layout, but it does not validate SDL syntax, signal routing, or behavioral semantics.
4. Collaboration and real-time editing
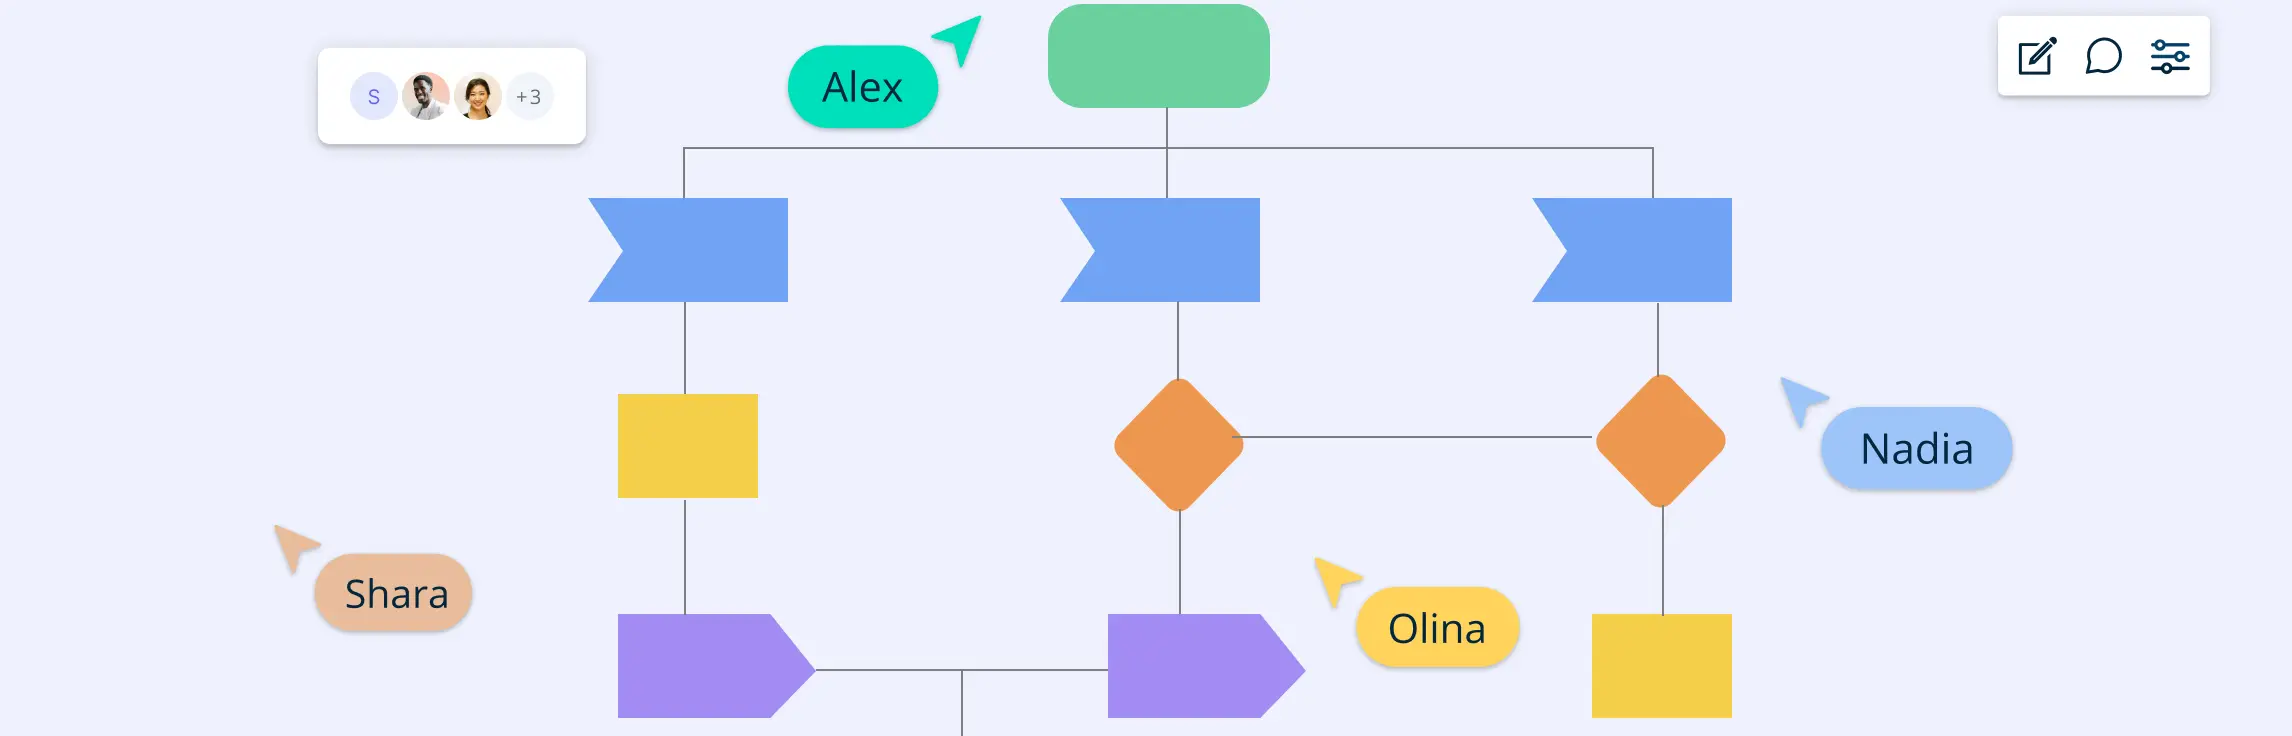
System owners, architects, developers, and testers can edit together, see collaborators on the canvas, and use contextual comments to discuss a particular state, signal, interface, or handoff. The accountable model owner can incorporate agreed feedback and keep the source current.
5. Data-linked diagramming
Keep notes, links, requirements, interface specifications, and file attachments connected to relevant diagram elements. This supporting context makes the diagram more useful as living technical documentation. Formal SDL model data must still be defined through the applicable SDL grammar and tooling.
6. Presentation and sharing tools
Use presentation mode or a shared link to walk stakeholders through different parts of the model. Export options include PNG, PDF, and SVG, depending on the plan. Treat exports as snapshots and maintain the shared source diagram as the current reference.
7. Integration with other tools
Embed or link the diagram where teams manage requirements, design discussions, or technical documentation. Confirm that Creately currently supports the chosen destination and use an embed or shared link when a native integration is unavailable.
Conclusion: What Is a SDL Diagram
SDL provides a defined language for describing the structure and behavior of reactive, message-based systems. Its hierarchy, communicating processes, signals, channels, states, transitions, and timers can help teams reason about complex interactions. Use collaborative diagrams for explanation and review, and use conforming SDL tools when formal syntax, simulation, or semantic analysis is required. Assign an owner and keep the source model connected to current requirements and interfaces as the system evolves.
References
Fonseca, P. (2006). TRANSFORMING SDL DIAGRAMS IN A DEVS SPECIFICATION. Modelling, Simulation, and Optimization. [online] doi:https://doi.org/10.13140/2.1.4973.9528.