Most organizational design decisions are made in the dark, trapped between static slide decks that hide real impact and live HRIS systems where a single accidental “save” can trigger company-wide panic. This “risk gap” forces leadership teams to choose between committing to a restructure too early or debating endlessly over spreadsheets that can’t visualize reporting depth or span of control. This guide explores how scenario planning replaces guesswork with a “digital twin” of your company—allowing you to model complex reorg planning, visualize structural “deltas,” and test every “what-if” in a secure sandbox before making a single official change.
What Is Scenario Planning in Organizational Design?
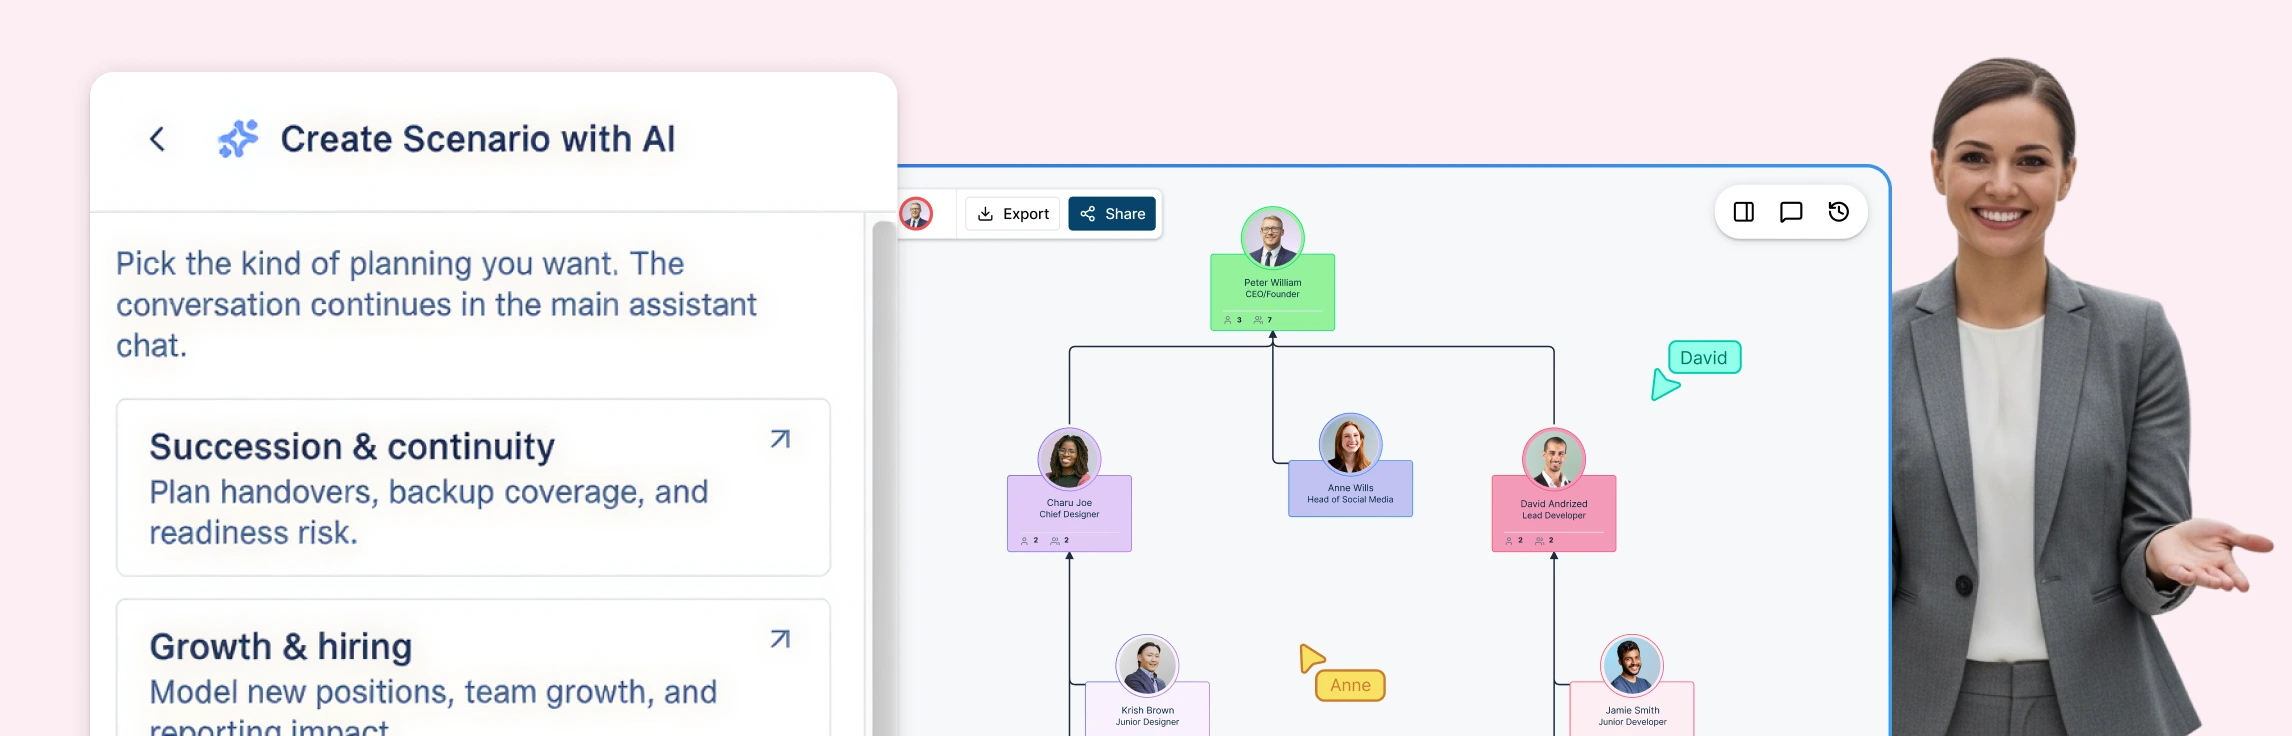
In the context of organizational design, scenario planning is the process of creating “what-if” models of your company structure to test changes before they are implemented. Instead of editing your live org chart and risking confusion or data loss, scenario planning allows you to branch off into a sandbox environment.
Think of it as a digital twin of your organization. You can experiment with different reporting lines, team consolidations, or expansion plans to see exactly how they impact your span of control and management depth.
When Do You Need Scenario Planning for Organizational Restructuring
In organizational design and structure, the stakes are highest when the “human architecture” of the company is in flux. Any shift in how people, teams, or reporting lines interact requires more than a vision—it requires a blueprint that can be stress-tested.
Scenario planning becomes essential during these high-stakes transitions:
- Organizational Restructures & Reorgs: When you need to move beyond theory to shift roles, redesign entire departments, or overhaul reporting lines across the enterprise.
- Mergers and Acquisitions (M&A): When two distinct cultures and structures must be integrated. Scenario planning allows you to model “Day 1” vs. “Day 100” with minimal disruption and maximum clarity.
- Rapid Growth or Scaling: When your current structure is “breaking.” Use scenarios to map where new roles fit cleanly into the existing hierarchy without creating silos.
- Leadership Transitions: When changes at the top redefine accountability and ownership. Scenario modeling helps visualize the “ripple effect” of new management styles or delegated responsibilities.
- Cost Reduction & Efficiency Initiatives: When you are tasked with adjusting headcount or management layers. Scenarios allow you to model span of control changes to ensure efficiency doesn’t come at the cost of operational stability.
8 Types of Organizational Design
Choosing the right organizational design framework is one of the most critical decisions during a restructure. Each design determines how work flows, how authority is distributed, and how teams collaborate. Scenario planning is especially valuable here because it allows leadership teams to model these structures, compare trade‑offs, and understand downstream impact before committing to change.
Below are eight common organizational design types and the situations they are best suited for.
Functional Structure
A functional structure organizes the company into departments based on specialized functions such as marketing, finance, operations, and human resources. Each function is led by a department head who oversees execution within their area and reports into senior leadership.
This model works well for organizations that value deep specialization and operational efficiency. Clear role definitions and ownership improve accountability and consistency. However, functional structures can create silos that slow cross‑team collaboration and limit visibility into broader organizational objectives. Scenario planning helps leaders test how functional boundaries impact speed, coordination, and decision‑making.
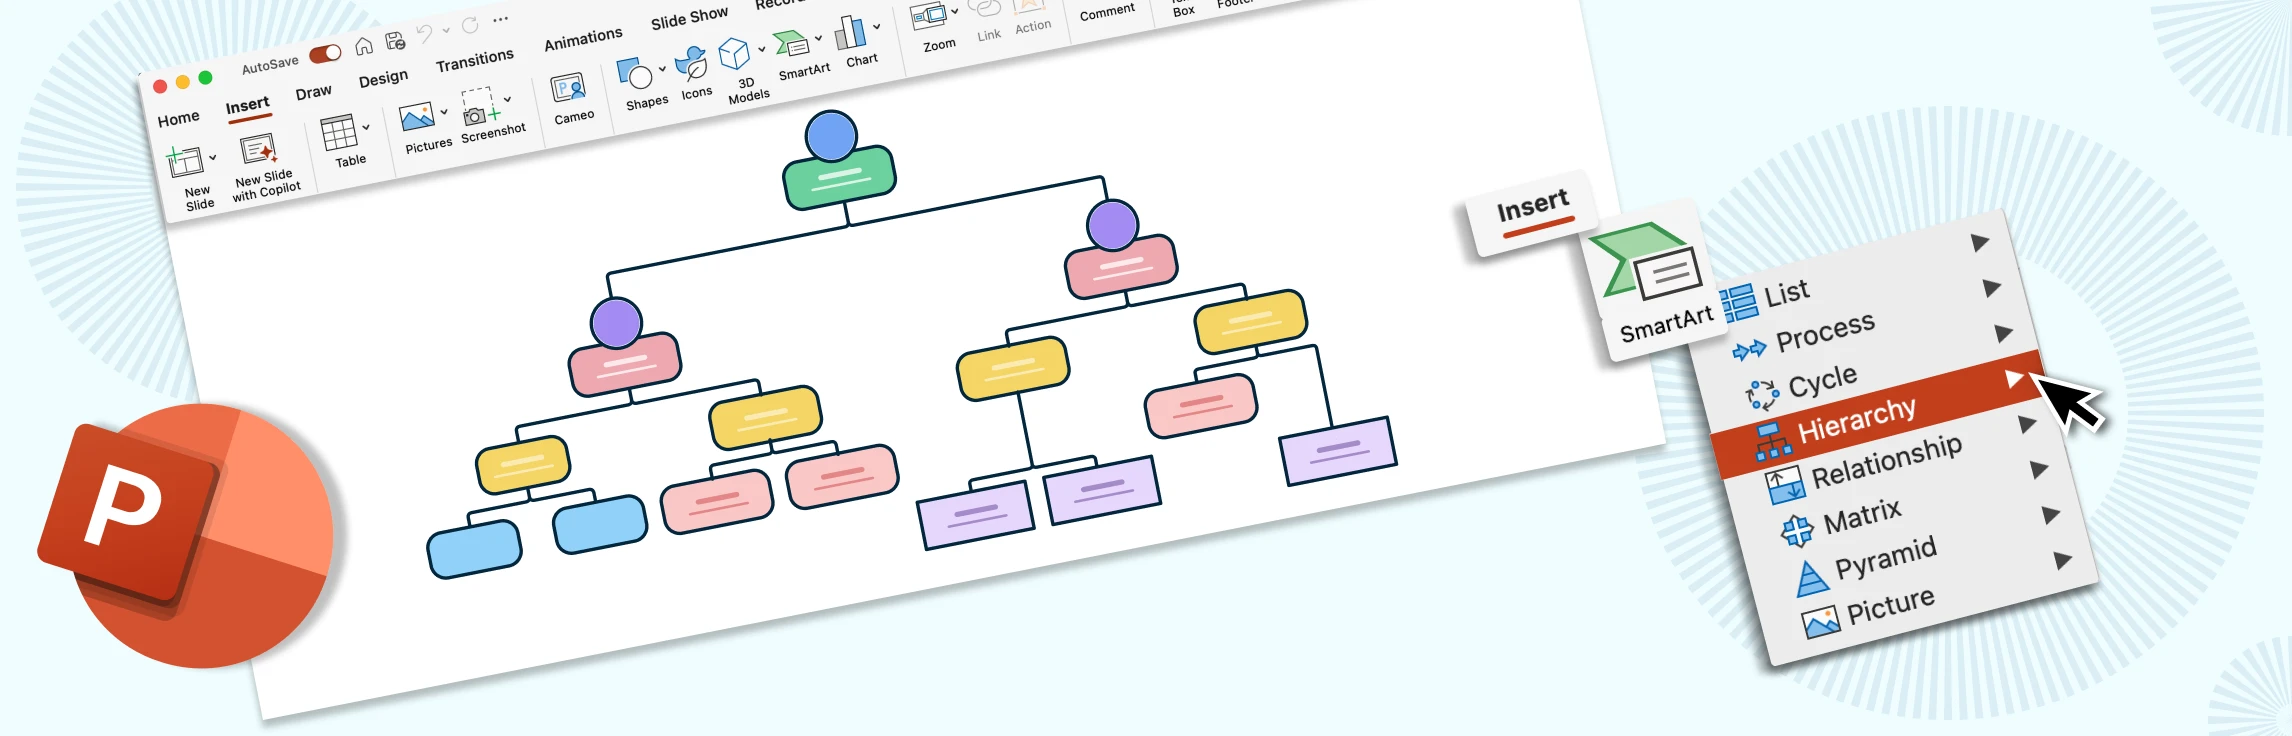
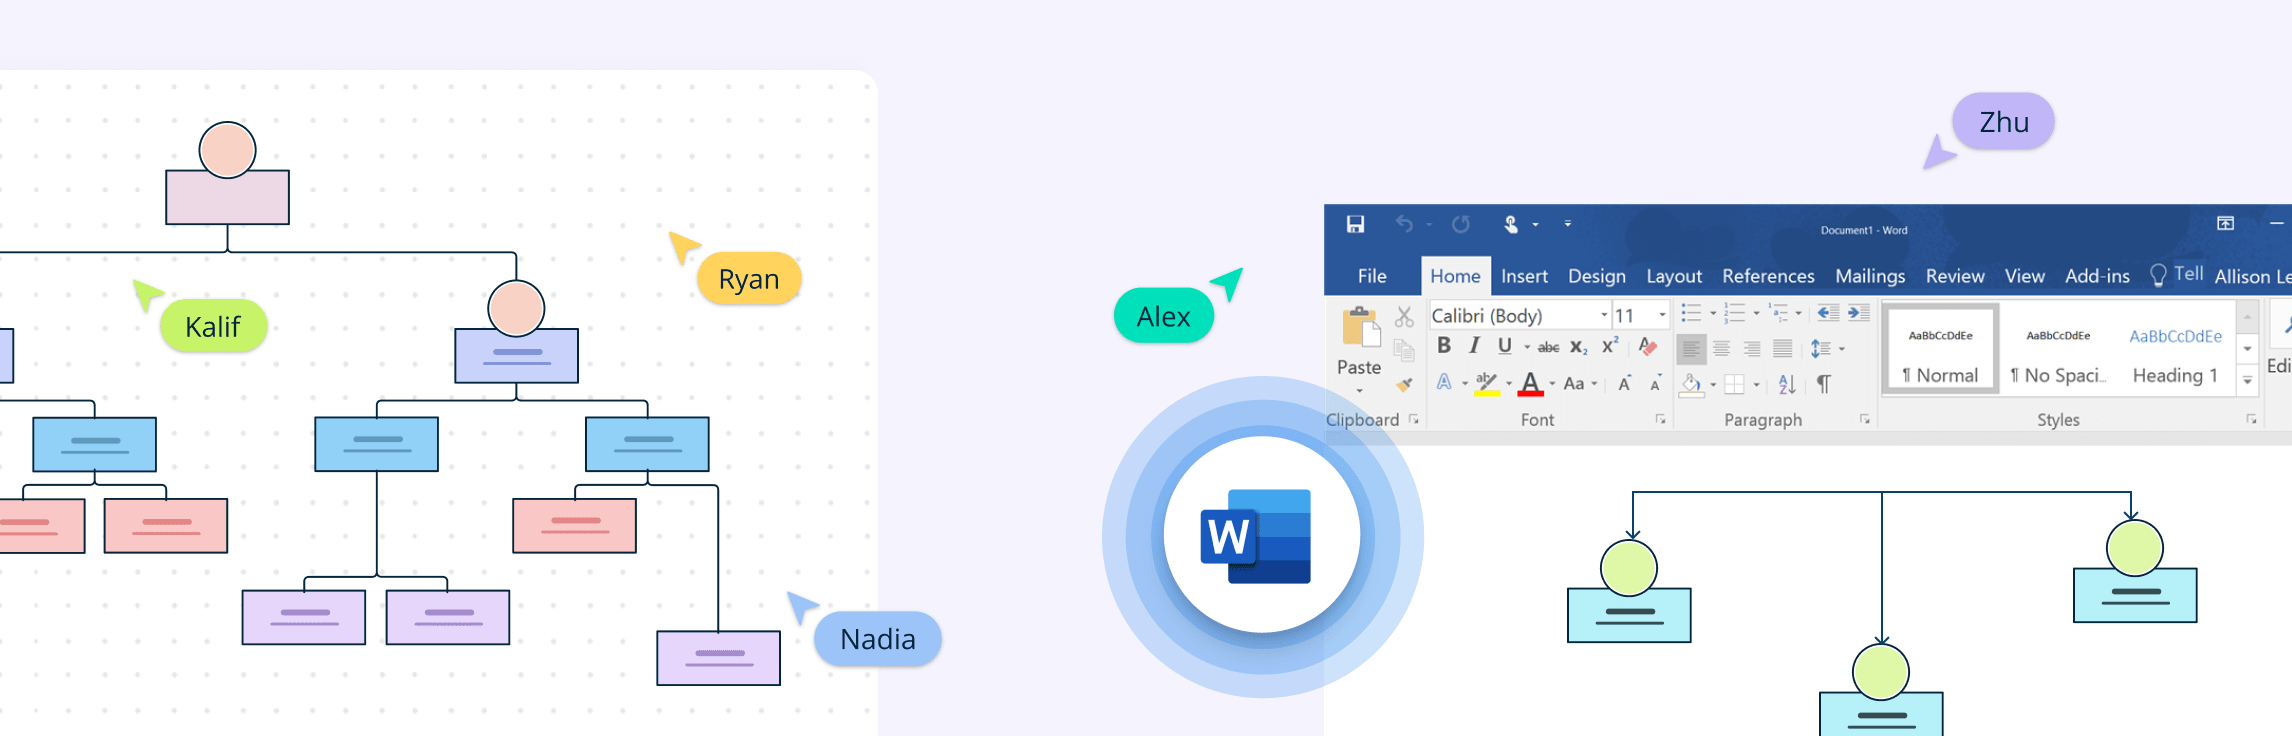
Hierarchical Structure
A hierarchical structure follows a clear top‑down chain of command, with authority flowing from senior leadership through multiple management layers to individual contributors.
This design provides clarity around responsibility, reporting lines, and career progression. It is commonly used in large or regulated organizations where control and predictability matter. The downside is reduced flexibility—hierarchies can be slow to adapt, and communication may weaken across layers. With scenario planning, organizations can safely explore reducing layers or redistributing authority without disrupting the live org.
Flat Structure
A flat structure minimizes management layers, often removing middle management entirely. Teams operate with greater autonomy, and decision‑making is more decentralized.
Flat organizations tend to be more agile and foster higher employee engagement. At the same time, limited hierarchy can lead to unclear ownership, wide spans of control, and scaling challenges as the organization grows. Scenario planning allows teams to test when and where additional structure becomes necessary.
Divisional Structure
In a divisional structure, the organization is split into semi‑autonomous units based on product lines, markets, or geographic regions. Each division typically includes its own functional teams.
This model enables divisions to focus closely on their customers or markets and adapt quickly to change. Accountability is clearly defined at the division level. However, resources and roles may be duplicated across divisions, increasing cost. Scenario planning helps leaders evaluate consolidation opportunities and shared‑service models before making structural changes.
Matrix Structure
A matrix structure blends functional and divisional models. Employees report to both a functional manager and a project, product, or regional manager.
This approach allows organizations to allocate talent dynamically and encourages cross‑functional collaboration. However, dual reporting lines can introduce confusion, competing priorities, and power conflicts. Scenario planning is essential for visualizing reporting relationships, identifying overlap, and stress‑testing spans of control before implementation.
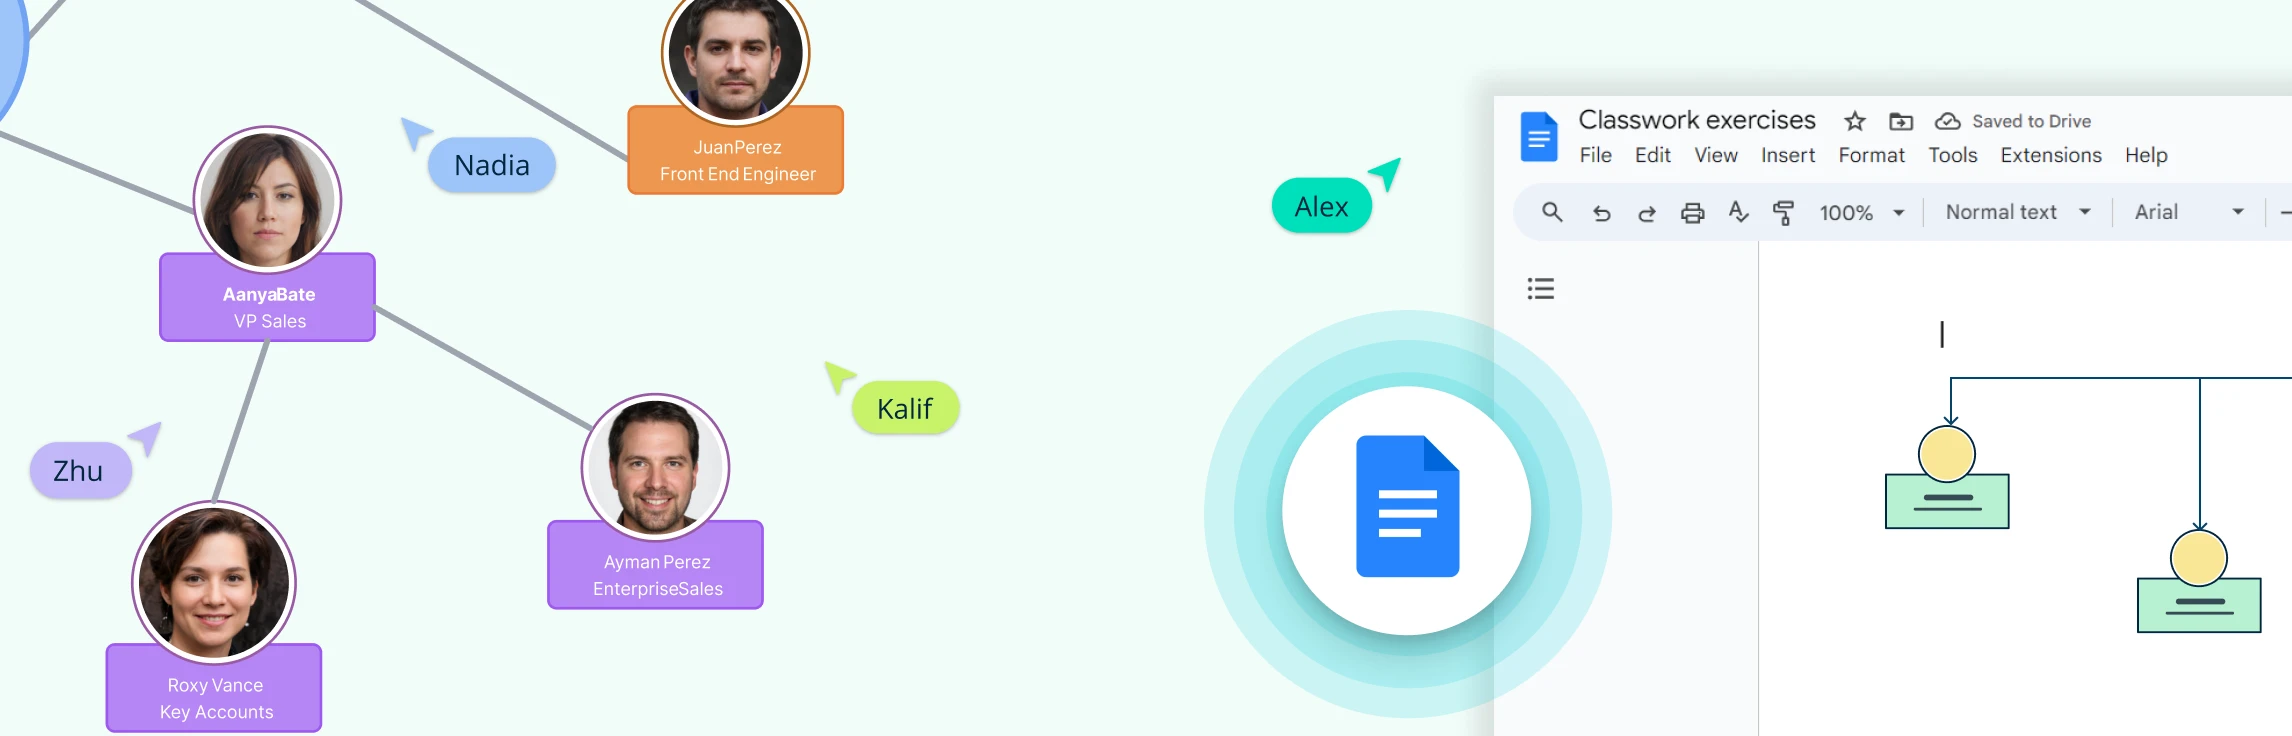
Network Structure
A network structure centers on a core organization that outsources non‑core activities to external partners, vendors, or contractors. The organization operates as a hub within a broader ecosystem.
This model offers high flexibility and cost efficiency, allowing teams to focus on core capabilities. The trade‑off is reduced control and increased reliance on third parties. Scenario planning helps organizations determine which functions should remain internal and how external dependencies affect accountability and performance.
Virtual Structure
A virtual structure supports a geographically distributed workforce that relies heavily on digital tools for communication and collaboration. Teams operate across locations, time zones, or regions.
Virtual organizations gain access to global talent and reduce physical infrastructure costs. Challenges include coordination, communication clarity, and maintaining engagement. Scenario planning enables leaders to model reporting lines, leadership coverage, and collaboration patterns in remote or hybrid environments.
Process‑Based Structure
A process‑based structure organizes the company around end‑to‑end workflows rather than traditional functions. Cross‑functional teams are aligned to key processes that deliver value to customers.
This design improves efficiency, reduces handoffs, and keeps the organization focused on outcomes. It can be complex to implement and often requires a cultural shift away from role‑based thinking. Scenario planning allows teams to map processes visually, test ownership models, and identify coordination gaps before rolling out changes.
By modeling these organizational designs as scenarios, leadership teams can compare alternatives, anticipate risks, and select a structure that aligns with strategy, scale, and future growth—without committing too early.
How Creately’s Scenario Planning Works
Creately’s scenario planning workflow mirrors how real-world organizational design decisions are made—iteratively, collaboratively, and safely. By treating your org chart like a “branchable” codebase, you can test complex reorg planning ideas without impacting your live data.
Step 1: Start from your live org chart
Begin with your current “Source of Truth” or a previously saved version. You can import your existing structure via CSV—using AI-powered column mapping to instantly sync reporting lines—or use Time Travel to ground your scenario in a historical state.
Step 2: Create a scenario branch
Create a separate, named scenario where all changes are isolated. Your live org remains untouched, and you can create multiple parallel scenarios to compare different organizational restructuring strategies.
Step 3: Model structural changes
Within the scenario, you can move people, add or remove roles, and merge teams without risk. You can even use the AI Assistant to execute changes via natural language, such as “Move Alice’s reports to Bob” or “Remove the VP layer”.
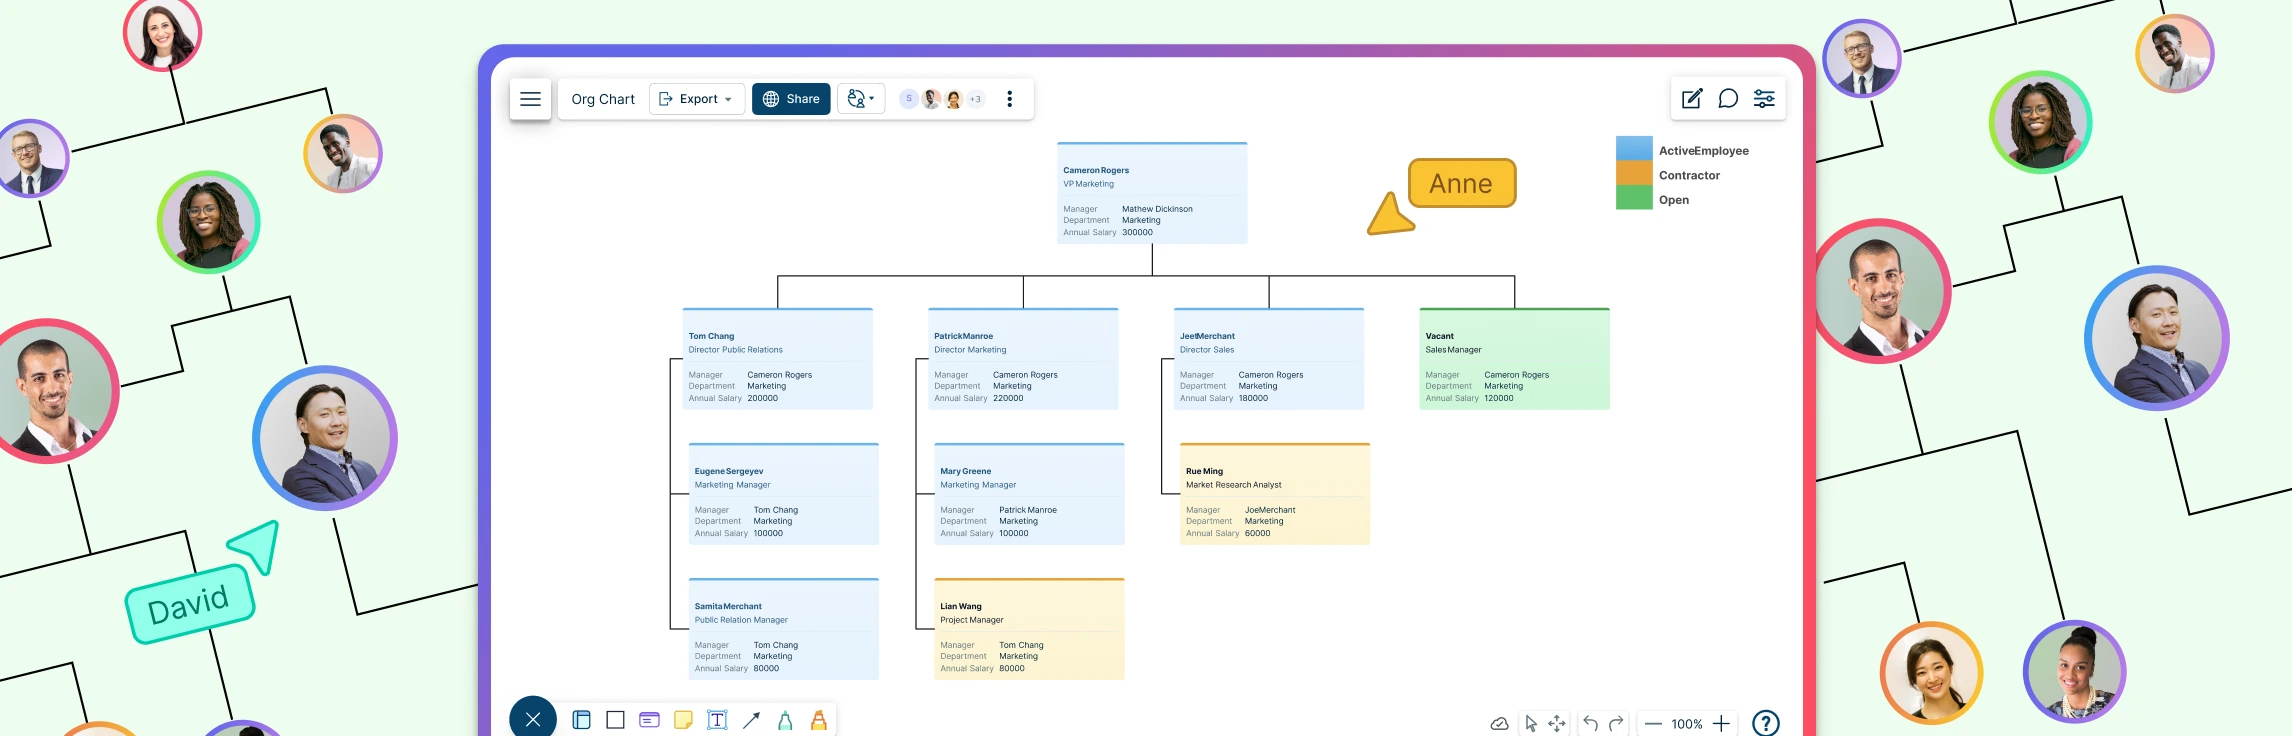
Step 4: View the “Delta”
Creately uses delta-based tracking to automatically highlight exactly what has changed between the current state and your proposal:
- Green: Newly added roles or positions.
- Red: Removed roles or departures.
- Yellow: Moved people, redefined reporting lines, or updated field data.
Step 5: Compare “Before and After”
View the current org and the proposed scenario side-by-side to instantly understand the impact on your structure. The ELK layout engine ensures that even as you move entire departments, the connectors and spacing adjust automatically to prevent overlapping nodes.
Step 6: Share with leadership
Share scenarios using read-only links for executive review. Because of the 6-tier sensitivity model, you can include sensitive data—like compensation impact or succession risk—knowing that only authorized HR leadership will see those specific fields.
Step 7: Apply when approved
Once alignment is reached, apply the scenario to the live chart. This merges your changes into the official record, making the scenario your new “Source of Truth”.
Common Reorg Scenarios You Can Model
Scenario planning is designed for high-stakes organizational restructuring, not just theoretical mapping. Each scenario exists as an independent, delta-based “what-if” branch, allowing your team to compare multiple strategic paths before choosing the best way forward.
Flattening the Organization
As organizations scale, they often become top-heavy. Use scenarios to model the removal of specific management layers.
- Visual Impact: Instantly see how spans of control shift across the remaining teams.
- AI Insight: The AI assistant can proactively flag managers who now have more than 12 direct reports, identifying potential bottlenecks in your new, flatter structure.
Team or Department Merges
Redesigning how departments interact is critical for operational efficiency.
- Consolidation: Combine two departments into a single entity and use the delta view to identify duplicate roles (marked in yellow or red).
- Clarity: Visualize new reporting lines immediately to ensure cross-functional teams have clear accountability.
M&A Integration
Integrating an acquired company is a complex “Day 1” challenge.
- Mapping: Import the acquired company’s org chart via CSV and model various integration approaches side-by-side.
- Conflict Resolution: Identify where role equivalencies exist and model how the two different cultures and hierarchies can merge with minimal disruption.
Cost Reduction & Efficiency Planning
When tasked with reducing headcount, precision is vital to maintain operational stability.
- Impact Analysis: Remove or consolidate roles within a scenario and analyze the “ripple effect” on leadership balance and team coverage.
- Financial Modeling: If you have the Compensation field pack active, you can model the total cost impact of these changes—visible only to those with HR Confidential access.
Growth & Capacity Planning
Scenario planning isn’t just for reductions; it’s for scaling.
- Future-Proofing: Add “unstaffed” positions and future roles to show leadership exactly how new hires will fit into the existing structure.
- Budgeting: Calculate hiring budgets by band and location within the scenario to present a fully-funded growth map to Finance.
Creately Org Chart Templates to Get Started


Before and After Analysis: Measuring Reorg Impact
Effective organizational design is defined by measurable outcomes, not just aesthetic changes to a chart. Creately transforms reorg planning from a subjective exercise into an evidence-based discipline by providing real-time analytics on your proposed changes.
As you modify your scenario, the system tracks key structural metrics to ensure your new design aligns with business goals:
- Changes in Span of Control: Instantly identify if a manager’s direct report count has become unmanageable or if a department has become too “top-heavy”.
- Management Layer Depth: Visualize the “distance” between the CEO and front-line employees to identify opportunities for flattening the hierarchy and speeding up decision-making.
- Headcount by Department: Track real-time shifts in personnel distribution to ensure resources are allocated to high-priority growth areas.
- Cost Impact Analysis: When the Compensation field pack is active, you can model the exact financial delta of your reorg, comparing total salary and bonus commitments between the “current” and “proposed” states.
By quantifying these shifts, HR leaders can move beyond “how it looks” to “how it performs,” presenting leadership with a data-backed rationale for every move.
Presenting Reorg Scenarios to Leadership
Organizational restructuring is as much about managing people as it is about managing data. Presenting these changes requires a high degree of trust, clarity, and, above all, confidentiality. Creately enables HR leaders to move from static presentations to dynamic, secure alignment sessions through several key features:
- Sensitivity-Based Sharing: Use the 6-tier data sensitivity model to ensure that stakeholders only see what is relevant to their role. For example, while a CEO may review a scenario with full compensation and succession data, a department manager viewing the same link will only see names and titles, keeping sensitive PII and financial data invisible.
- Clear Side-by-Side Comparisons: Avoid the confusion of “before and after” slide decks. Use a split-view to show the live org chart alongside the proposed scenario, making the structural impact of every move immediately obvious to leadership.
- Exportable Delta Reports: For board meetings or formal documentation, export your scenarios as PDFs or high-resolution SVGs. These reports capture the “visual diff,” providing a permanent record of the intended changes and the rationale behind them.
- Time-Travel Comparisons: Build context by setting an as-of date to show how the organization has evolved. Comparing the org as it was six months ago to your proposed future helps leadership understand the long-term trajectory of the company’s growth or restructuring.
By providing these tools, Creately reduces the friction of the approval process, ensures data remains secure, and builds the executive alignment necessary for a successful transition.
Creately vs ChartHop vs OrgVue vs PowerPoint: Feature Comparison
| Feature | Creately | ChartHop | OrgVue | PowerPoint |
|---|---|---|---|---|
| Scenario branching | ✓ (delta‑based) | ✓ | ✓ | ✗ |
| Before/after visual diff | ✓ | Limited | ✓ | Manual |
| Impact analysis (span, cost) | ✓ | ✓ | ✓ | ✗ |
| Share with sensitivity | ✓ (6‑tier) | Role‑based | Role‑based | None |
| AI‑assisted planning | ✓ | ✗ | ✗ | ✗ |
| Price | $5/emp/year | $8/emp/month | Custom | Free |
Reorgs don’t have to be risky guesses or slide‑deck debates. With Creately’s scenario planning, teams can model change safely, compare options clearly, and make confident organizational design decisions.
Helpful Resources
Build, analyze, and plan org structures with Creately’s workforce planning tool.
Explore what is workforce planning with dynamic org charts.
Learn how to plan organizational restructures using scenario planning.
Explore rules for drawing organizational charts and org chart best practices to make your org chart more meaningful and useful.
Plan reorgs, visualize reporting structures, and collaborate using Creately’s org chart software.
Step-by-step guide to creating org charts that scale with your organization.