Want clearer project timelines and fewer surprises? Network diagrams and the critical path method (CPM) help you visualize how tasks connect, depend on one another, and ultimately drive your project schedule. A network diagram maps the flow of work, while the critical path — the longest chain of dependent tasks — defines the shortest possible project duration. Since any delay on this path delays the entire project, understanding these tools is essential for realistic planning, early risk detection, and staying on track.
What Is a Network Diagram in Project Management?
A network diagram in project management shows project activities and the dependencies between them in a visual format. Instead of a flat task list, it illustrates how work flows from start to finish and which tasks rely on others.
Activities are shown as nodes or arrows, with connections indicating dependency relationships. This makes it easier to see task order, parallel work, and constraints at a glance.
In practice, network diagrams help project managers quickly understand schedule logic and prepare for critical path analysis.
Types of network diagram styles:
Activity-on-node (AON): Modern, widely used, nodes = tasks, arrows = dependencies
Activity-on-arrow (AOA): Older style, arrows = tasks, nodes = events, less common today
Understanding task dependencies
In real projects, tasks rarely stand alone. Most activities depend on other work being started or completed first. Network diagrams capture these rules through task dependencies.
The most common dependency types used in project management are:
Finish-to-start, where one task must finish before the next can begin
Start-to-start, where two tasks can begin at the same time
Finish-to-finish, where tasks must complete together
Start-to-finish, which is less common and used in specific scenarios
Understanding these relationships ensures proper sequencing so that downstream work doesn’t start too early or too late.
Using a Network Diagram to Calculate the Critical Path for a Project
Once your network diagram is ready, you can use it to calculate the project’s critical path. This turns your diagram from a simple plan into a powerful schedule analysis tool. Here’s how it works:
Visualize task flow and dependencies: The CPM network diagram shows all tasks and how they relate to each other, helping you see which activities must happen first and which can run in parallel.
Trace all paths through the project: Each sequence of dependent tasks from start to finish forms a path. By looking at all paths, you can analyze which sequences take the longest.
Add up task durations: Calculate the total time for each path by summing the durations of tasks along it.
Identify the longest path: The path with the longest total duration is the critical path. Any delay in these tasks will delay the overall project.
Focus on schedule-sensitive tasks: The critical path highlights the tasks that control the project’s finish date. These are the activities that need the most monitoring and careful resource allocation.
Create a reliable project timeline: Using the network diagram and critical path together gives you a timeline that reflects both task dependencies and durations, making planning more accurate and actionable.
What Is the Critical Path Method (CPM) in Project Management?
The critical path method is a scheduling technique used in project management to determine the longest sequence of dependent tasks — the critical path — and to calculate the shortest possible time to complete the project.
In simple terms:
The critical path is the longest path of tasks in the CPM network.
It determines the minimum project duration.
Any delay in a critical path task will delay the entire project.
Tasks on this path have zero float (slack), meaning there’s no wiggle room in their schedule.
Network diagram critical path helps project managers focus on what matters most for meeting deadlines and managing resources efficiently.
Why the critical path matters in project management
Identifying the critical path gives you powerful insights into your project:
It tells you what determines your total schedule.
It shows where you have no flexibility — tasks with zero slack must stay on time.
It highlights what needs the most monitoring and control.
If the project’s calculated duration is longer than desired, you can use this information to consider changes, adjust resources, or negotiate deadlines.
How to Identify the Critical Path in a Network Diagram
Identifying the critical path in a network diagram involves a few systematic steps that combine task sequencing with time analysis. Here’s a clear method you can follow:
Step 1. List all tasks and duration estimates
Start by identifying every activity in the project and estimating how long each will take. These estimates should be realistic, based on past data, team input, or scheduling experience.
Step 2. Build the network diagram
Arrange the tasks into a network using nodes (or boxes) for tasks and arrows to show dependencies. This produces a visual map of task relationships.
Step 3. Perform a forward pass
Starting from the project’s first task, calculate the earliest start (ES) and earliest finish (EF) times for each activity. Move from left to right across the network, adding task durations and following dependency rules. The earliest times show how soon work can begin and end if everything goes according to plan.
Step 4. Perform a backward pass
Starting from the project end, calculate the latest finish (LF) and latest start (LS) times for each task by moving from right to left through the network. This determines how late each task can occur without delaying the overall project.
Step 5. Calculate float (slack)
For each task, compute float by subtracting its earliest start from its latest start (or earliest finish from latest finish). Float represents how much a task can be delayed before it affects the schedule.
Step 6. Identify tasks with zero float
The tasks that have zero float are those that cannot be delayed without delaying the project. These tasks are the backbone of the project schedule.
Step 7. Trace the longest path
Connect the tasks with zero float from start to finish — this sequence forms the CPM network. It also represents the longest total duration through the network.
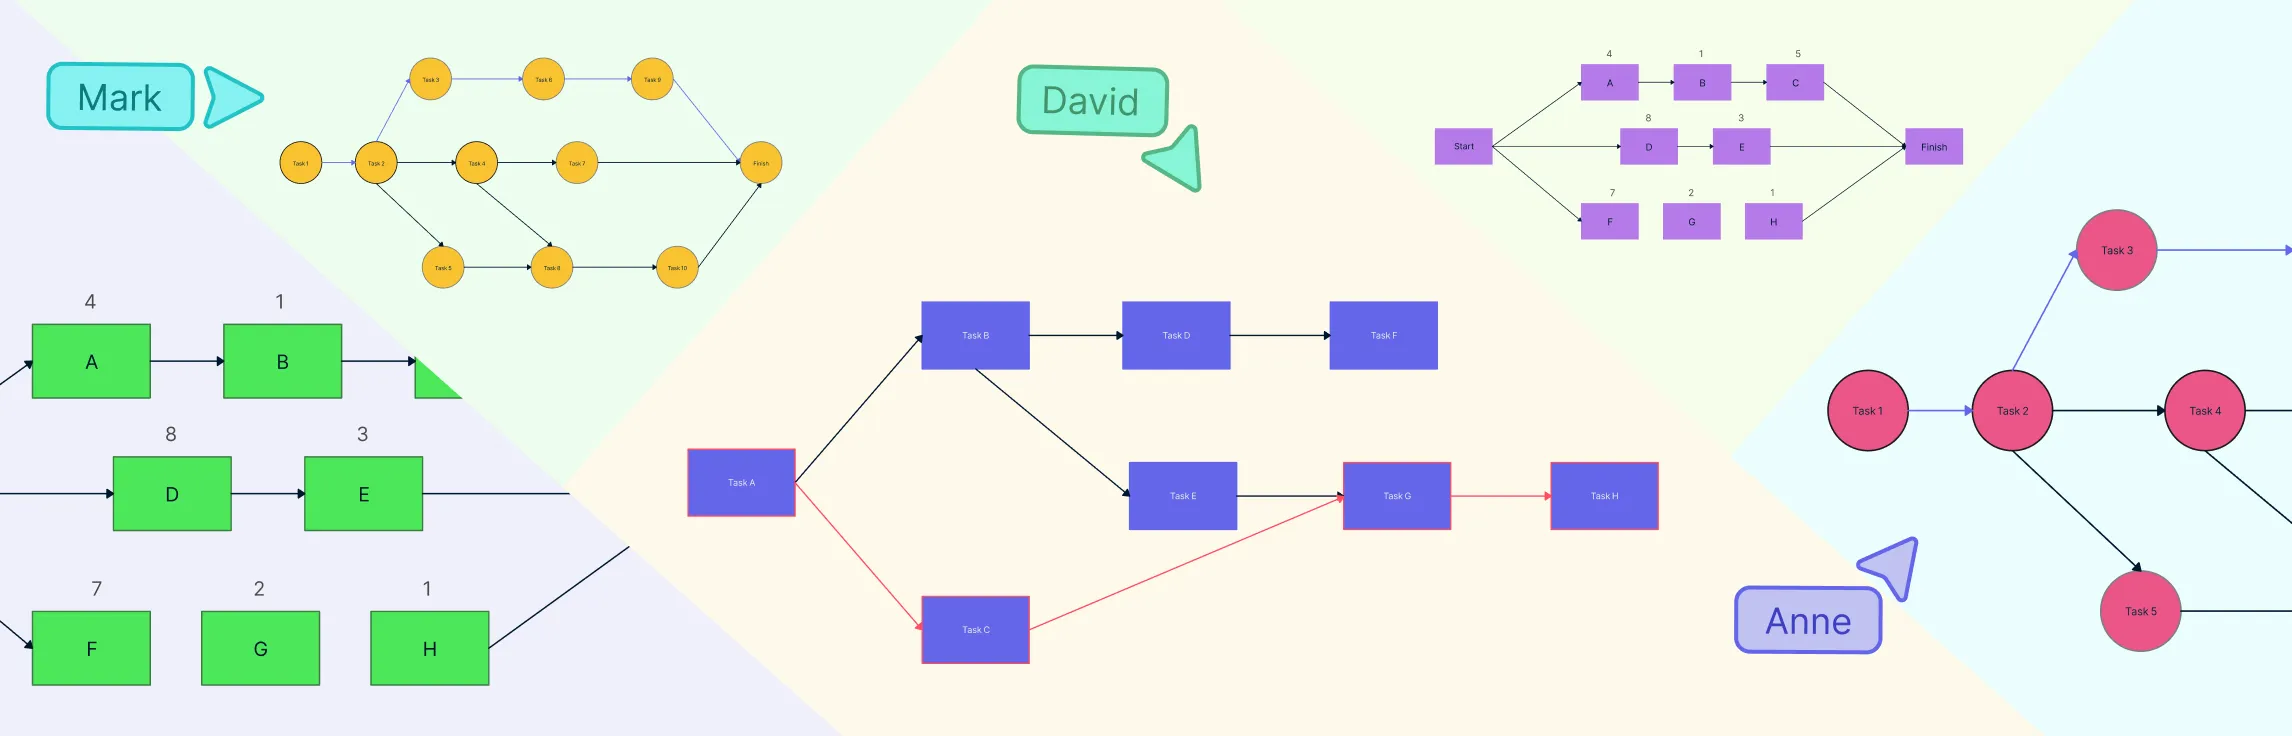
Examples of Critical Path and Network Diagrams in Project Management
AON Network Diagram with a Sequence of Activities


AOA Network Diagram

AON Network Diagram

Critical Path Method Diagram

Critical Path Diagram

Activity On Node Diagram

How Network Diagrams and CPM Support Project Management
When used together, network diagrams and the critical path method support project management in several practical and meaningful ways:
Schedule planning: They help create realistic project timelines based on actual task dependencies rather than assumptions. By visualizing the logical order of work and analyzing task durations, project managers can determine the true minimum project duration and avoid overly optimistic schedules.
Resource planning: By clearly identifying which tasks fall on the critical path, these techniques show where focused attention, skilled resources, or additional staffing are required. This helps ensure critical activities are properly resourced while allowing flexibility on non-critical tasks.
Risk management: Network diagrams and CPM highlight the tasks where delays will have the greatest impact. Since any delay on the critical path directly affects the project completion date, these tasks become priority risk areas that require closer monitoring and contingency planning.
Communication and alignment: A network diagram provides a shared visual reference that helps teams and stakeholders understand task sequencing, dependencies, and priorities. This makes discussions about schedule changes, trade-offs, and impacts clearer and more productive.
Schedule control: As the project progresses, these tools make it easier to reassess priorities, update task sequencing, and recalculate the critical path when changes occur. This allows project managers to stay in control of the schedule rather than reacting after deadlines are missed.
While network diagrams and CPM are powerful, they have some common challenges: Inaccurate task estimates can lead to unrealistic schedules. Changes in scope or tasks during the project can shift the critical path. Large or complex projects can produce diagrams that are hard to manage manually, making software tools highly recommended. Knowing the critical path helps you:FAQs About Network Diagram and Critical Path Method
Where are network diagrams and CPM used in project management?
What are the common challenges when using network diagrams and CPM?
How are network diagrams built in project management?
Can the critical path change during a project?
What does “float” or “slack” mean in a project schedule?
Do I need special software to create a network diagram?
How does identifying the critical path help with project management?
How do milestones relate to network diagrams and the critical path?
What’s the easiest way to practice creating a network diagram and finding the critical path?