If you have ever stared at a cladogram and felt like you were trying to solve a puzzle without the instructions, you are not alone. It’s a common frustration: you see a series of lines and species, but find yourself asking, “Is a bird more closely related to a crocodile or a lizard?”
This guide will provide a detailed, step-by-step framework for how to read a cladogram with scientific precision. You will learn to navigate the vector of time, identify “Most Recent Common Ancestors” (MRCA) at the nodes, and apply the “Scissors Test” to isolate valid biological groups.
What Is a Cladogram?
A cladogram is a diagrammatic representation of the evolutionary hypotheses connecting different species. Unlike traditional classification systems that might group organisms based on general similarities, a cladogram specifically maps shared derived characteristics to determine common ancestry. Its primary purpose is to illustrate the order in which lineages branched off from one another.
Key Components of a Cladogram
To read a cladogram effectively, you must first understand the four structural elements:
- The Root: This is the base of the diagram, representing the most ancient common ancestor shared by every organism featured in the chart. It establishes the direction of time, flowing from the root toward the tips.
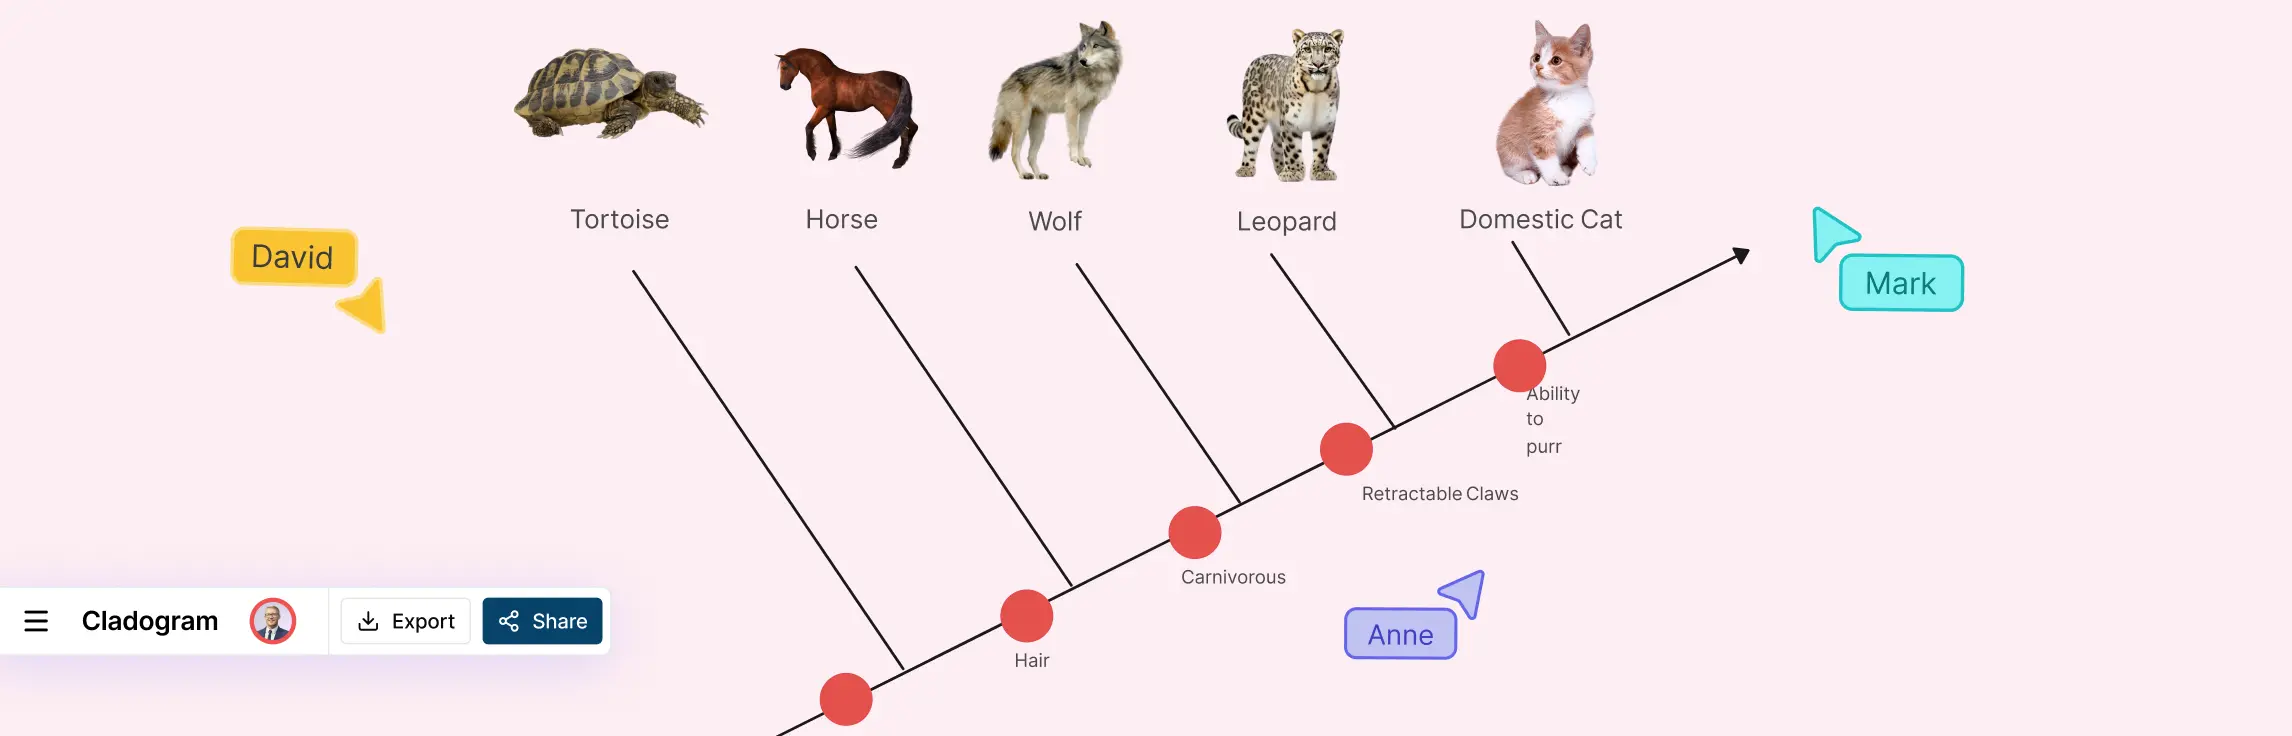
- Nodes (The Branching Points): Every “V” intersection in the diagram is a node. A node represents a speciation event, the exact point where one lineage split into two. It also symbolizes the Most Recent Common Ancestor (MRCA) for all descendant branches.
- Branches: These are the lines that connect nodes. They represent the evolutionary path of a lineage. While the length of a branch in a cladogram doesn’t signify a specific amount of time, the branching order is critical for determining relatedness.
- Clades (Monophyletic Groups): A clade is the “gold standard” of cladistics. It consists of a single node and all of its descendants. If you can imagine “snipping” a branch with a pair of scissors, the entire piece that falls away—ancestor and all—constitutes a single clade.
Reading Cladograms Explained: A 4-Step Analytical Method
Reading a cladogram is less about looking at the “leaves” (the species) and more about understanding the “connections” (the nodes). Follow this 4-step process to extract data like a professional.
Step 1: Orienting at the Root (Relative Sequence, Not Clock Time)
The root serves as the “Common Ancestor” for everyone on the chart. It is the absolute starting point of the story you are reading.
The Vector of Relative Time
While a cladogram isn’t a literal clock, it does have a chronological direction. Time flows from the root (the past) toward the tips (the present or the end of a lineage).
However, it is vital to distinguish between sequence and duration:
- Sequential Logic: The further you move from the root along a specific path, the more recent the evolutionary events. If Point A is closer to the root than Point B on the same branch, the ancestor at Point A existed earlier.
- No “Clock” Speed: Unlike a timeline, the length of the lines does not tell you how many years passed. A long line and a short line could both represent the same amount of time; they simply show the path of descent.
The Outgroup: Establishing a Baseline
To understand which traits are “new,” you must first find the Outgroup.
- Location: This is the branch that splits off closest to the root and sits outside the main group being studied.
- Purpose: Think of the outgroup as a historical “control group.” Because it diverged before the rest of the organisms, it helps researchers identify primitive traits (those shared by the ancestor) versus derived traits (innovations that appeared later in the “inner” group).
Step 2: Decoding the Nodes (Common Ancestry)
If the lines are the paths of history, the nodes are the turning points. A node is any point where a single lineage splits into two or more distinct paths.
1. The Most Recent Common Ancestor (MRCA)
The MRCA is the “intersection” of history. To find the relationship between two groups, you must trace their lines backward toward the root. The very first point where those lines meet is their Most Recent Common Ancestor.
- This point represents the last time those two lineages were part of the same group before they went their separate ways.
2. Quantifying Relatedness: Nodes over Proximity
A common mistake is looking at how close species are to each other at the tips (the top or right side of the chart). Physical proximity at the tips is often a coincidence of how the tree was drawn.
Instead, relatedness is determined by Node Depth:
- Recent Nodes: Two species that share a node closer to the tips have a more “recent” common ancestor. They have had less time to diverge and are therefore more closely related.
- Deep Nodes: Species that only meet at a node closer to the root share a “distant” ancestor. They have spent more time evolving independently and are less closely related.
3. The “Swivel” Rule
Because nodes represent a common ancestor, you can actually rotate the branches at any node without changing the meaning of the diagram.
Think of a node like a mobile or a swivel joint. If you swap the positions of two “sister” species at the tip, their relationship to each other and the rest of the tree remains exactly the same because their shared node hasn’t moved.
Step 3: Interpreting the Branches (Character Mapping)
The lines between nodes are called branches (or internodes). These represent the unique path of a lineage after it has split from its ancestor.
1. Mapping Synapomorphies (Shared Traits)
High-quality cladograms use marks on these branches to denote synapomorphies—traits that are shared by a group but were not present in their distant ancestors.
- The Marker: When you see a trait labeled on a branch, it indicates that the trait evolved at that specific point in history.
2. The Cumulative Rule
Traits are cumulative as you move from the root toward the tips.
- Inheritance: If a trait (e.g., “Feathers”) is marked on a branch, every organism that branches out after that mark is assumed to have inherited that trait.
- Nested Groups: This creates a “Russian Doll” effect. For example, all birds have feathers, but they also inherit the traits marked on deeper branches, such as “Lungs” or “Vertebrae.”
- Secondary Loss: The only exception is a “secondary loss,” where a group later loses a trait (like snakes losing legs). This would be noted with a separate mark further up their specific branch.
3. Identifying Homoplasy (Convergent Evolution)
While the Cumulative Rule usually suggests that a trait is inherited from a single common ancestor, nature often finds the same solution to a problem twice. This is called Homoplasy.
- The Definition: A character shared by a set of species but not present in their common ancestor.
- The Visualization: On a cladogram, homoplasy is shown when the same “tick mark” (e.g., “Wings”) appears on two completely different branches that do not share a recent node.
- The Cause: This is usually the result of convergent evolution—where different lineages evolve similar traits independently because they live in similar environments (like the wings of a bird vs. the wings of a bat).
- **Why it Matters for Analysis: **Homoplasy is a warning to the researcher: Similarity does not always equal relatedness. If you rely only on a single shared trait without looking at the whole tree, you might accidentally group two organisms together that don’t actually belong in the same clade.
4. Branch Meaning: Lines, Not Rulers
It is vital to remember that in a standard cladogram, branch length is arbitrary.
- No Hidden Meaning: A long branch does not mean “more time” or “more evolution” compared to a short branch.
- The Connector: The lines are simply connectors meant to show the topology (the shape) of the relationships. If you stretched or shrank the lines like rubber bands, the “message” of the cladogram would remain exactly the same as long as the nodes stay in the same order.
Step 4: Analyzing Taxa and Clades (The “Clipping” Test)
The final step in reading a cladogram is identifying the groups, or Taxa, at the tips and understanding how they cluster together into Clades.
1. Identifying Sister Groups
The most important relationship on a cladogram is the Sister Group.
- The Definition: Sister taxa are two lineages that are each other’s closest relatives.
- How to Find Them: Look for a pair of taxa that share a unique common ancestor (a node) that is not shared by anything else on the tree. Because they split from the same point, they are equal in age and evolutionary “closeness.”
2. Defining a Monophyletic Clade: The “Scissors Test”
A true biological group is called a Monophyletic Clade. It includes a common ancestor and all of its descendants. To identify one, use the Scissors Test:
- The Rule: Imagine “clipping” a single branch on the tree with a pair of scissors. Every species that “falls off” with that branch belongs to the same clade.
- Invalid Groups: If you have to make two separate clips to isolate a group of species, or if you clip a branch but leave one of its “twigs” behind, you have not identified a valid clade.
3. The Rotation Rule: Don’t Get Distracted by “Neighbors”
One of the most common mistakes is assuming that taxa are more related simply because they sit next to each other at the tips.
- The Logic: Nodes are like swivel joints on a hanging mobile. You can rotate the branches at any node 180 degrees without changing the data.
- The Test: A tree showing (A, B) is identical to a tree showing (B, A).
- The Takeaway: Always focus on who shares the node, not the left-to-right order at the top of the page.
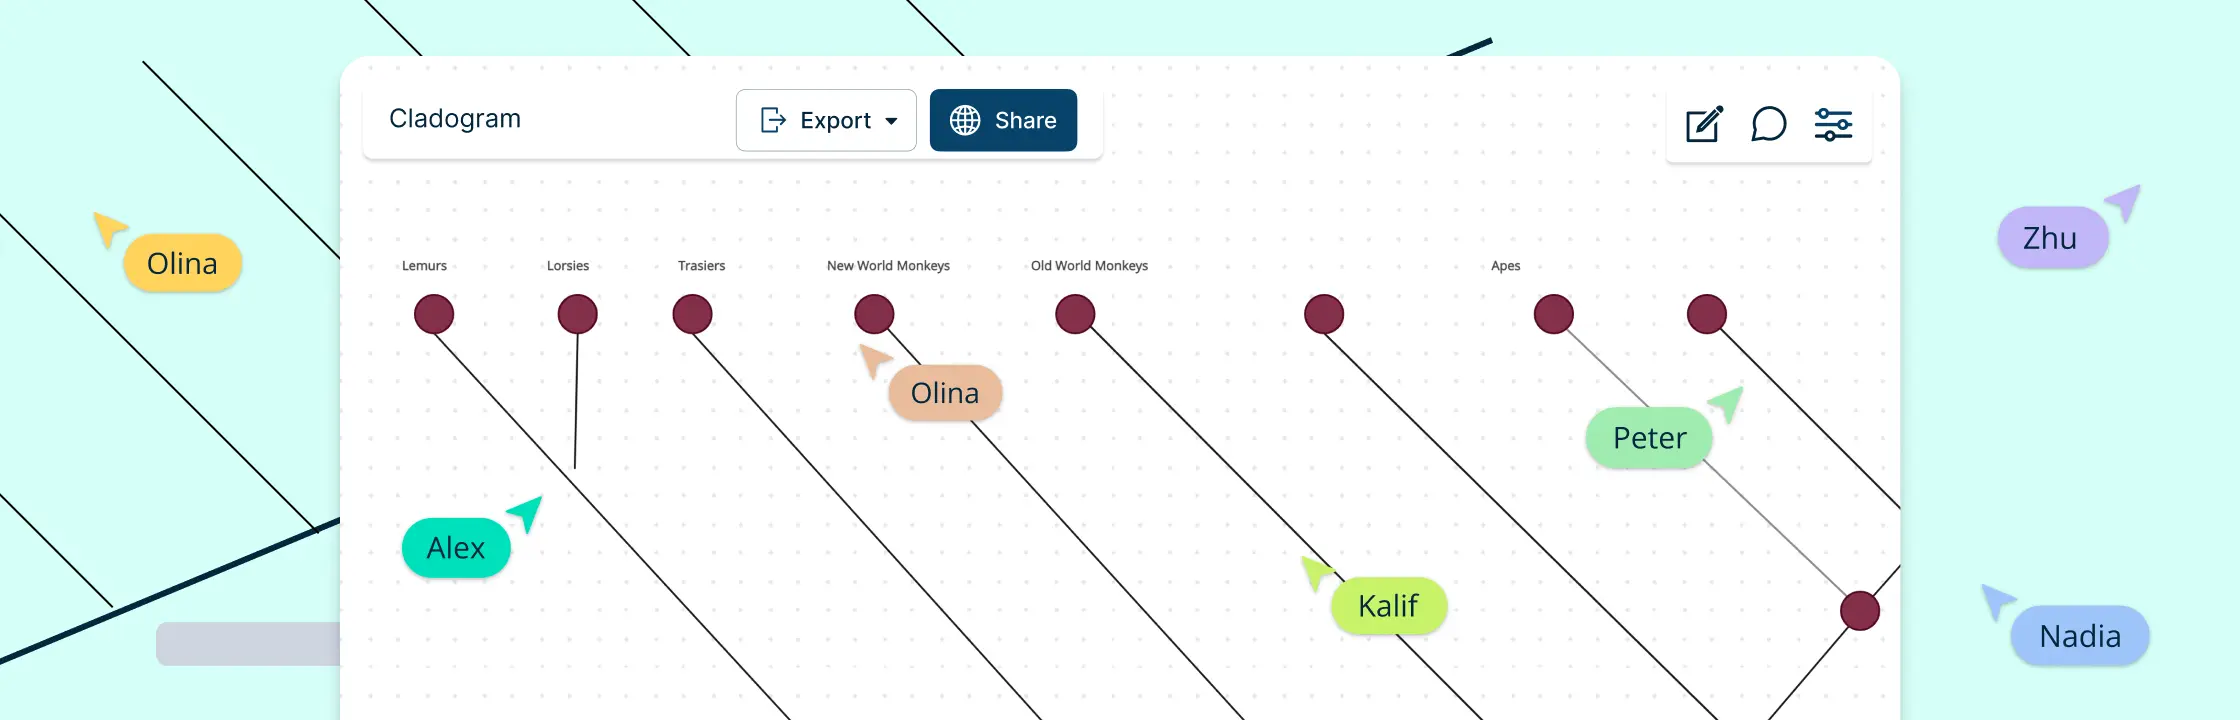
Examples of Cladograms


Significance of Cladograms in Evolutionary Biology
Cladograms are more than just charts; they are visual hypotheses of evolutionary history. In modern biology, they serve as the primary framework for phylogenetic systematics—the study of how organisms are related through shared ancestry.
1. Testing Evolutionary Hypotheses
Biologists use cladograms to propose and test theories about how life diverged. By applying the Principle of Parsimony (the idea that the simplest explanation with the fewest evolutionary changes is most likely correct), scientists can determine the most probable path evolution took.
2. Identifying Monophyletic Groups
The primary significance of a cladogram is its ability to identify clades (monophyletic groups). This is essential for modern taxonomy. Unlike older systems that grouped animals by surface-level similarities (like putting whales and fish together because they both swim), cladograms ensure that groups are defined by actual genetic or structural heritage.
3. Predictive Power in Genetics and Paleontology
Cladograms allow scientists to predict the traits of extinct species. If a specific trait is found in two lineages that share a common ancestor, paleontologists can hypothesize that the ancestor (and other intermediate fossils) likely possessed that trait as well. This “phylogenetic bracketing” is instrumental in understanding things like dinosaur feathers or the evolution of the mammalian middle ear.
4. Cladogram vs. Phylogenetic Tree: Choosing the Right Tool
While often used interchangeably, the choice between these tools depends on the researcher’s goals:
| Feature | Cladogram | Phylogenetic Tree |
| Primary Focus | Branching order and shared derived characters. | Branching order PLUS evolutionary time/distance. |
| Branch Lengths | Equal/Arbitrary; used for visual clarity. | Proportional to time or amount of genetic change. |
| Best Use Case | Classroom teaching and basic relationship mapping. | Detailed genomic research and molecular clock dating. |
By focusing on these structural relationships rather than absolute time, cladograms provide a high-level, “noise-free” view of the tree of life, making them the superior tool for initial evolutionary analysis.
Advantages of Using Creately to Read Cladograms
While paper-and-pencil sketches are a start, mastering the complexity of evolutionary branching is more intuitive with a dynamic visual canvas. Using a digital tool like Creately transforms reading cladograms into an active workspace for analysis.
Why Use a Digital Canvas for Cladistics?
- Non-Linear Iteration: Scientific hypotheses change as new data emerges. Creately tools allow you to “swivel” nodes or move branches instantly to test different versions of the Principle of Parsimony without redrawing the entire tree.
- Infinite Detail with Precision: Unlike a physical page, a smart canvas allows you to embed detailed metadata—such as genetic sequences or high-resolution fossil images—directly into the nodes and branches.
- Real-Time Peer Review: Interpreting cladograms is often a collaborative effort in labs and classrooms. Features like Live Mouse Tracking and Shared Editing allow teams to point to specific MRCA nodes or trace lineages together, ensuring everyone is “reading” the same evolutionary path.
Streamlining the Workflow with Creately
Creately’s specific feature set is designed to simplify the technical hurdles of biological diagramming:
- Interactive Drag-and-Drop: Easily snap branches to nodes and maintain the structural integrity of your clades, even as you rescale the diagram.
- Contextual Data Integration: Link your cladogram tips to external research papers or data tables to provide a full picture of the taxa being analyzed.
- In-App Discussion Tools: Use integrated comments to discuss the placement of specific synapomorphies (shared traits) directly on the canvas.
- Enterprise-Grade Security: Ensure that proprietary genomic data or sensitive research remains protected with advanced access controls.
Beyond the Diagram: AI-Powered Analysis
Creately’s smart visual canvas is more than a drawing tool; it is a collaborative hub. By utilizing AI-powered tools such as mind maps or concept maps, students and researchers can quickly generate structures, brainstorm character traits, and transform raw data into a readable, professional-grade cladogram in seconds.
Mastering the art of reading a cladogram is a fundamental skill for anyone looking to understand the intricate history of life on Earth. By shifting your focus from the physical placement of the “tips” to the structural logic of the nodes and branching patterns, you gain a clearer perspective on the shared heritage that connects all living organisms. We’ve explored the essential components of cladograms and examined why they remain the gold standard for evolutionary biology.
Now that you have the analytical tools to interpret these visual hypotheses, it’s time to put that knowledge into practice. Use Creately’s Cladogram Maker to build, rotate, and collaborate on your own diagrams, transforming raw data into clear, professional-grade evolutionary stories.
Helpful Resources
Explore what a cladogram is and how it is used in evolutionary biology.
Learn how to build a cladogram to visualize the evolution of organisms from common ancestor.
Explore the distinctions between cladograms and phylogenetic trees and when to use them.
Discover what phylogenetic trees are and how they help in visualizing evolutionary relationships among species.