Struggling to turn scattered evolutionary data into a clear, professional visual? You aren’t alone. Our guide simplifies how to create a cladogram using a logical, step-by-step framework. From building character tables to using collaborative templates, discover how to move from messy notes to visual clarity by mapping complex evolutionary relationships with speed and precision.
What Is a Cladogram?
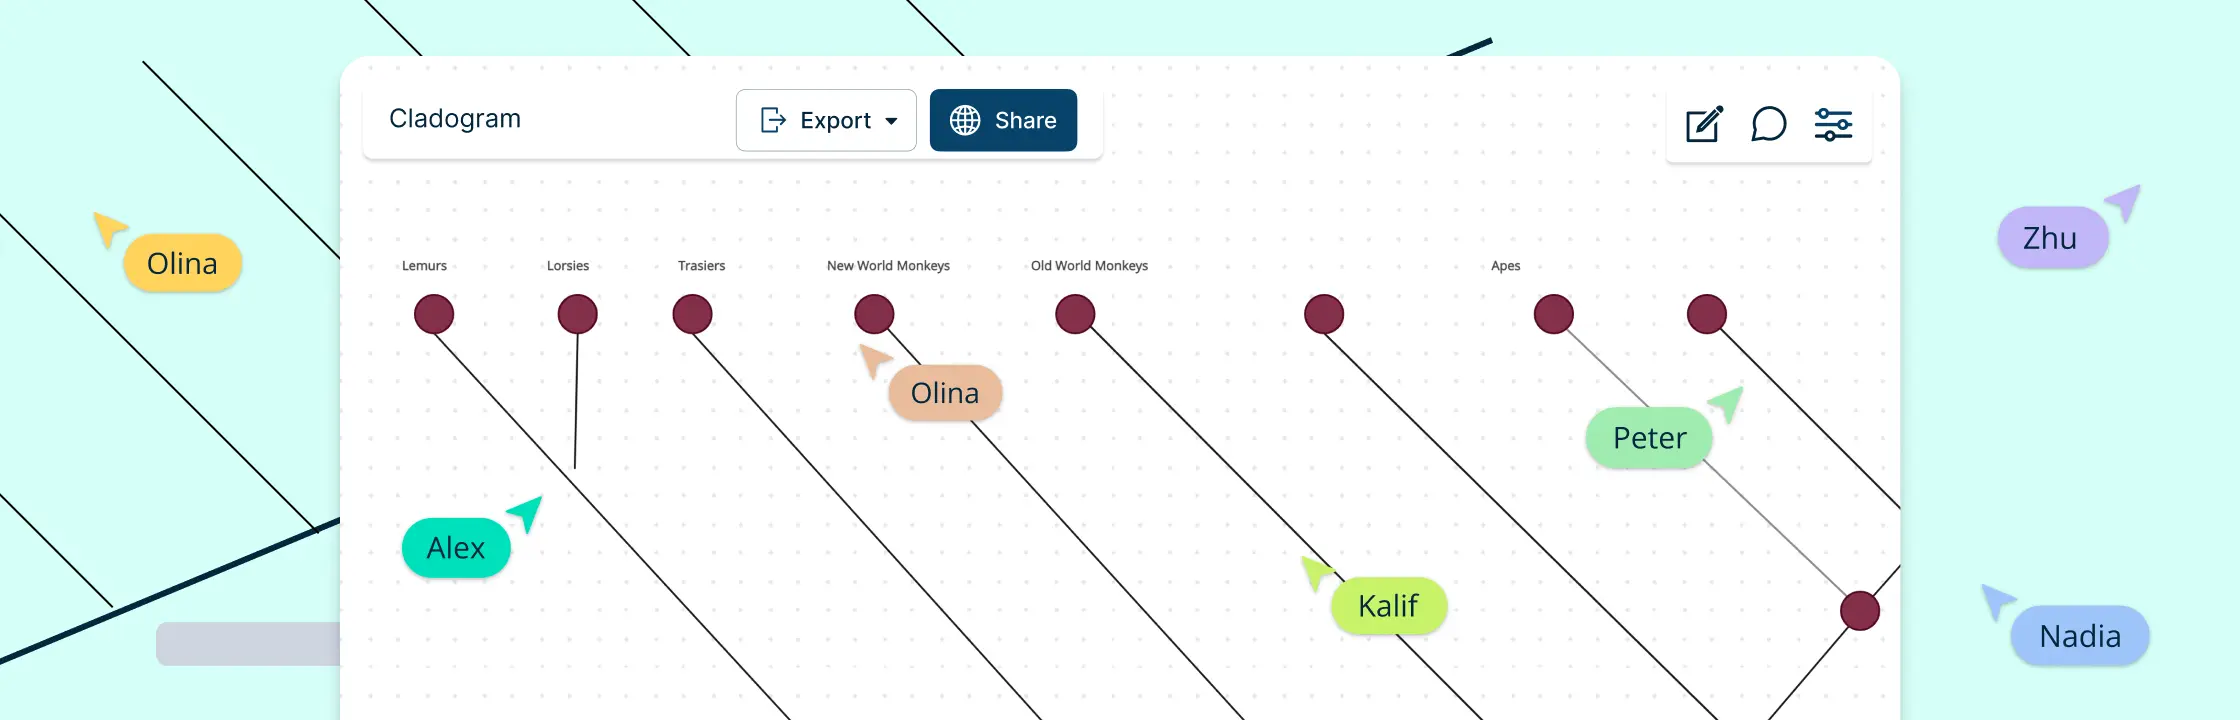
In the simplest terms, a cladogram is a visual map of evolutionary relationships. It’s a diagram used to show how different groups of organisms are related based on shared, derived characteristics. Think of it as a family tree, but instead of tracking your cousins and aunts, you’re tracking how life itself branched out over millions of years.
Understanding the Basics (Before You Draw)
Before we start mapping out branches, we need to speak the language. If you’ve ever felt overwhelmed by biological jargon, you aren’t alone. But once you strip away the heavy scientific lifting, a cladogram is built on a few very simple, logical building blocks.
Key Terminology: The Anatomy of a Cladogram
Think of a cladogram like a roadmap of history. To read it, you just need to know what the signs mean:
- Taxa (Singular: Taxon): These are the groups of organisms at the tips of the branches (e.g., humans, chimpanzees, or even a whole class like “mammals”).
- Nodes: The points where two branches split. A node represents a common ancestor, the moment in time where one lineage became two.
- Clades: A “clade” is a complete branch. It includes the common ancestor and all its descendants. If you can “snip” a branch off and keep everything attached to it, you’ve got a clade.
- Outgroup: The “outsider.” This is a species that is related to the others but doesn’t share the specific traits we’re looking at. It acts as a baseline to show where the derived traits began.
The Logic of Shared Characteristics: Who Belongs Where?
How do we decide which branch goes where? We look for shared derived characteristics (the technical term is synapomorphies). These are the “evolutionary upgrades” that appear in a common ancestor and are passed down to everything that follows.
To keep it simple, let’s look at how we’d group a shark, a bullfrog, and a lion. We start with the traits that link them and look for the moments they diverge:
- The Baseline (Vertebrae): All three have backbones. This is our starting point.
- The First “Upgrade” (Four Limbs): The bullfrog and the lion have four limbs; the shark does not. The shark branches off here.
- The Final “Upgrade” (Amniotic Egg/Hair): The lion has hair and a specialized egg/reproduction system that the bullfrog lacks. The bullfrog branches off, leaving the lion at the most “derived” point of this specific path.
| Vertebrae | Four Limbs | Amniotic Egg | |
|---|---|---|---|
| Shark | X | 0 | 0 |
| Bullfrog | X | X | 0 |
| Lion | X | X | X |
By identifying these physical or genetic milestones, we can logically place organisms on the tree. The more shared traits two species have, the more recently they shared a common ancestor. By using a character table like the one above, you create a “source of truth” that makes the actual drawing process feel like connecting the dots rather than solving a mystery.
How to Make a Cladogram: A Step-by-Step Framework
Ready to move from data to design? This is where we solve the problem of “where do I even start?” By following this structured framework, you’ll stop second-guessing your nodes and start building with confidence. So, here’s how to build a cladogram in 5 easy steps.
Step 1: Choose Your Organisms (the Taxa)
First, define the scope of your study. Whether you are analyzing a specific genus or comparing broad classes of animals, you need a manageable group.
- Identify the “In-group”: The set of organisms you are actually interested in studying.
- Keep it focused: Especially if you are just starting, stick to 5–7 taxa to keep your visual clear and readable.
Step 2: Select Your Characteristics
Now, look for the “upgrades”: the derived characteristics that some members of your group have, but others don’t.
- Morphological Traits: Physical features like feathers, skeletal structures, or the presence of lungs.
- Molecular/Genetic Traits: DNA sequences or specific protein structures (common in modern professional research).
- The Rule of Parsimony: In science, the simplest explanation is usually the right one. Choose traits that clearly distinguish one group from another without creating unnecessary complexity.
Step 3: Build the Character Table
This is your “cheat sheet” and the secret to a fast workflow. Instead of trying to hold all the relationships in your head, create a matrix or a character table.
- List your organisms in the first column.
- List your chosen traits across the top row.
- Mark a “1” or “X” if the organism has the trait, and a “0” if it doesn’t.
Step 4: Determine the Sequence & Identify the Outgroup
Look at your table. There will be one organism that has none (or the fewest) of the derived traits. This is your Outgroup.
- The Outgroup serves as your baseline; it’s the first branch to “peel away” from the main line.
- The organism with the most traits is your most “derived” species and will likely sit at the very end of your branching sequence.
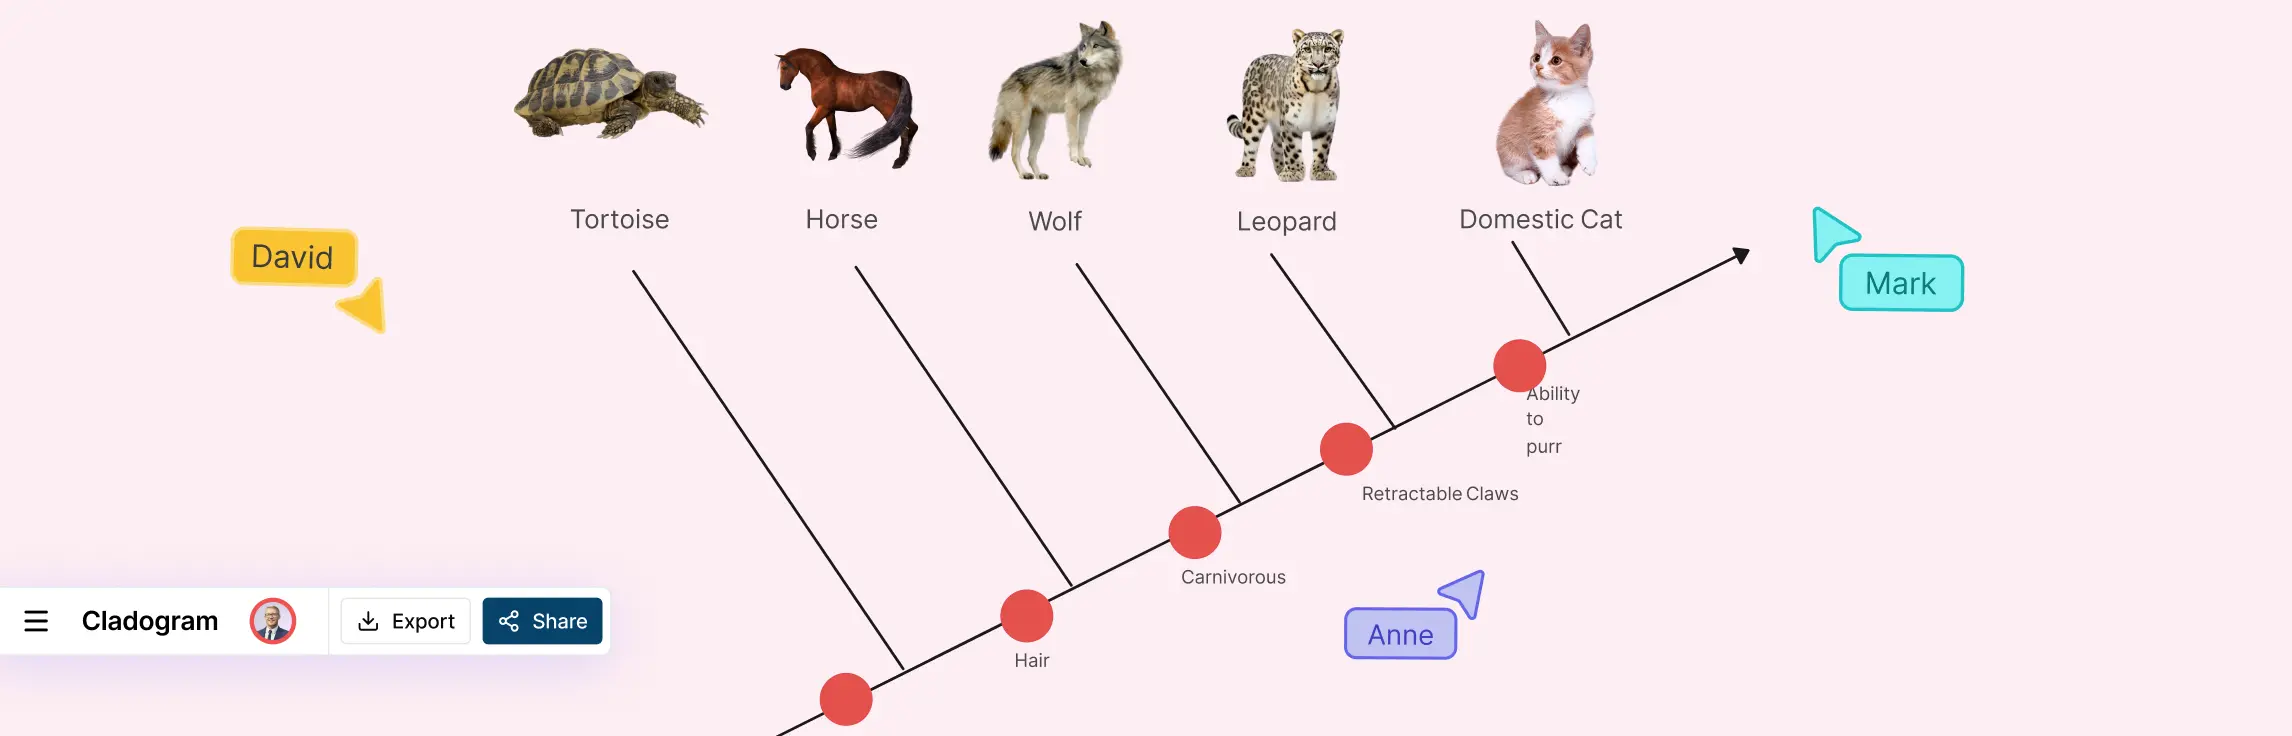
Step 5: Visualize the Tree and Branches
Now for the easy part—turning that table into a clear diagram on Creately’s Cladogram Maker. If you have been wondering how to draw a cladogram from a table without the usual headache, this is where it all comes together:
- Draw the Main Line: Start with a diagonal or rectangular trunk.
- Branch the Outgroup: Draw the first branch at the base for your outgroup.
- Place the Nodes: Moving up the line, create a node (a split) for each new trait.
- Add the Traits: Label the main stem between branches to show where each trait evolved.
- Refine and Style: Use Creately’s styling tools to color-code clades or add icons for each species to make the diagram instantly scannable.
Free Cladogram Templates to Get You Started


Common Mistakes to Avoid When Creating Cladograms
Even the most seasoned researchers can hit a snag when mapping out complex lineages. The goal is to move from frustration to clarity, so let’s look at the pitfalls that often lead to “scattered” logic and how you can avoid them.
1. Misidentifying Homoplasies
This is the “optical illusion” of biology. A homoplasy is a trait that looks the same in two species but evolved independently (like the wings of a bird and the wings of a bat—convergent evolution). A homology, on the other hand, is a trait inherited from a common ancestor.
Always cross-reference physical traits with genetic data when possible. Misidentifying these leads to incorrect branches, but starting with a solid character table in Creately helps you spot these inconsistencies before they become permanent nodes.
2. Getting Tangled in Branch Scaling
While cladograms are technically “arbitrary” in branch length, inconsistent scaling can visually distort the degree of relatedness. If one branch is wildly longer than others without reason, it can mislead the viewer into thinking more time has passed.
3. Overcomplicating the Visual
It’s tempting to include every single trait you’ve discovered, but a “noisy” diagram is a useless one. When a canvas is cluttered with fifty different minor traits, your core evolutionary story gets lost.
Apply the Principle of Parsimony. Choose the most significant derived characteristics that define the major splits. Remember, you can always use Creately’s layers or info-panels to hide detailed data behind a clean, high-level visual.
Advanced Tips for High-Precision Cladograms
In a fast-paced research or academic environment, your cladogram is more than a drawing; it’s a living document. To move from a basic sketch to a professional-grade visual, you need to optimize for both human readability and team efficiency.
Leverage Data-Integrated Tools
Don’t just draw lines; connect data. Using a specialized cladogram maker within a robust workspace like Creately allows you to link external data sources directly to your shapes. This means your diagram isn’t just an image—it’s a visual database.
Incorporate Genetic & Molecular Data
Modern cladistics relies heavily on DNA sequencing. Instead of choosing between a morphological chart and a genetic report, integrate them. You can use Creately’s infinite canvas to place your DNA sequence analysis right next to your visual tree, providing a comprehensive view that modern teams need for deep-dive analysis.
Peer Review and Real-Time Validation
The best science happens through collaboration. Don’t wait until you’ve “finished” to get feedback. Invite your peers to your cladogram workspace early in the process to validate your nodes and outgroups.
Keep it Scannable
Scientific data can get dense, fast. Don’t let your insights get lost in a sea of black-and-white lines. Use visual cues to make your findings “pop” instantly:
- Color-Code Your Clades: Use distinct colors for different branches to help viewers instantly distinguish between groups.
- Iconography for Traits: Instead of just text labels, use icons (like a feather, a bone, or a DNA strand) to represent derived characteristics. It breaks the “wall of text” and makes the diagram much more engaging.
- Consistent Line Weights: Use thicker lines for the main trunk and thinner lines for individual branches to imply a clear evolutionary flow.
Collaborate in Real-Time
- One Source of Truth: By using a cloud-based canvas like Creately, your whole team works on the same link.
- Live Multi-User Editing: You can watch your colleague refine the character table while you adjust the nodes.
- In-Context Comments: Instead of long email threads, drop a comment directly on a specific node or branch. It keeps the conversation where the work is happening.
Iterate Quickly: The Creately Advantage
In science, new data arrives every day. A new fossil discovery or a DNA sequencing result might change your entire tree.
- Drag-and-Drop Flexibility: On paper or in static drawing tools, moving a branch means starting over. On a digital canvas, you simply grab a node and shift it.
- Infinite Scaling: Realized you need to add an outgroup at the last minute? Don’t worry about margins or page edges. Just expand your canvas.
- Version History: Experiment fearlessly. If a new hypothesis doesn’t pan out, you can always jump back to a previous version of your diagram with one click.
Empower Your Visual Thinking
At the end of the day, creating a cladogram is about bringing order to complexity. It’s about taking the scattered pieces of evolutionary history and snapping them into a clear, logical structure that tells a story.
You have the data and the insights, now you have the framework to share them with the world.
Ready to clear the clutter? Jump into Creately and start building your first cladogram for free.
Helpful Resources
Explore what a cladogram is and how it is used in evolutionary biology.
Learn how to read and interpret cladograms for evolutionary biology, paleontology, or related fields.
Explore the distinctions between cladograms and phylogenetic trees and when to use them.
Discover what phylogenetic trees are and how they help in visualizing evolutionary relationships among species.
FAQs About Drawing a Cladogram
Can a cladogram be used to show the exact time an organism evolved?
What is the difference between a monophyletic, polyphyletic, and paraphyletic group?
These terms describe how you “cut” the branches on your tree:
- Monophyletic (Clade): Includes the common ancestor and all its descendants. This is the goal of a clean cladogram.
- Paraphyletic: Includes the ancestor and some, but not all, descendants.
- Polyphyletic: A group that includes organisms from different lineages but leaves out their common ancestor (often the result of misidentifying homoplasies).