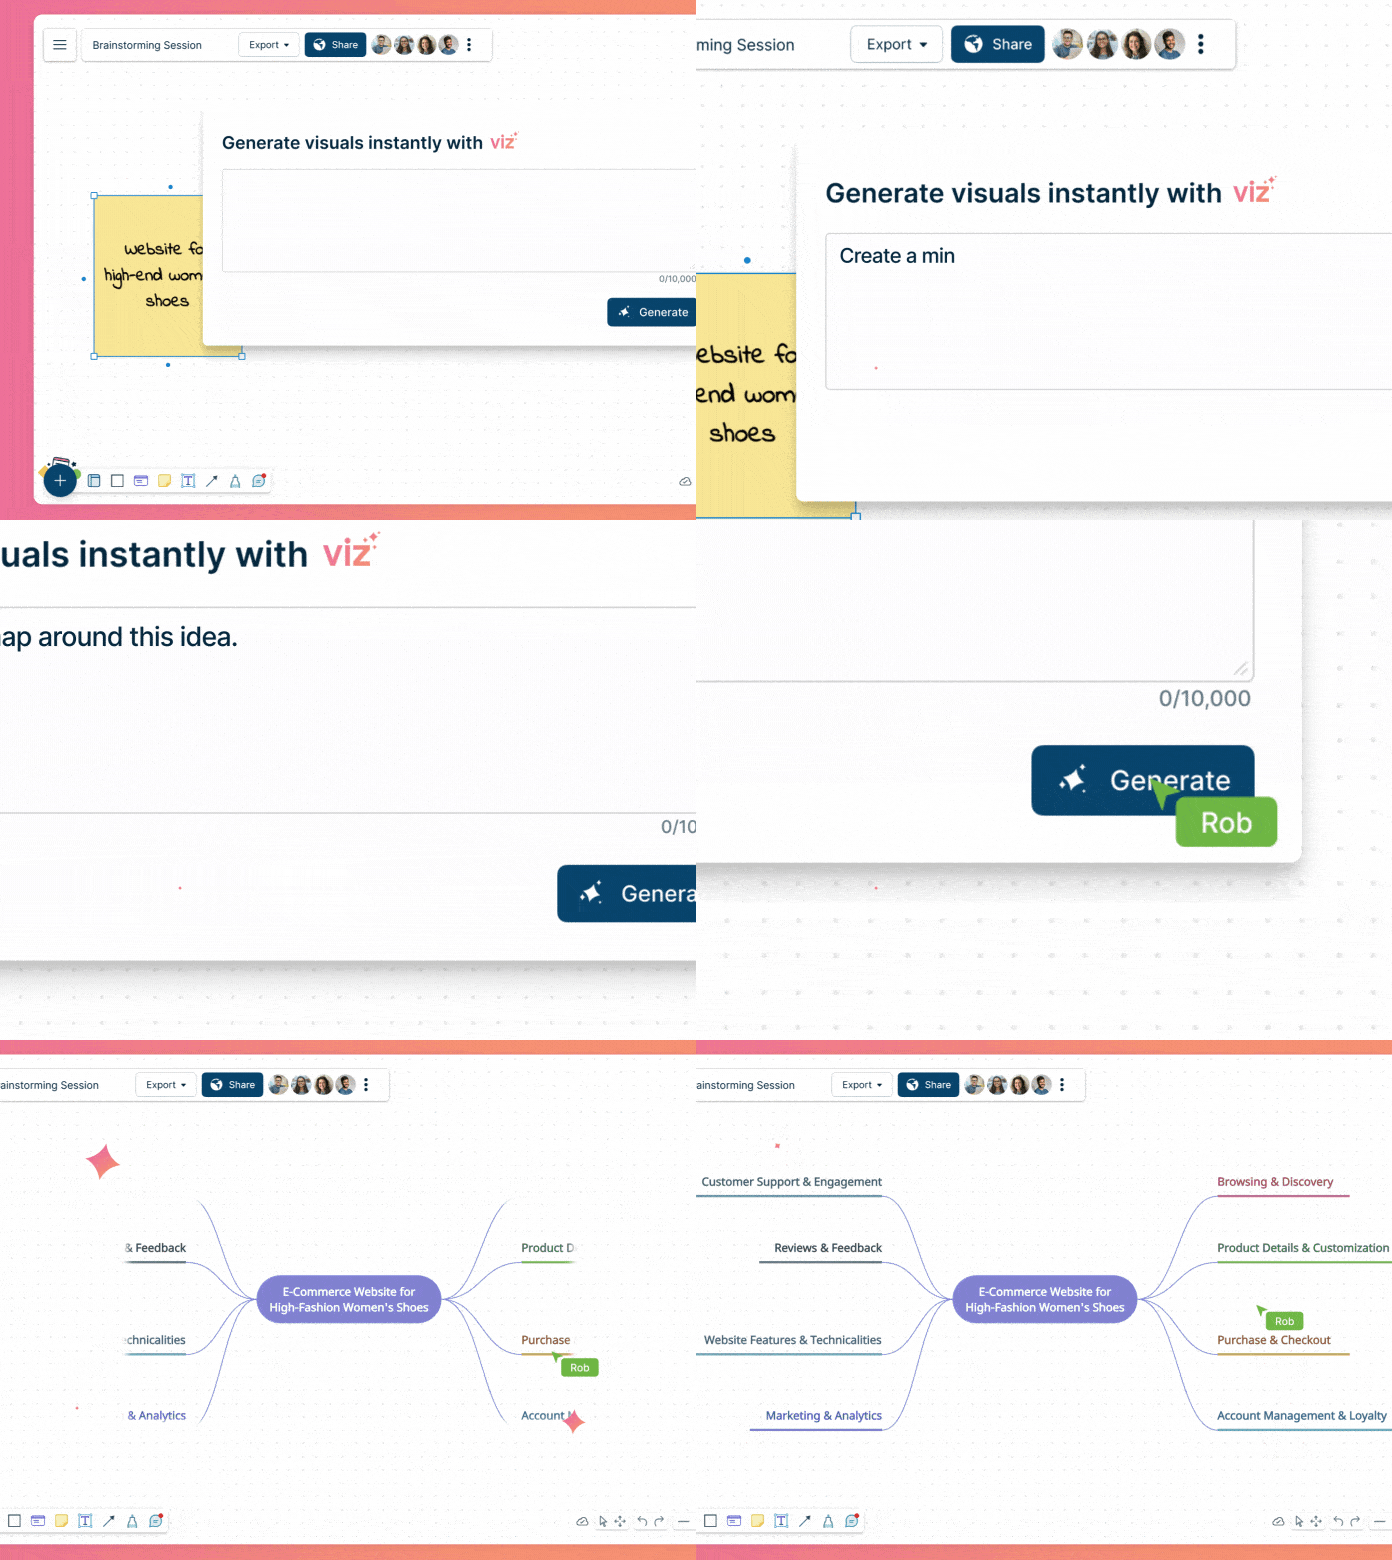
The automatic generation of diagrams has emerged as a transformative capability in artificial intelligence, bridging the gap between complex data structures and comprehensible visual representations. In this guide we will look at how to generate diagrams using AI and how Creately’s AI diagram maker can help streamline the process.
What are AI Diagrams
AI diagrams are basically visual structures generated by AI using prompts.
To generate AI diagrams, AI systems interpret text, raw data, and even source code and turn them into visually intuitive diagrams. These diagrams range from flowcharts and architecture diagrams to intricate neural network representations, making it easier for stakeholders to understand complex concepts.
The application of this transformative technology isn’t limited to one area, but rather is widespread. Whether it’s simplifying software architecture visualization, creating decision trees, or generating network diagrams, AI-driven diagram generation simplifies complex information and saves time.

How to Create AI Diagrams Instantly Using Creately VIZ
Creately VIZ is Creately’s AI-powered visualization and diagramming technology, that helps users to effortlessly generate diagrams or visuals automatically using prompts and custom input.
With Creately VIZ, users can:
- Automatically generate various types of diagrams based on text prompts.
- Expand diagrams seamlessly, whether for creating similar items, counterpoints, or employing custom instructions.
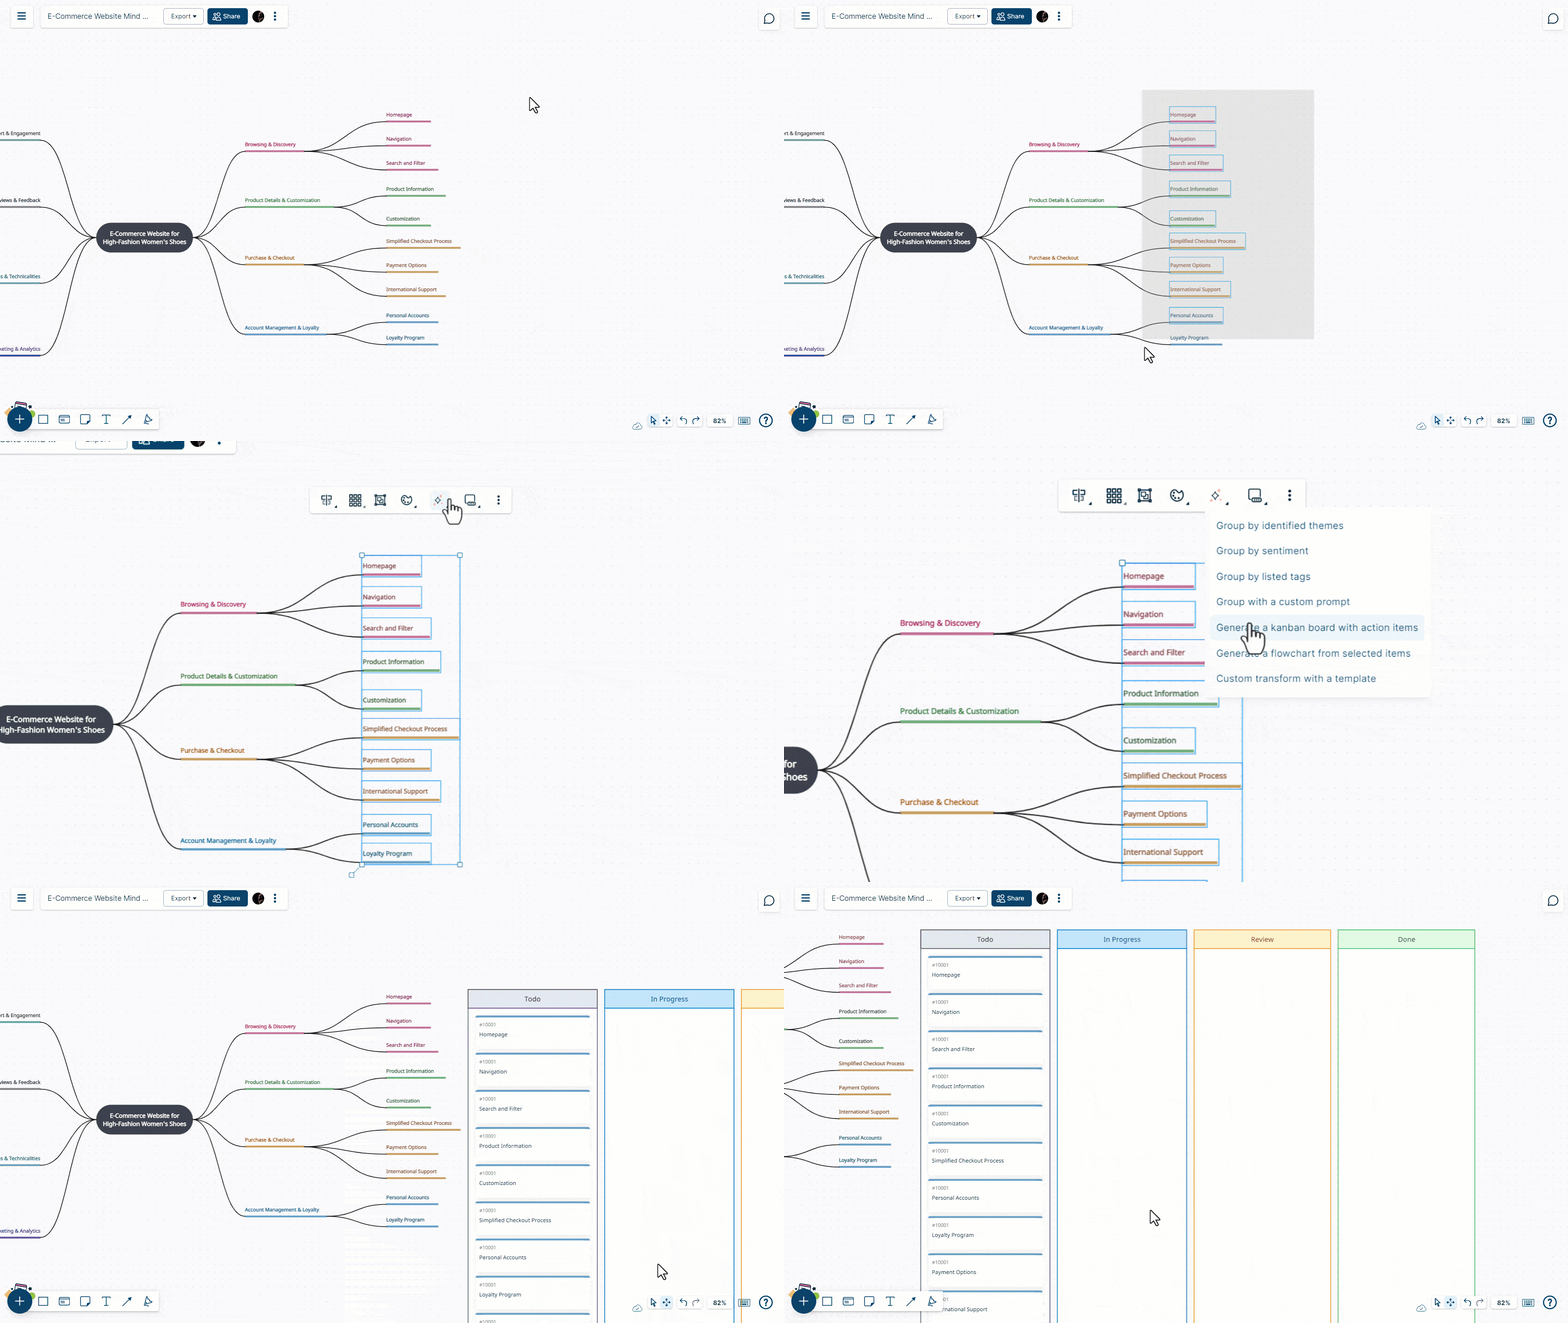
- Transform ideas into diverse diagrams and visual frameworks, such as converting a mind map into a Kanban board.
- Organize and categorize elements within a diagram to discern patterns, trends, and relationships effectively.
- Begin projects swiftly with a range of AI templates catering to mind maps, business model canvases, and more.
Watch the informative video here for a comprehensive visual guide, and follow the outlined steps below to optimize your AI-driven diagramming experience with Creately VIZ.
Step 1. Get acquainted with Creately VIZ
Explore the features of Creately VIZ, so you can effectively create and expand your diagram with it. Check out this article for detailed instructions on how to use Creately VIZ.
Step 2. Create a workspace and outline your goals
Create a dedicated workspace and invite collaborators with whom you would like to work together on generating the AI diagram.
Step 3. Start with a template or start from scratch
Creately offers a range of AI diagram templates which varies from mind maps to SWOT diagrams. You can use one of these to accelerate creating your AI diagram, and then use the prompts in the contextual toolbar to expand or fill the diagram further. Or you can start with a simple shape that you drag and drop from the shapes panel and use custom prompts to build on your ideas.

Step 4. Customize your diagram
You can use Creately VIZ prompts available via the contextual toolbar to further expand your diagram, generate content, group ideas by theme, sentiment, or listed tags or convert your selected items in your diagram into a flowchart or Kanban board instantly.

Try it Creately VIZ on Microsoft Teams
You can also use Microsoft Teams to host a diagramming session and use the Creately Viz for Microsoft Teams plugin to draw diagrams during your discussion.
- One-command visuals: Simply say “@creately generate me type of visual for context or scenario”.
- It can understand your conversation context: With simply saying “@creately generate me a Kanban board from this thread”, Creately will automatically identify key action points, and convert it into a real Kanban board that you can open right within Teams.
- Update existing workspaces: You can also say “@creately update our pinned workspace with this action item” or “@creately update the brainstorming board with this idea” etc. This only works when you have pinned workspaces in the channel and it works really well as a place to put ideas that otherwise get lost in discussions.

AI Diagram Templates
Use the following AI diagram templates on Creately to brainstorm, plan, and execute your work with AI.
Flowchart
Mind map
SWOT diagram
KWL chart
Org chart
User story map
Priority matrix
Sample Prompts for Generating Better AI Diagrams
Tailor these prompts to your specific needs, and remember to provide detailed instructions to guide the AI in creating the desired diagrams effectively.
| AI Diagram Type | Prompt | Example |
|---|---|---|
| Flowchart | “Create a flowchart illustrating the process of [specific process or workflow]” | “Generate a flowchart outlining the steps involved in our customer onboarding process.” |
| Mind map | “Expand the existing mind map to include [additional concepts or categories]” | “Add details to the mind map covering various features and functionalities of our upcoming product.” |
| Decision tree | “Develop a decision tree for [specific decision-making scenario]” | “Generate a decision tree for guiding users through troubleshooting common software issues.” |
| Network diagram | “Improve the network diagram by including [additional devices or connections]” | “Include new server nodes and their connections in the existing network architecture diagram.” |
| Data flow diagram | “Illustrate the data flow for [a specific system or process]” | “Create a data flow diagram depicting how customer orders are processed from online submission to shipping.” |
| Collaborative brainstorming map | “Generate a collaborative brainstorming map capturing ideas on [specific topic]” | “Create a collaborative mind map showcasing innovative ideas for our upcoming marketing campaign.” |
| Hierarchical structure diagram | “Develop a hierarchical structure diagram for [organizational structure, system components, etc.]” | “Generate a hierarchical diagram representing the organizational structure of our department.” |
| Storyboard | “Generate a storyboard outlining the user journey for [specific scenario or feature]” | “Illustrate a storyboard depicting the user experience from account creation to completing a purchase on our e-commerce platform.” |
| Gantt chart | “Develop a Gantt chart for [project timeline, task scheduling, etc.]” | “Generate a Gantt chart illustrating the timeline for our upcoming product launch, including key milestones and deadlines.” |
| SWOT analysis | “Conduct a comprehensive SWOT analysis for our [company/project]” | “Generate a SWOT diagram analyzing the current state of our company, considering internal strengths and weaknesses as well as external opportunities and threats.” |
Benefits of Using AI to Generate Diagrams
Using AI to generate diagrams brings about several advantages.
1. Work Faster
Using AI to create diagrams boosts productivity and gives you a visual representation of your ideas in no time.
2. No artistic skills needed
Users don’t need to be artistic to use AI-generated diagrams, so they can focus on the substance of their ideas without worrying about the presentation.
3. An array of visual solutions
AI brings a dynamic element to diagram creation by generating a range of visual outputs, catering to various preferences.
4. eamless idea transformation
Artificial intelligence enables seamless transitions between different visual frameworks, like converting a mind map into a Kanban board.
5. Pattern recognition expertise
AI’s ability to recognize patterns helps organize and categorize diagram elements, facilitating the identification of relevant trends and relationships.
6. Template convenience
AI simplifies the process of creating diagrams by offering templates, so users don’t have to start from scratch and can get started on their projects right away.


