How to Use Cross Functional Flowcharts for Planning

Updated on: 02 December 2022 | 6 min read
Sharesocial-toggle
Link Copied!
hero-img

What are cross functional flowcharts

Flowcharts are widely popular and one of the most frequently diagram types. They are great for mapping the flow of steps, decisions that need to be made etc in a process.

However flowcharts have just more than the process names, their flow and type of action embedded. Things like owners, stages, timelines need addition of more data to the flow and cross functional flowcharts are a solution to this problem.

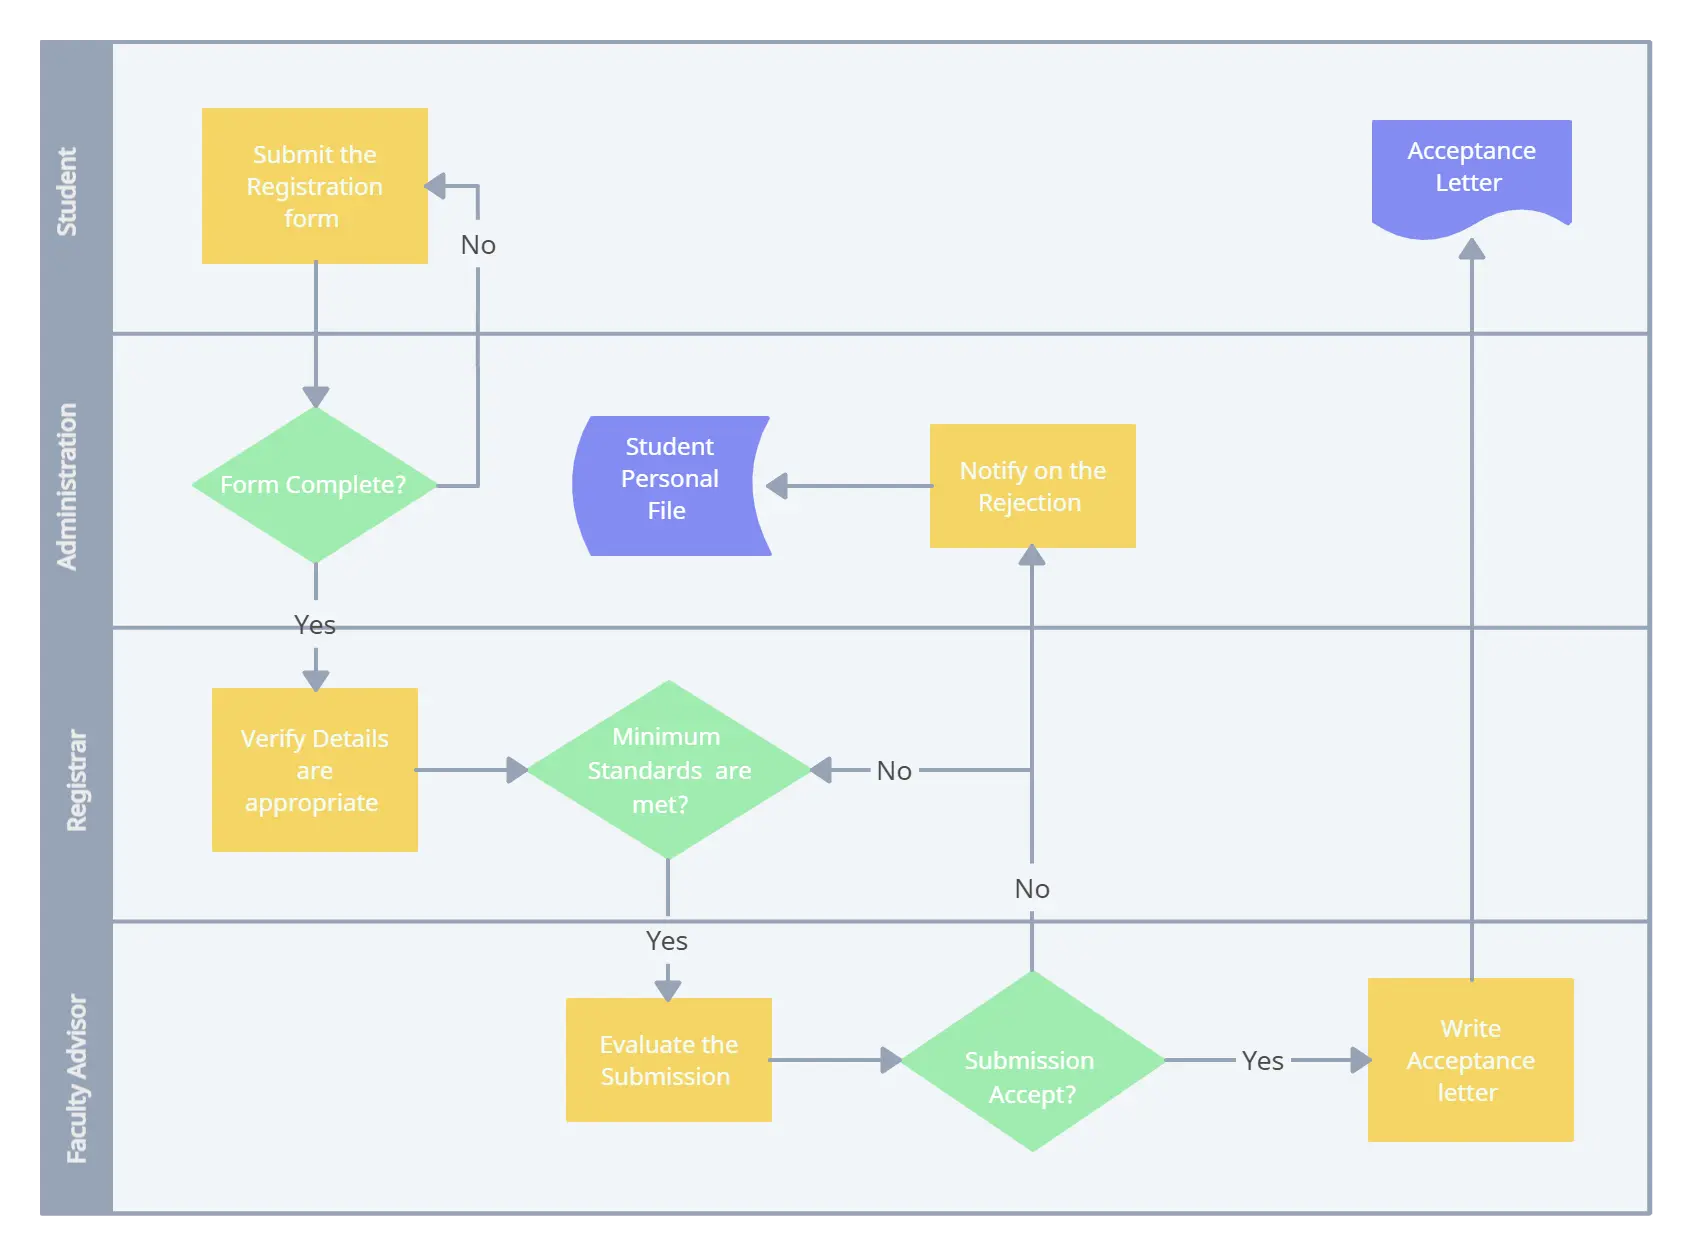
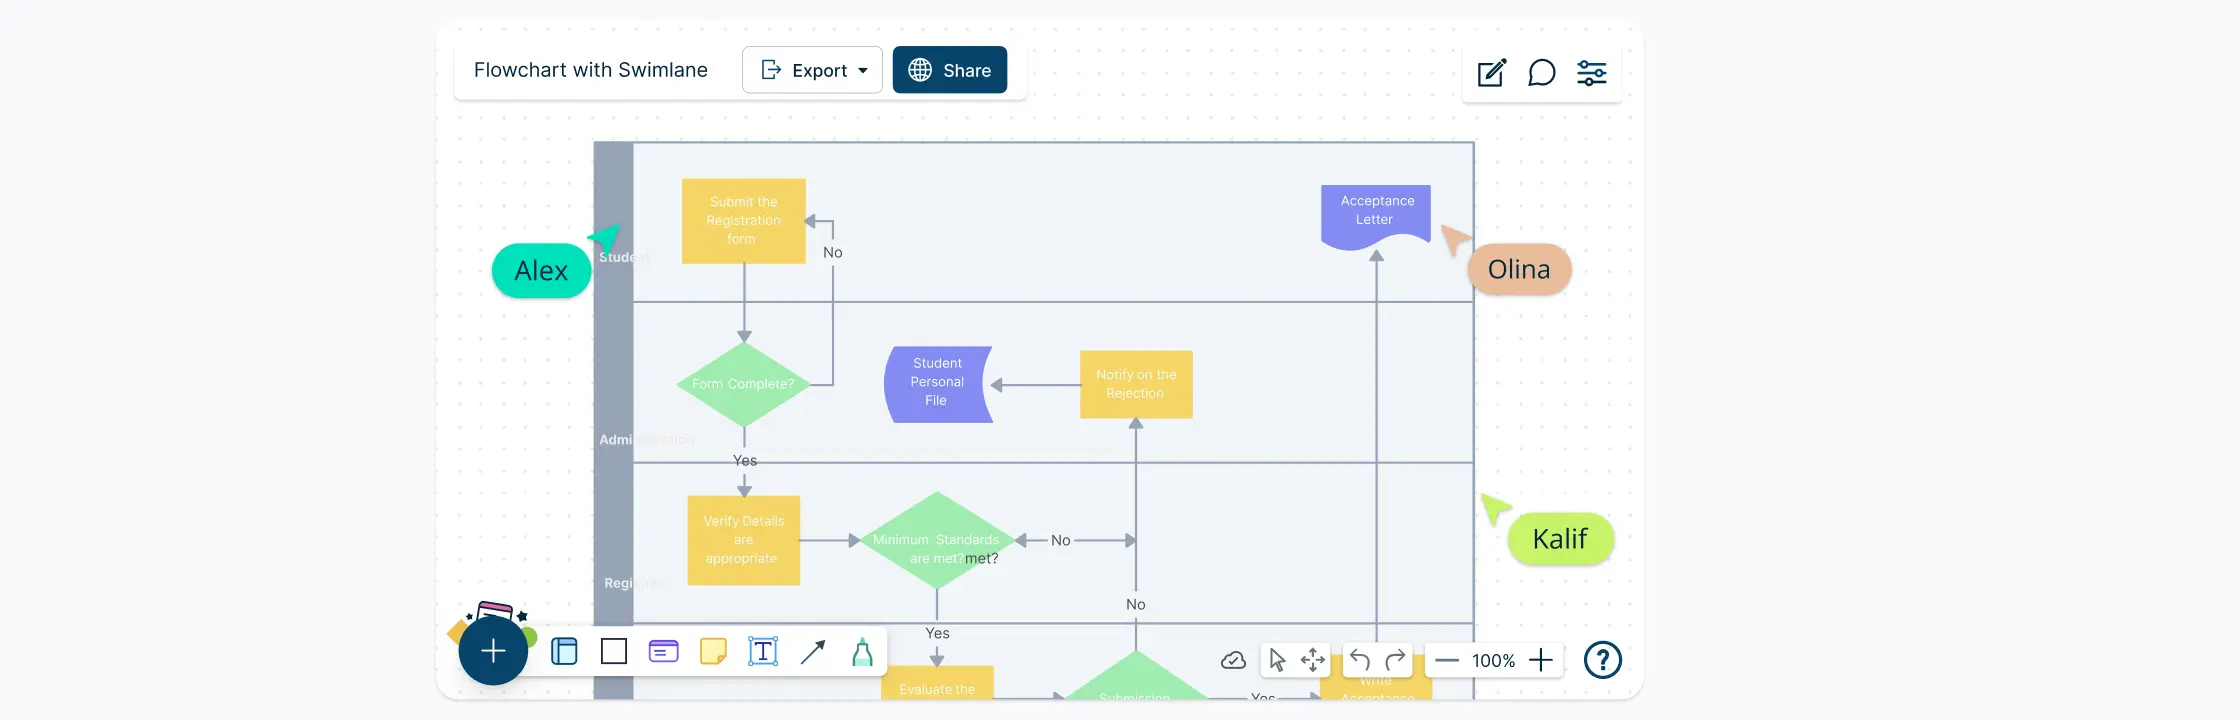
When you have a process that requires the involvement of multiple people, teams or departments it can get difficult to illustrate this in a normal flowchart. Cross-functional flowcharts sometimes referred to as swim lanes can simply illustrate the owners of each step in the flowchart by organizing them into columns or rows.

The simple layout makes it easy to understand additional attributes about each step without much hassle while being able to comprehend the flowchart at a glance. The same flowchart symbols that you use in a standard flowchart will be used to create the flow inside the swim lanes.

Multiple types of cross-functional flowcharts

While the name implies these flowcharts are meant to be used to demarcate process flows that go between multiple functional departments, they are far more widely applicable. Any other dimension of information can be added via the cross-functional layout.
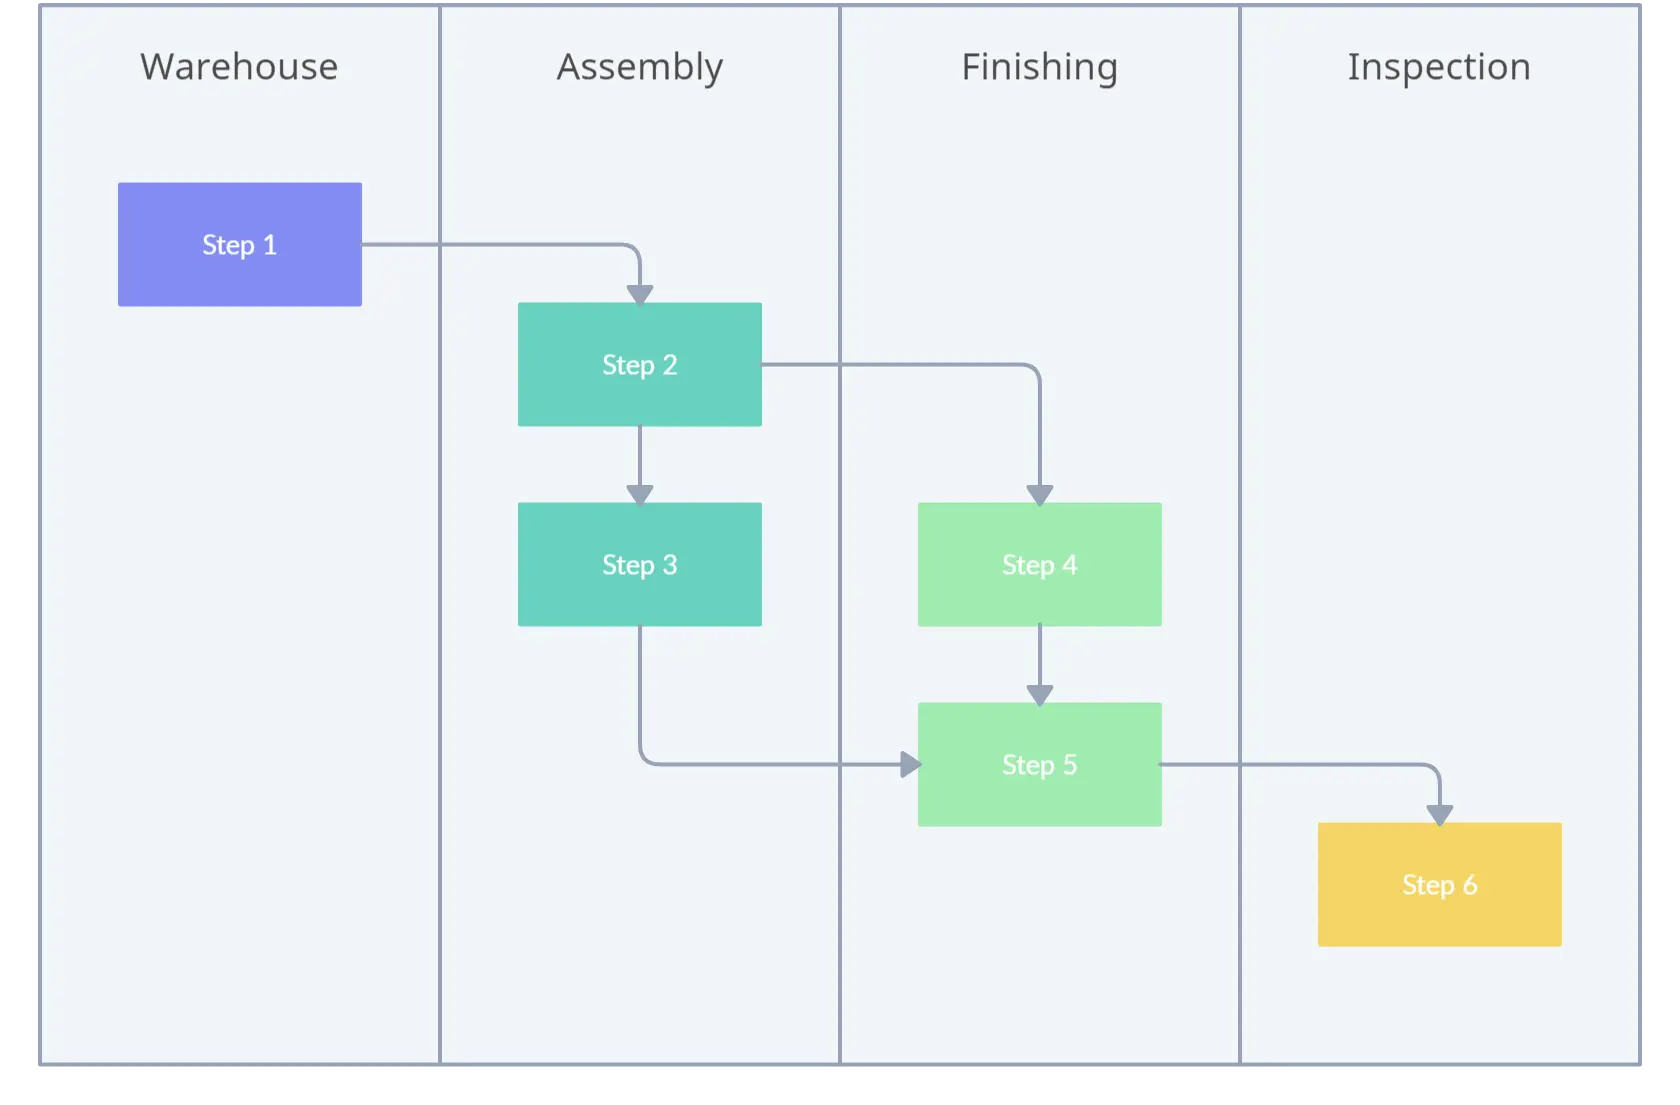
Deployment flowcharts

Historically Deployment Flowcharts were used to group process flows sequentially. Typically used in things like documenting manufacturing processes such as assembly of vehicles. By grouping the processes it makes it easier to understand who and what is responsible for each step of the flow as well as how balanced the workflow is.

You can also use these charts to see how the stakeholders interact with each other as well as spot waste and unnecessary delays and repetitive tasks.

These can be scaled down to individuals that work on a process or different roles in a process.

Opportunity flowcharts

Another common type of flowchart is the opportunity flowchart that can be used to clearly see where value is being added in the process. While value-add is subjective, its important that you understand from which perspective you are analyzing the process.

You’d break down the processes into two simple columns and identify if the step is value adding or not. Once you have this, you may be able to cut out non-value adding processes and further optimize your flow of work in your process.

Cross functional flowchart layouts

Each column in such a diagram is called a SwimLane. And the entire container is called a Pool. A very familiar analogy!

The swimlanes can be laid out horizontally or vertically depending on the type of process and the length of the flow. There is no real format or technical requirement for this choice, its a simple matter of making sure if the chart easier to understand if its laid out horizontally or vertically.

Tools to draw Cross Functional Flowcharts

There are a few products that you can draw flowcharts with yet not every product supports easy drawing of Cross Functional Flowcharts or swim lanes.

You could of course use Microsoft Word drawings to get a very basic flowchart out but that quickly gets tiresome with manual controls of everything from the boxes to connecting lines.

Having pre-made templates and shapes would greatly ease creation of cross functional flowcharts. Our online flowchart software is an easy choice in looking for such products as it comes with pre-made cross-functional flowchart templates as well as a comprehensive set of cross-functional flowchart shapes.

Furthermore, it has made it faster to draw flowcharts with the 1-click creation of shapes and connectors cutting down the drawing time ⅓ of what it usually is.

Other products to help you draw these flowcharts can be Microsoft Visio. MS Visio also has series of shapes for flowcharts and has advanced support for connecting shapes as well as swim lanes. However, it is not as easy to use and adapt.

Cross functional flowcharts are highly useful when you are dealing with a large process or want to easily analyze the process for potential changes and optimizations.

More Resources

Visio for Mac OS

Join over thousands of organizations that use Creately to brainstorm, plan, analyze, and execute their projects successfully.

Get started here

FAQs About Cross functional flowcharts

What is a cross-functional flowchart?
A cross-functional flowchart, also known as a swimlane diagram or deployment flowchart, is a visual tool used to illustrate the flow of activities, information, or responsibilities across different functional areas or departments within an organization. It shows how various roles of stakeholders interact and collaborate in a process or project.
Why are cross-functional flowcharts useful for planning?
Cross-functional flowcharts are useful for planning because they provide a comprehensive view of how different functions or departments are involved in a process or project. They help identify dependencies, bottlenecks, and potential areas for improvement. By mapping out the interactions and handoffs between various teams or individuals, cross-functional flowcharts enable effective planning, coordination, and communication across the organization.
What are the benefits of using cross-functional flowcharts for planning?
  • Cross-functional flowcharts help stakeholders gain a clear understanding of the end-to-end process and how different functions contribute to it.

  • By visualizing the interactions and handoffs between teams or departments, cross-functional flowcharts promote collaboration and coordination, enabling smoother planning and execution.

  • Flowcharts highlight bottlenecks, delays, or redundancies in the process, allowing organizations to identify and address inefficiencies or areas for optimization.

  • Cross-functional flowcharts clarify the roles and responsibilities of each function or department involved, minimizing confusion and enhancing accountability during planning and execution.

  • Flowcharts serve as a common visual language, facilitating effective communication and ensuring that all stakeholders are aligned on the process and its planning requirements.

How do you create a cross-functional flowchart for planning?
  • Identify the process or project to be mapped out.
  • Determine the relevant functions or departments involved and define the swimlanes or columns representing each.
  • List the key activities or steps in the process and place them in the appropriate swimlanes.
  • Connect the activities with arrows to depict the flow and sequence of the process.
  • Add decision points, conditions, or dependencies as necessary.
  • Include labels, annotations, or descriptions to provide clarity and context.
  • Review and validate the flowchart with stakeholders to ensure accuracy and completeness.
Are there any specific tools or software to create cross-functional flowcharts?
Yes, there are several tools and software available for creating cross-functional flowcharts. Some popular options include Creately. This tool provides predefined shapes and templates specifically designed for creating flowcharts and offer features for collaboration, customization, and sharing. With Creately, you can easily drag and drop shapes onto the canvas, connect them with arrows or lines, and customize the appearance and formatting of your flowchart. It also provides collaboration features, allowing multiple team members to work together in real-time, comment, and provide feedback on the flowchart. Creately supports cloud-based storage and sharing options, making it convenient to access and distribute your cross-functional flowcharts.

Author

author image
Nishadha Internet Marketing Manager

Software engineer turned tech evangelist. I handle marketing stuff here at Creately including writing blog posts and handling social media accounts. In my spare time, I love to read and travel.

View all posts by Nishadha →