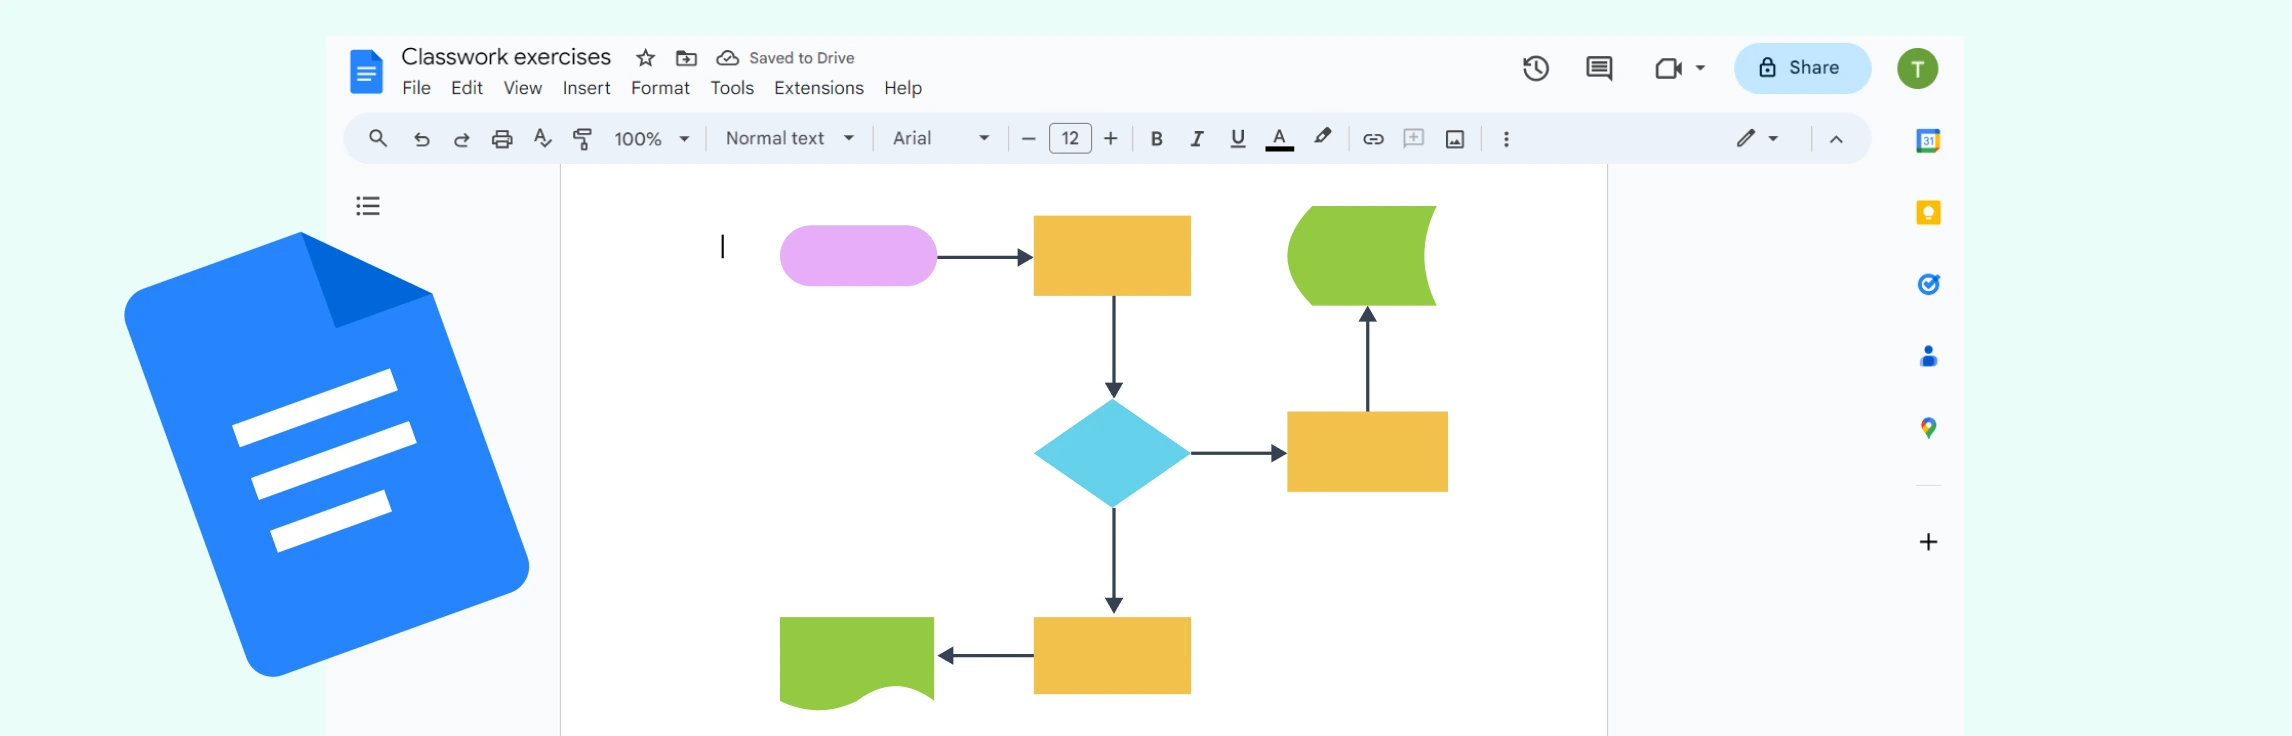
If you want to learn how to make a flowchart in Excel, then this guide is for you. Learn how to build a flowchart in Excel, make it interactive, explore its limitations, and discover a better alternative and free templates to get started today.
What is a Flowchart?
Flowcharts are visual diagrams created using shapes, lines, and labels to illustrate the steps of a process. They break down workflows, decisions, and task sequences into a clear, easy-to-understand format, whether you’re outlining a business procedure, mapping a system, or organizing tasks. Flowcharts are especially useful for simplifying complex information into a structured, visual flow.
How to Create a Flowchart in Excel
Let’s go through the steps of how to make an interactive flowchart in Excel.
Step 1: Turn on the Grid Alignment Tools in Excel
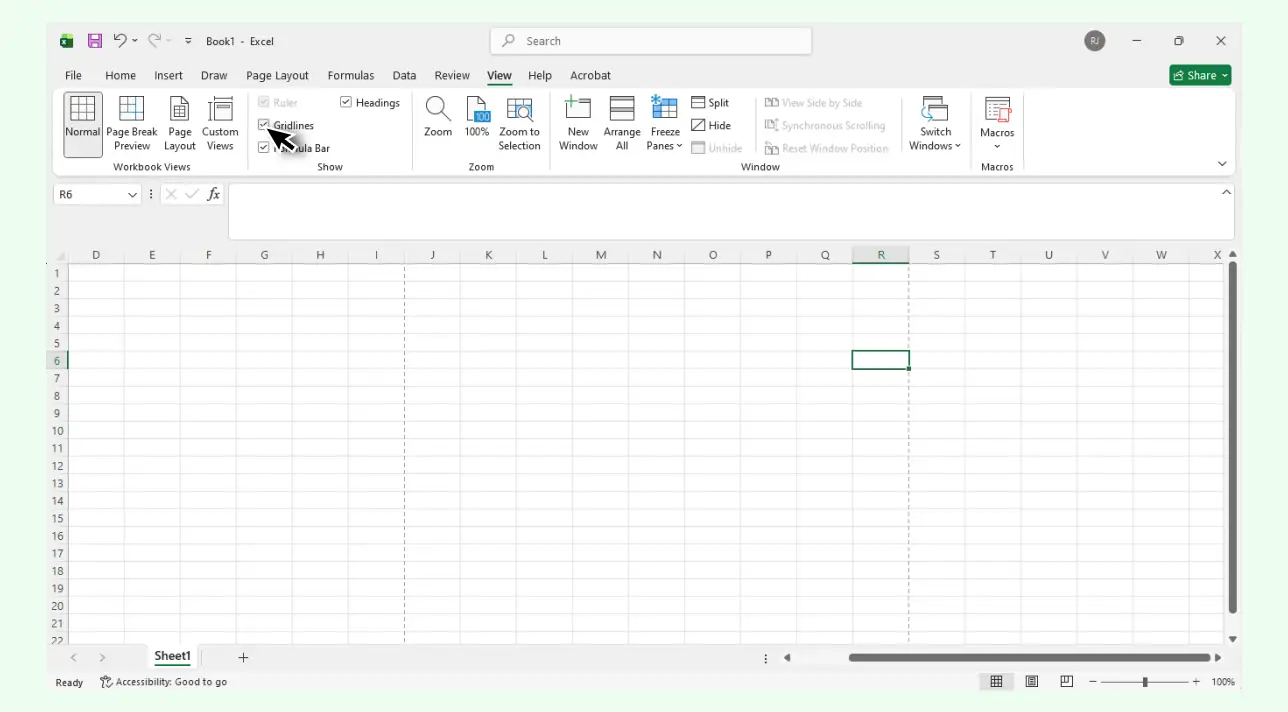
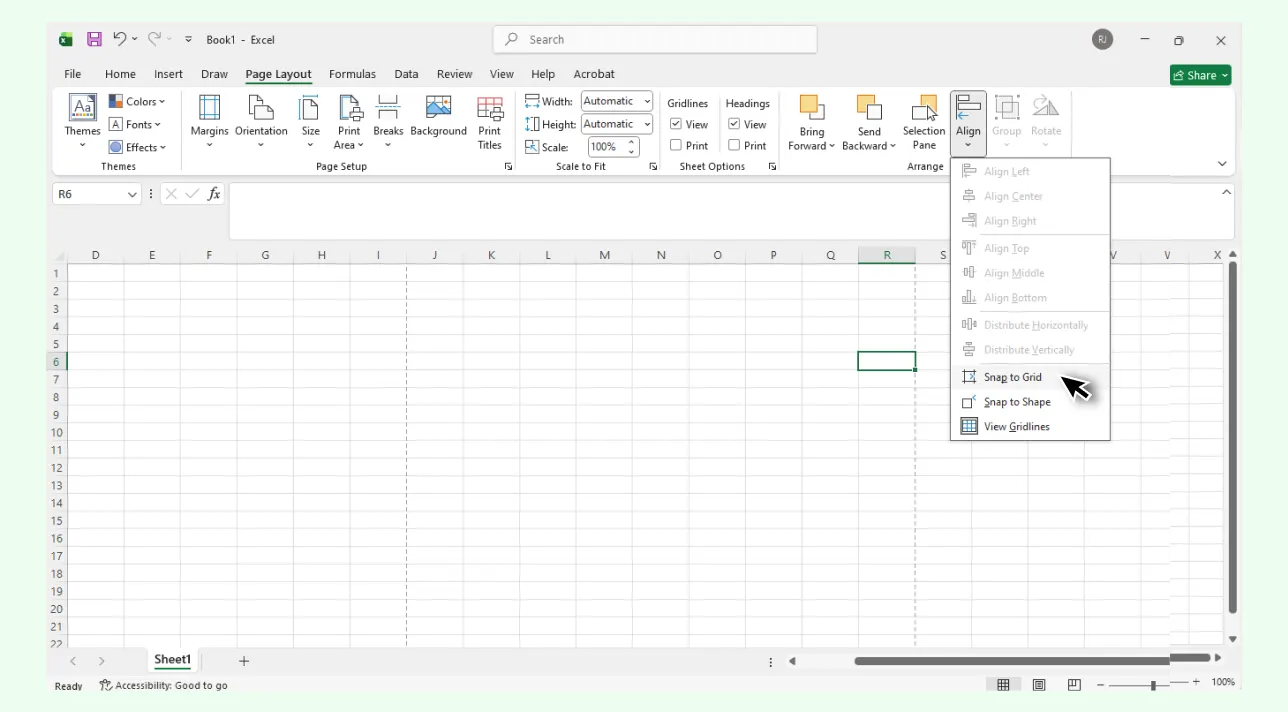
Open a new Excel sheet, go to View → Gridlines (make sure it’s checked) and enable Snap to Grid from Page Layout → Align. This helps keep shapes neatly aligned since Excel doesn’t have automated diagram layouts.
Step 2: Insert Flowchart Shapes
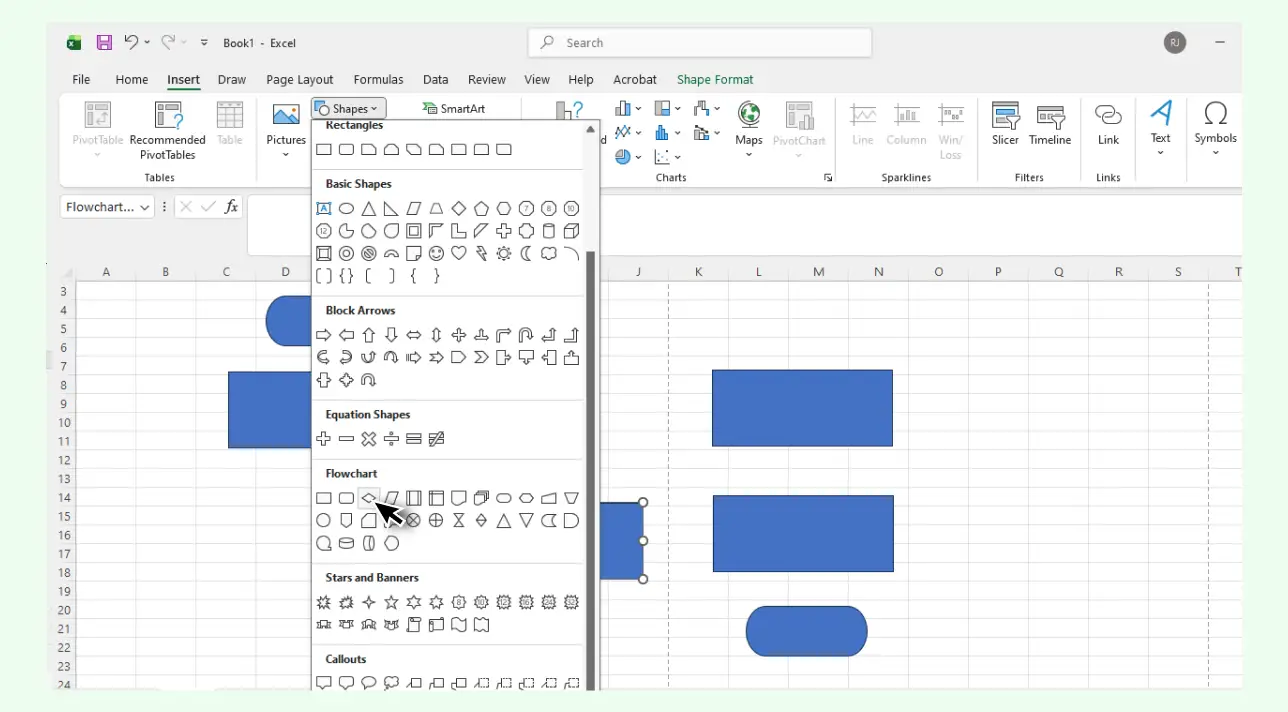
Go to Insert → Shapes and select flowchart symbols like Process, Decision, Terminator, and Arrows. Place each shape on the sheet. Excel includes basic flowchart shapes, but you may need to manually adjust sizing and spacing. Read the flowchart symbols guide to learn about all the standard symbols you may need to use when making flowcharts.
Step 3: Add Text to Each Shape
Click a shape and type directly inside it to add labels for each step. Format using the Home tab.
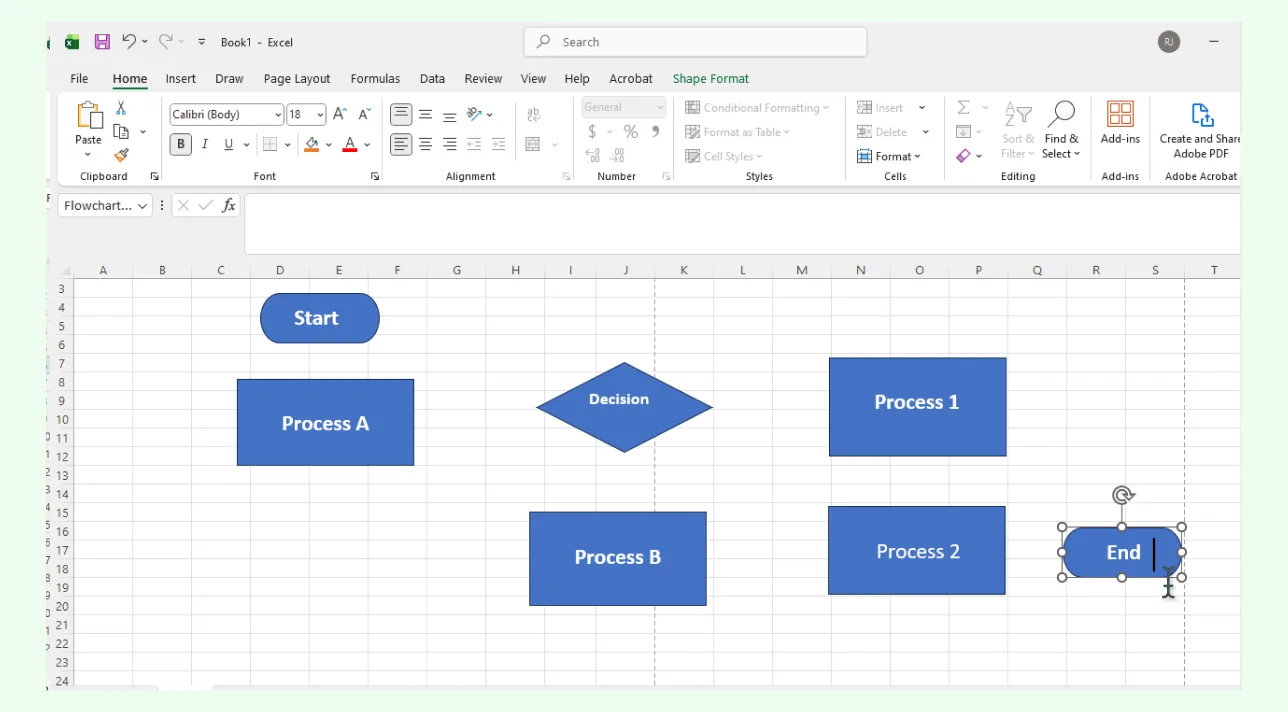
Step 4: Connect Shapes with Arrows
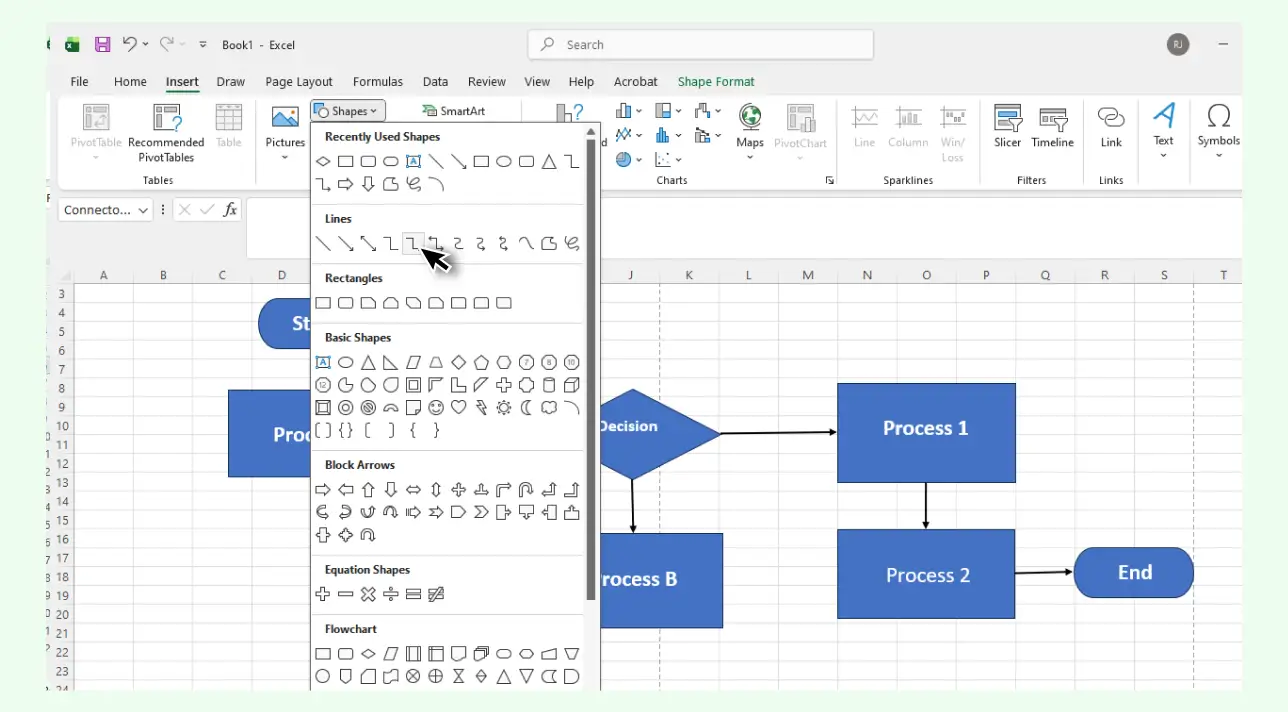
Insert arrows using Insert → Shapes → Lines/Arrows and drag them between shapes to indicate flow. Keep in mind that connectors won’t move automatically if you reposition shapes, so rearranging may take extra adjustments.
Step 5: Make It Interactive with Hyperlinks
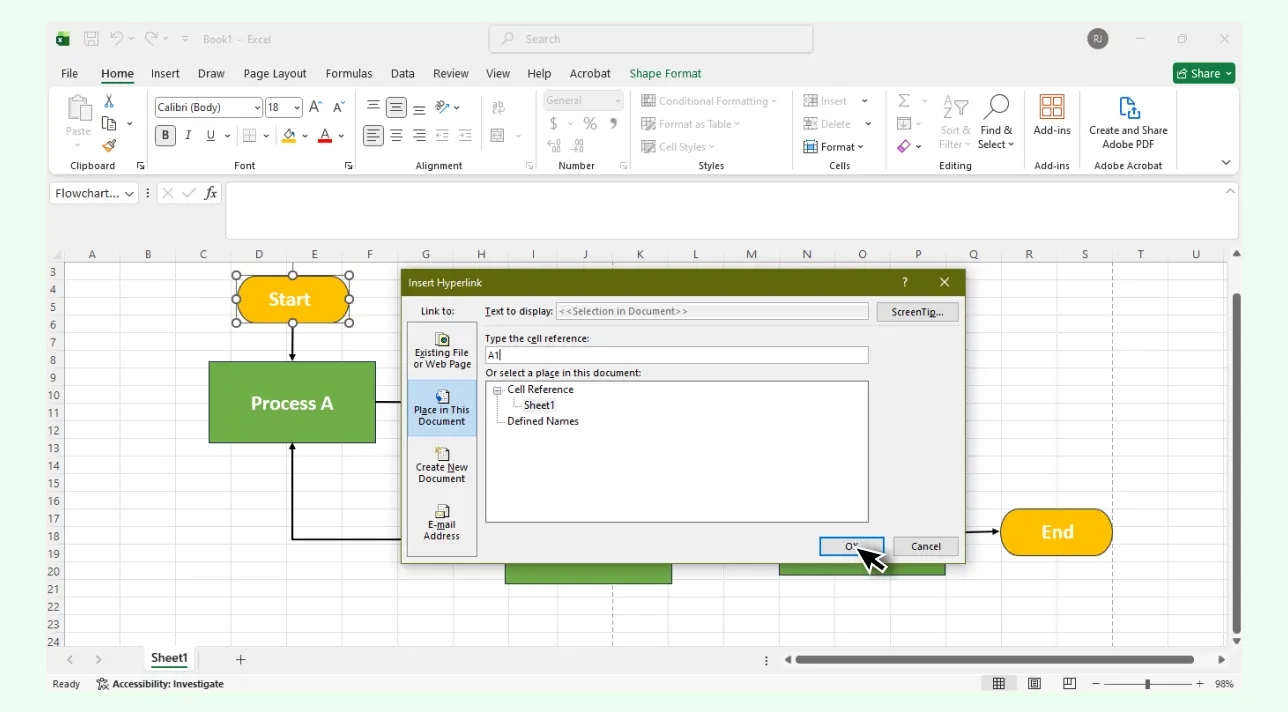
Right-click a shape and choose Link to create interactive navigation. You can link to another worksheet, a specific cell, external files or webpages. This lets users drill down into details without cluttering the main flowchart. Remember to click through the hyperlinks to ensure they work as intended.
Step 6: Add Dropdowns or Form Controls (Optional)
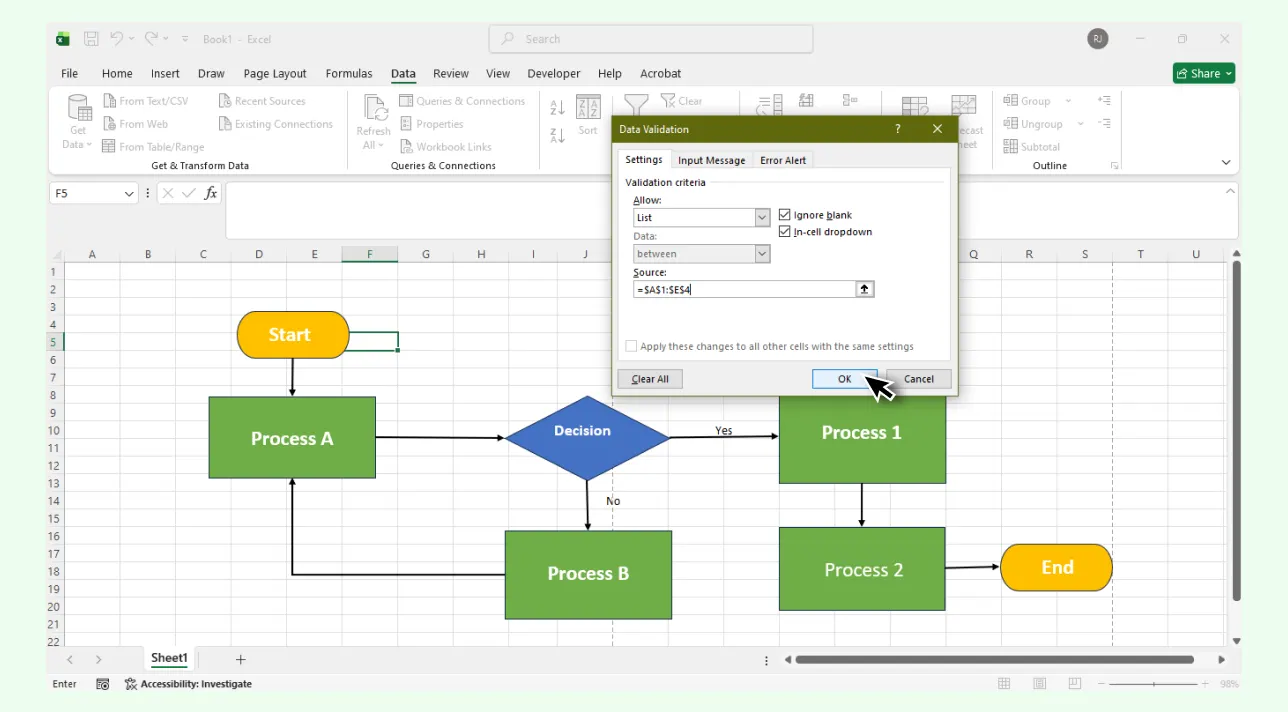
Enable the Developer tab and use Insert to add dropdowns, checkboxes, or buttons. These can trigger filtered views or jump to different sections, useful for more dynamic charts.
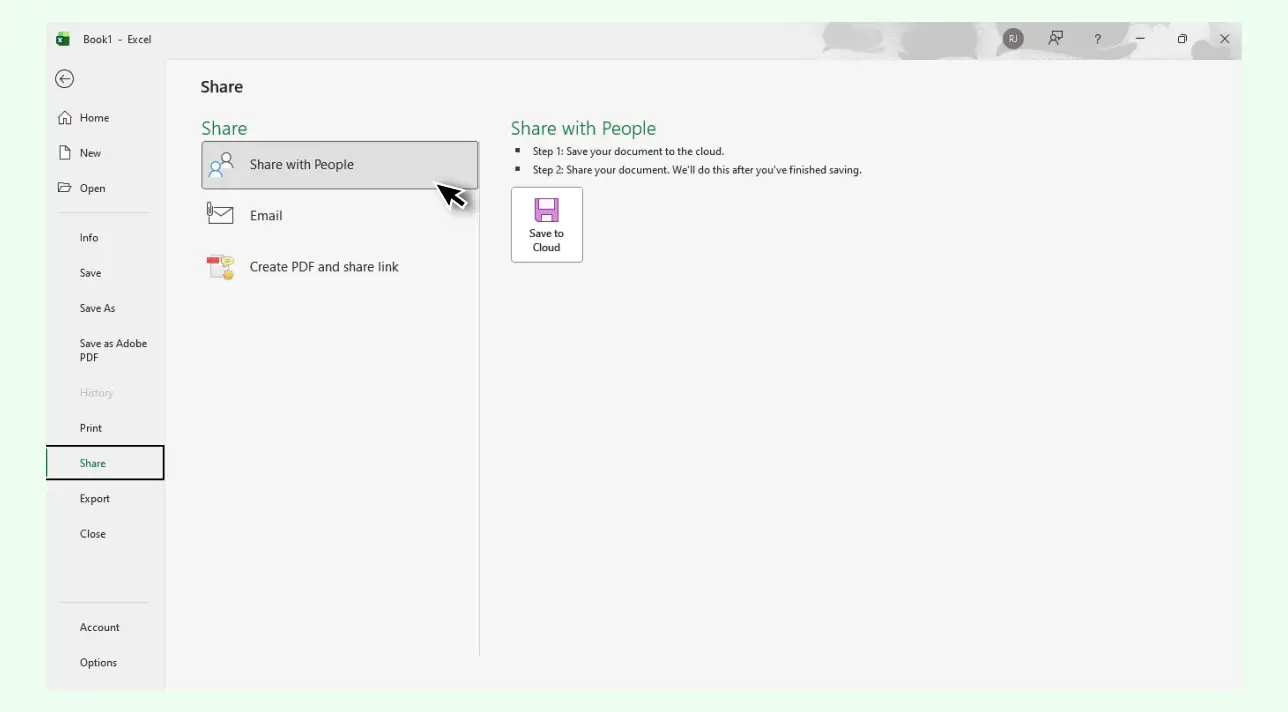
Step 7: Save and Share
Save your workbook and share it with your team. Interactive elements work for anyone viewing the file in Excel.
Limitations of Creating a Flowchart in Excel
No built-in flowchart templates — everything must be created manually.
Shapes and connectors require frequent manual alignment and resizing.
Flowcharts become difficult to manage as they grow in size or complexity.
Limited design flexibility for styling shapes, colors, and icons.
Connectors don’t always stay attached when moving shapes, causing layout issues.
Lacks advanced diagramming tools like automatic spacing, grouping, and smart connectors.
Not ideal for real-time collaboration on complex diagrams.
Hard to maintain structure when printing or exporting larger flowcharts.
Why Creately is the Best Alternative for Creating Flowcharts
If Microsoft Excel flowcharts feel restrictive, Creately’s flowchart software offers a smoother, more powerful way to design and manage process diagrams. Here’s how it overcomes Excel’s limitations
Ease of Use & Canvas Experience
No cramped drawing windows: Work on a spacious, infinite canvas instead of relying on Excel’s limited grid and drawing mode.
Navigate freely: Zoom, pan, and reorganize your diagram without page boundaries getting in the way.
Symbols, Shapes & Templates
Complete symbol library: Access all standard flowchart shapes without manually inserting or reformatting basic shapes.
Ready-to-use templates: Choose from workflow, process, decision tree, and swimlane templates so you don’t have to start from scratch.
Consistent, reusable components: Save custom layouts to reuse in future diagrams for faster creation.
AI Flowchart Generator
Instant Diagram Creation: Produce complete flowcharts from a simple text prompt. The AI handles the structure, layout, and connectors for you. Try Creately’s AI flowchart generator to create your first diagram in moments.
Intelligent AI Suggestions: Get smart recommendations for missing steps, related actions, and logical groupings to keep your workflow clear, structured, and easy to follow.
Connectors & Layout Behavior
Reliable connectors: Arrows stay attached when you move shapes with no broken or misaligned lines like in Excel.
Faster editing: Snap-to-grid, auto-alignment, and smart guides reduce the time spent fixing shapes or resizing elements.
Styling & Visual Quality
Automatic visual polish: Smart themes, color presets, and styling tools keep diagrams clean without manual formatting.
Professional consistency: Apply unified styles across the entire diagram with one click to maintain a cohesive look.
Collaboration & Teamwork
Real-time collaboration: Teammates can co-edit, comment, and update the same diagram simultaneously with no version clashes.
Shared workspace context: Keep discussion threads, notes, and decision history next to the diagram to avoid scattered files.
Scalability & Process Documentation
Scales without breaking: Large or complex flowcharts expand smoothly on the infinite canvas, avoiding Excel’s layout issues.
Ideal for full process documentation: Combine flowcharts, notes, SOPs, and supporting diagrams in one connected workspace.
Link sub-processes: Connect diagrams together to create multi-level, end-to-end process systems without clutter.
Creately Vs Excel: Flowchart Features Comparison
Here’s how creating flowcharts in Excel compares to using Creately’s dedicated flowcharting tools.
Feature | Excel | Creately |
Flowchart Symbols | Limited shapes that need manual formatting | Complete set of standard flowchart symbols ready to use |
Smart Connectors | Lines detach or misalign when shapes move | Connectors stay attached and auto-adjust with movement |
Editing Experience | Built on a rigid grid; shapes feel constrained | Fluid drag-and-drop editing on a flexible, infinite canvas |
Styling & Formatting | Basic color and line controls | Professional themes, presets, and extensive styling options |
Templates | No built-in flowchart templates | Wide range of ready-made templates for different workflows |
Collaboration | File sharing only; real-time updates can conflict | True real-time collaboration with comments and multi-cursor editing |
Scalability | Large diagrams become cluttered or hard to manage | Canvas scales effortlessly for small to highly complex flows |
Export Options | Limited image export | High-quality PNG, SVG, PDF, and embeddable diagram formats |
Linking & Attachments | Can’t link steps to documents or other diagrams | Link flowcharts to SOPs, sub-processes, and related diagrams |
Process Documentation | Best for simple or linear flows | Ideal for detailed documentation across entire systems |
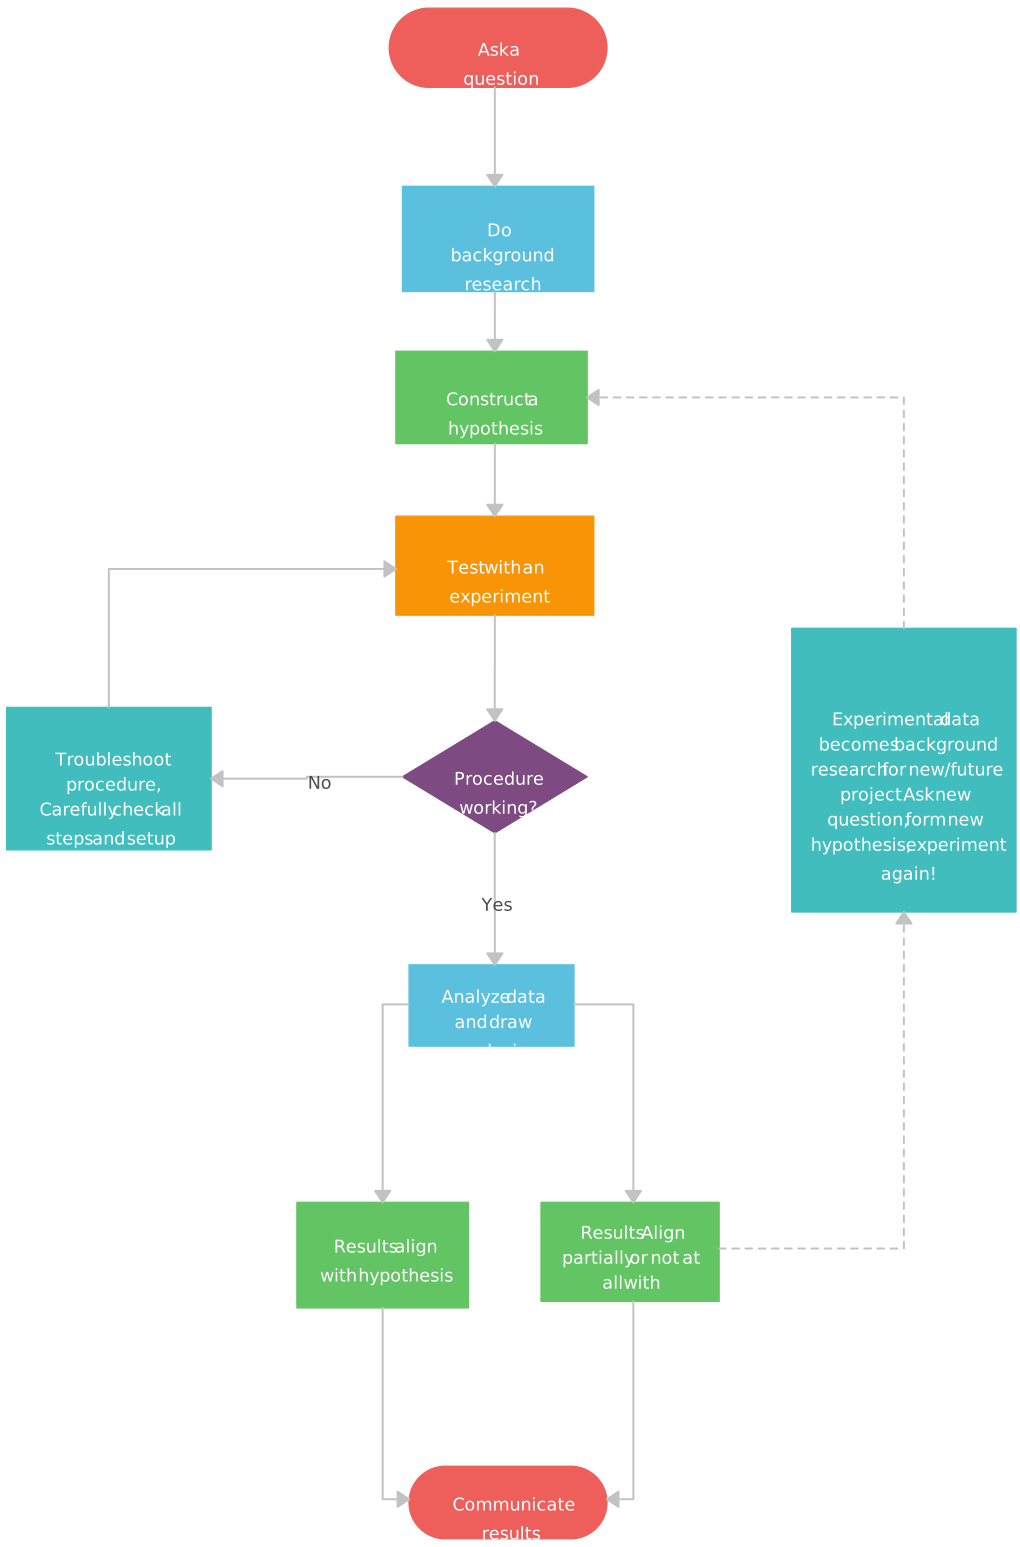
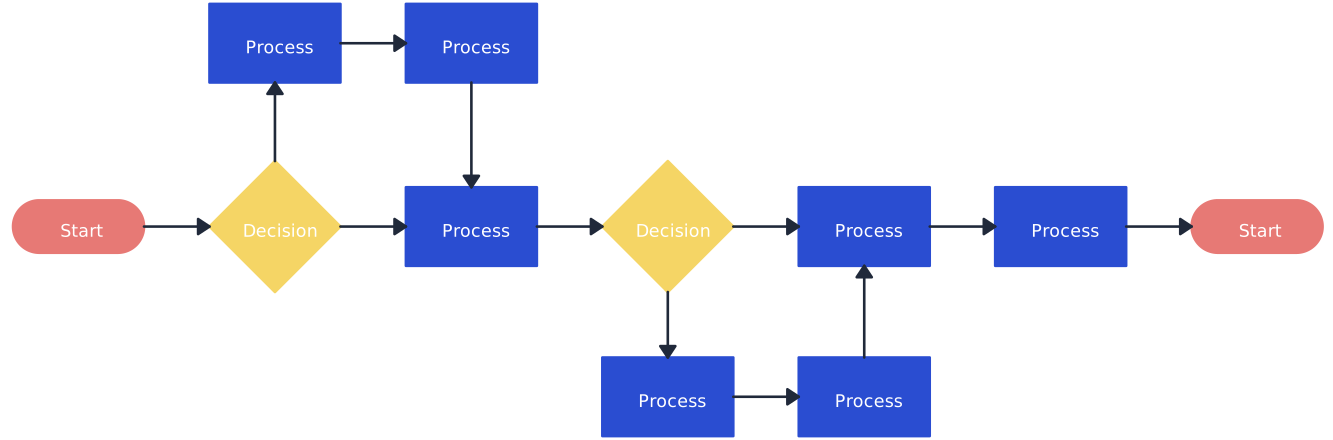
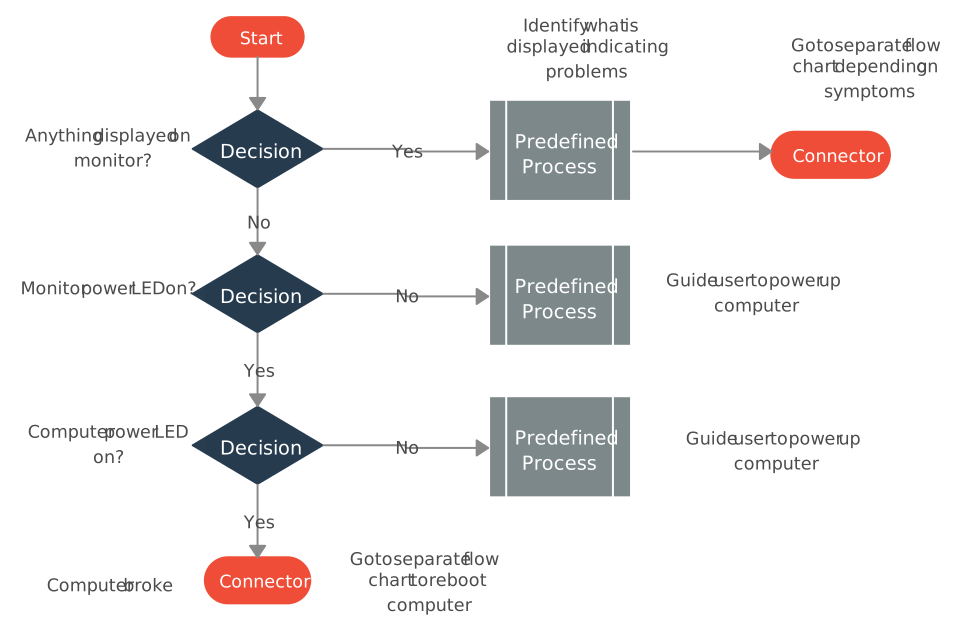
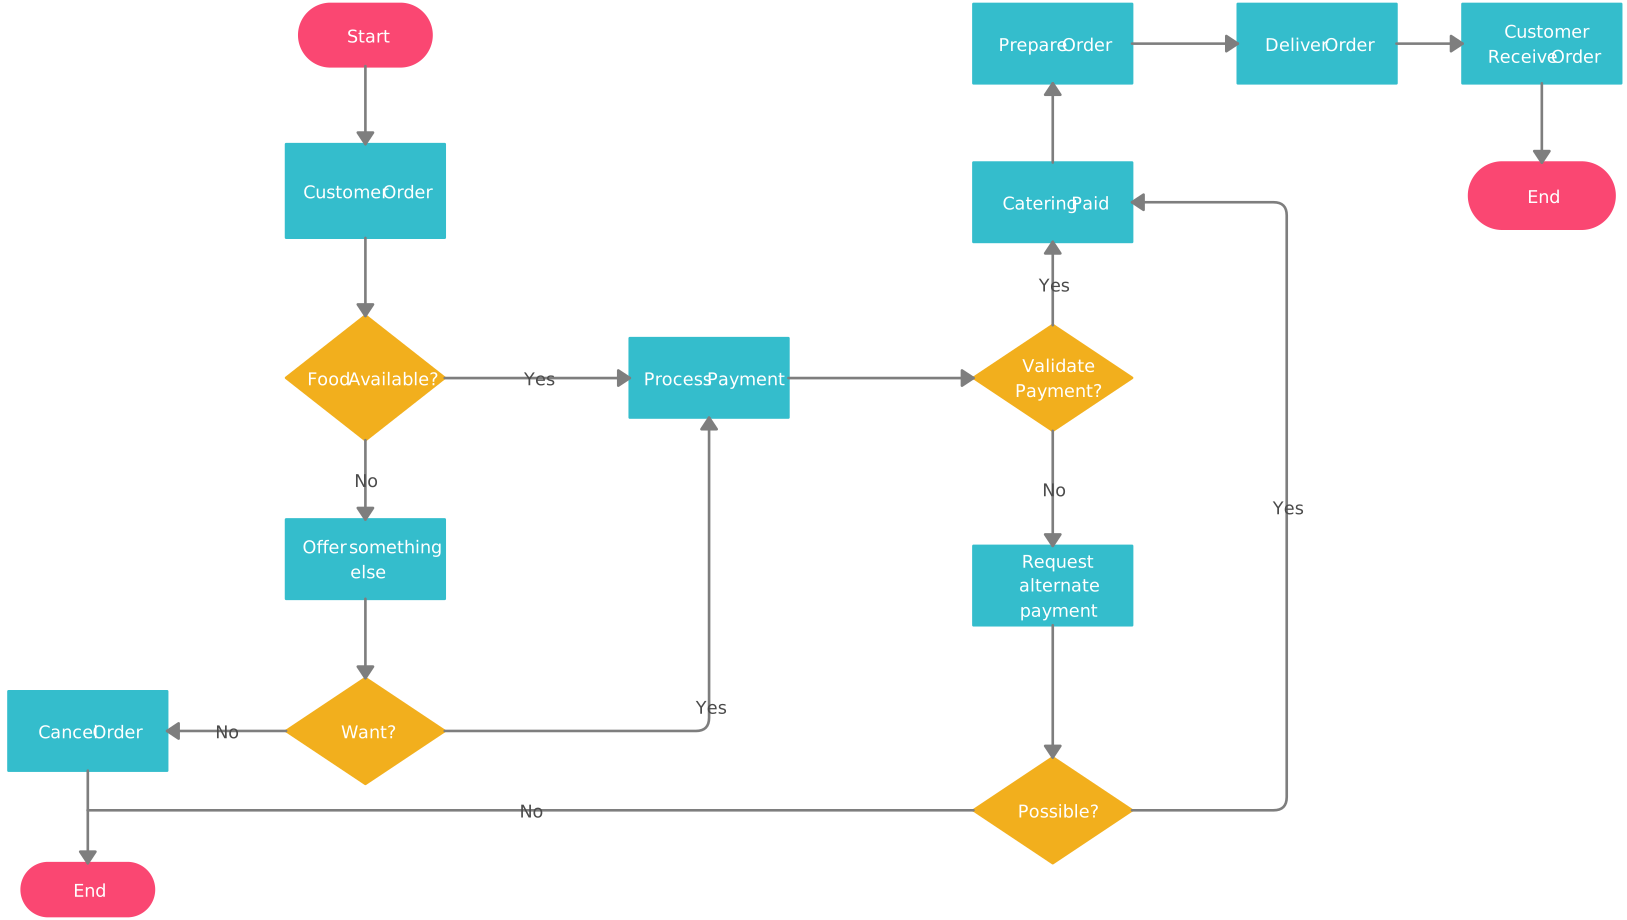
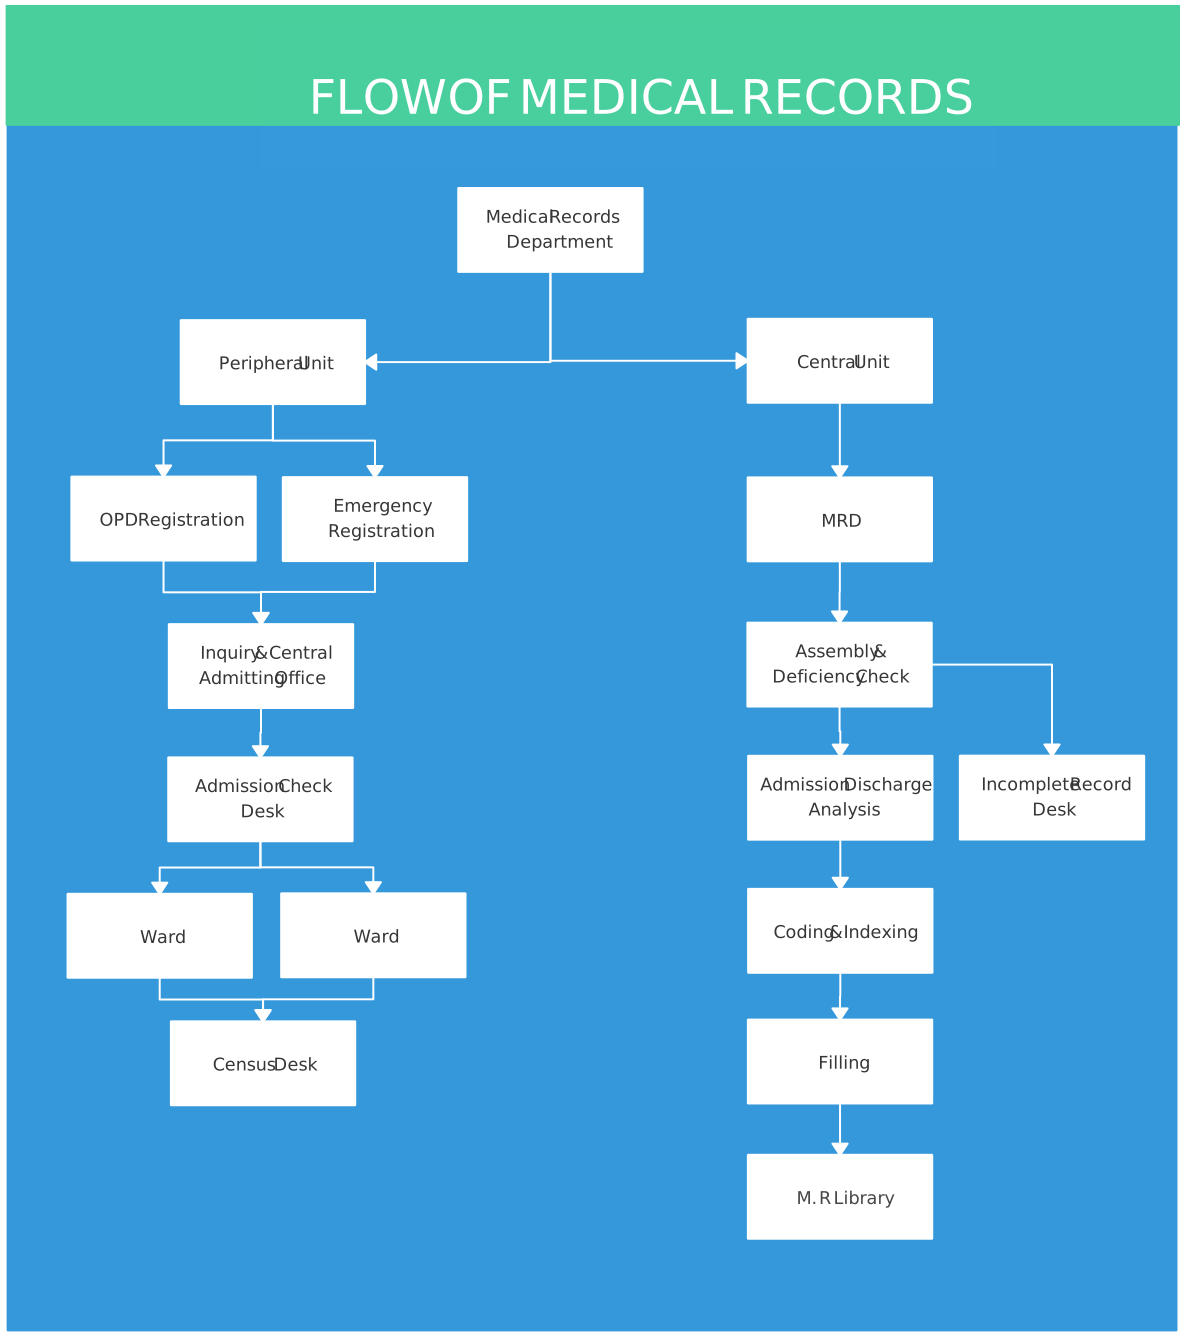
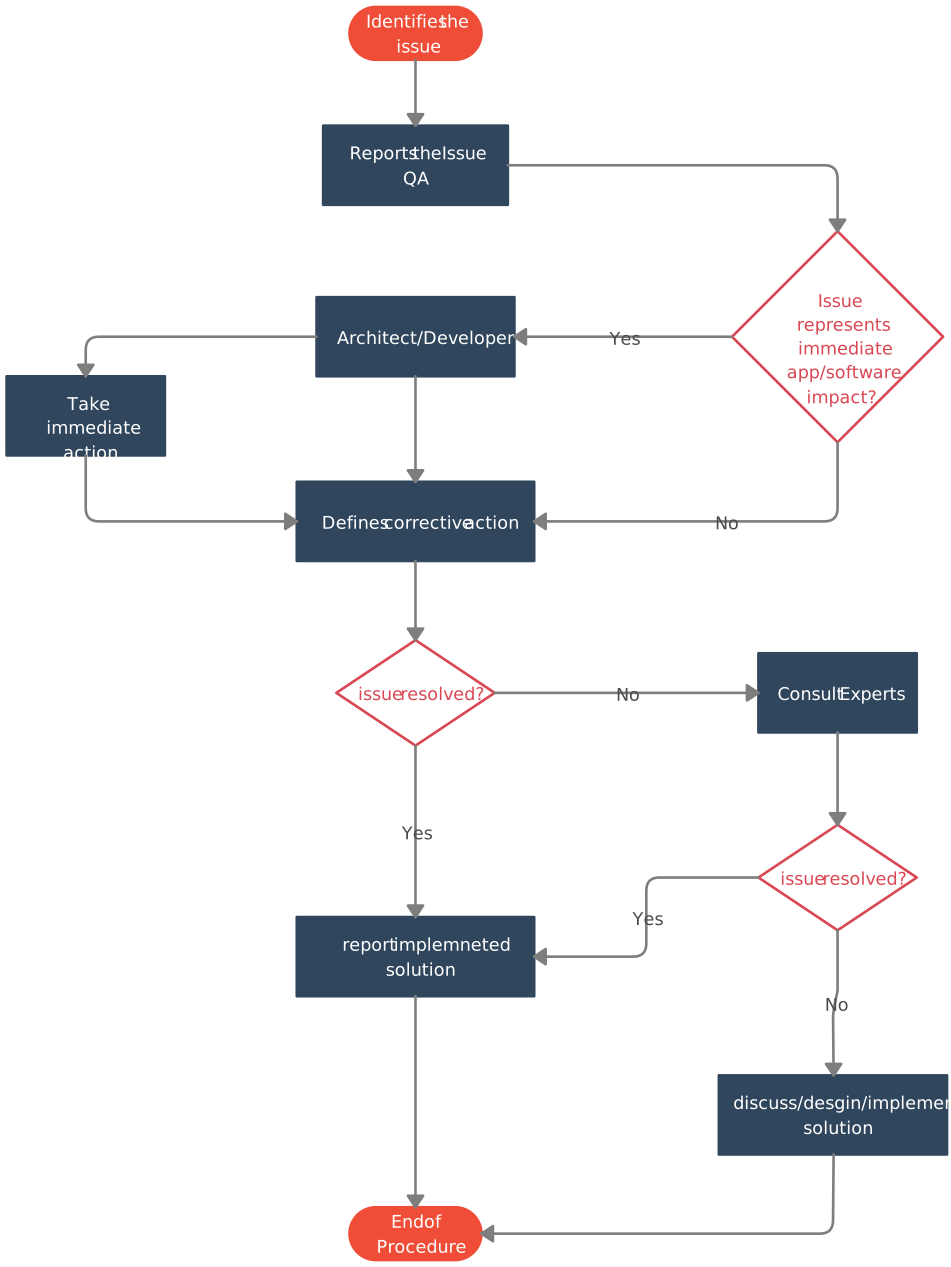
Free Flowchart Templates to Get Started


Helpful Resources for Making Flowcharts
A step-by-step guide to making flowcharts in Microsoft Word.
A step-by-step guide to making flowcharts in Microsoft PowerPoint.
Learn which symbols to use and best practices for using them when creating flowcharts.
Discover the flowchart creator tool to visualize your workflows.