An Event-Driven Process Chain (EPC) diagram is a valuable tool for visualizing and modeling business processes. It helps organizations understand how events and functions are connected, improving workflow and identifying areas for improvement.
This guide will cover the basics of EPC diagrams, including key symbols, components, and steps to create them. Whether you’re new to process modeling or refining your skills, this guide will provide the essential knowledge to use EPC diagrams effectively.
What Is an EPC Diagram
An Event-Driven Process Chain diagram or EPC diagram is a structured visual representation used to map out business processes in a clear and logical sequence. It helps organizations document, analyze, and optimize workflows by illustrating the relationships between key process elements such as events, functions (tasks), decision points, and organizational roles. An EPC diagram follows a standardized notation that makes it easier to understand how different steps within a process are triggered and connected.


At its core, an EPC diagram consists of events (which describe the state of the process at a given point), functions (which represent activities or tasks that need to be performed), and logical connectors (such as AND, OR, and XOR, which define decision-making paths). These elements work together to provide a structured view of how a process flows from start to finish.
EPC diagrams are widely used in business process management (BPM), enterprise resource planning (ERP) systems, and workflow automation. By visually mapping out a process, businesses can identify inefficiencies, streamline operations, and improve communication across teams. Whether used for existing process documentation or designing new ones, EPC diagrams play a crucial role in ensuring efficiency, consistency, and clarity in process execution.
EPC Diagram Symbols
Event-driven process chain diagrams model and visualize business processes by showing the sequence of events and functions. They use specific symbols to clearly represent components and relationships, ensuring consistency in documentation.
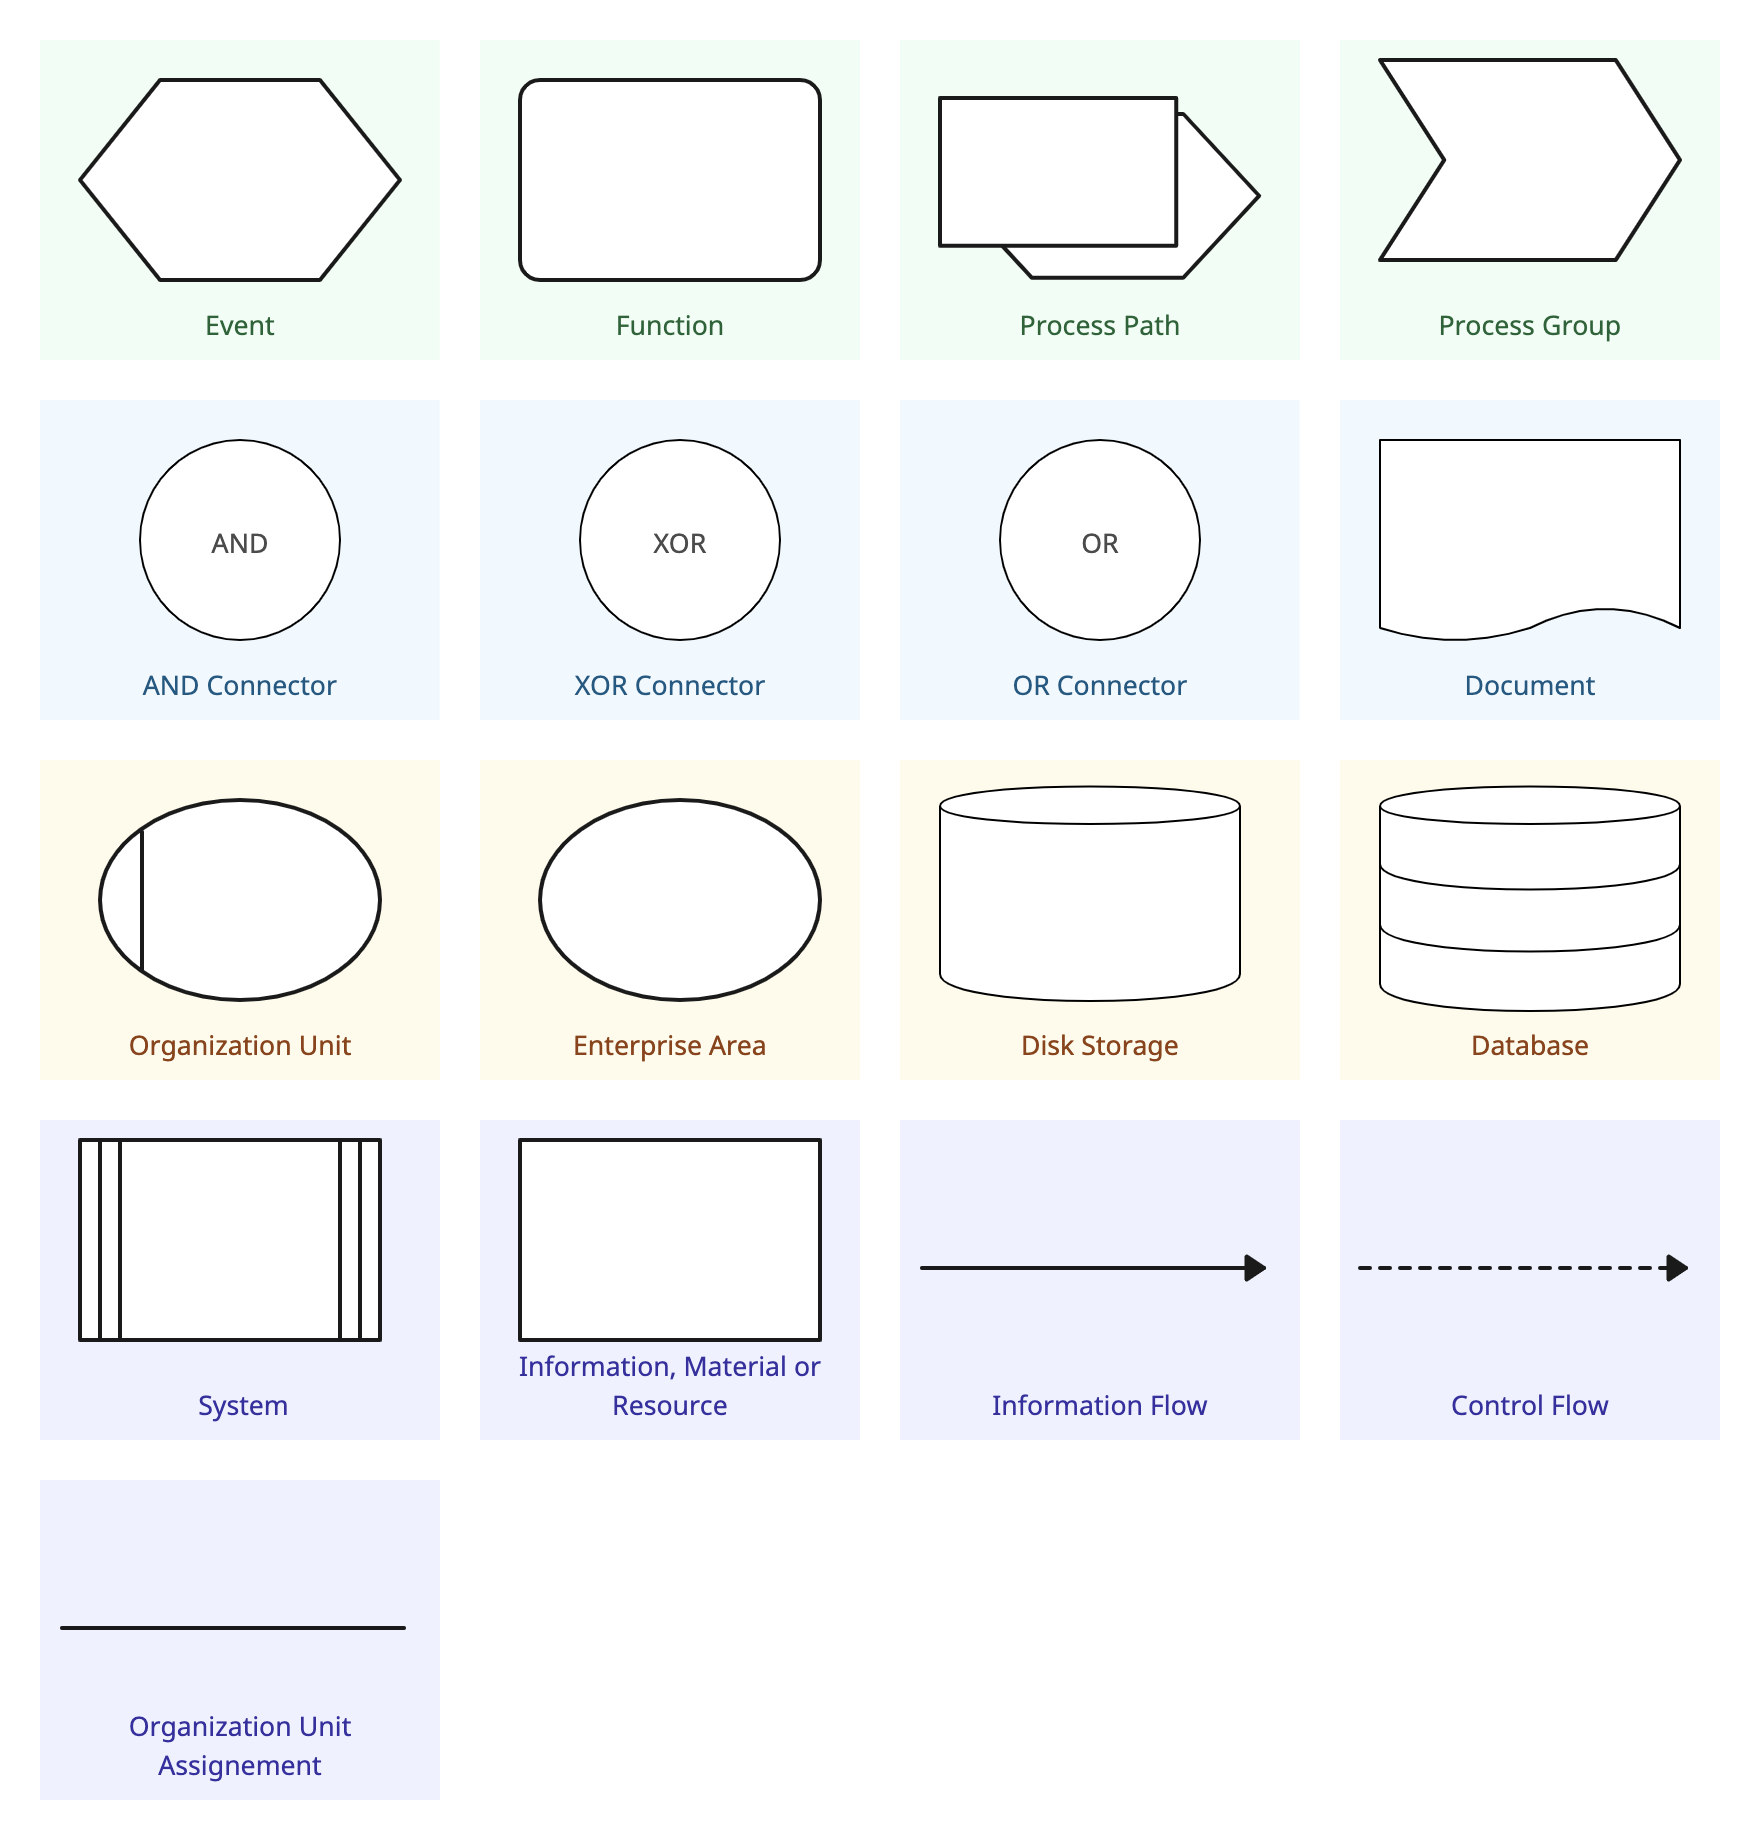
| Symbol | Definition |
| Event | Represents a specific state or condition that triggers or results from a function. Events define process starting points, intermediate states, or outcomes. |
| Function | Represents an activity, task, or operation performed within a process to transform inputs into outputs. |
| Process Path | Acts as a navigation link between different processes or subprocesses, helping to connect related workflows. |
| Process Group | Represents a collection of interrelated processes grouped for better organization and management. |
| Connectors |
|
| Document | Represents a physical or digital document used within the process, such as forms, reports, or contracts. |
| Organization Unit | Represents a specific department, role, or team responsible for performing a function. |
| Enterprise Area | Identifies a broader business unit, division, or area within an organization responsible for overseeing a process. |
| Disk Storage | Represents stored data on a disk, such as backups, logs, or records. |
| Database | Represents structured data storage in a database system, used for retrieving and managing information. |
| System | Represents an IT system or software application that supports or executes a function within the process. |
| Information/Material/Resources | Represents inputs such as data, physical materials, or resources used within a process. |
| Information Flow | Depicts the transfer of data, documents, or messages between functions, events, or organizational units. |
| Control Flow | Indicates the sequence and direction of process execution, guiding the transition between events, functions, and connectors. |
| Organization Unit Assignment | This links an organizational unit (e.g., department or role) to a specific function, showing which part of the organization is responsible for carrying out that function. |
How to Create an EPC Diagram
Follow these steps to create an EPC diagram that effectively models your business process, facilitating analysis, communication, and optimization.
Step 1. Define the scope and objectives
Begin by clearly identifying the specific business process you intend to model. Understanding the boundaries and purpose of this process is crucial. Determine the objectives behind creating the EPC diagram—whether it’s for process optimization, documentation, training, or identifying inefficiencies. This clarity will guide the level of detail and focus required in your diagram.
Step 2. Gather detailed information
Engage with stakeholders involved in the process to collect comprehensive information. Conduct interviews, workshops, or surveys to understand each step of the process. Additionally, review existing documentation, such as standard operating procedures, manuals, and reports, to ensure accuracy and completeness in your diagram.
Step 3. Choose the right diagramming tool
Select a diagramming tool that supports EPC modeling. Creately is an excellent option for creating EPC diagrams, offering a user-friendly interface and a variety of pre-built templates and symbols specifically designed for process mapping. With Creately, you can easily draw, customize, and collaborate on EPC diagrams in real-time, making it ideal for both beginners and advanced users.
Step 4. Identify and define EPC elements
Break down the process into its fundamental components:
- Events: These are passive elements that describe the circumstances under which a function or a process works or the state resulting from a function or a process. For example, “requirement captured” or “material in stock.”
- Functions: Active elements representing tasks or activities performed within the process, such as “capture requirement” or “check material in stock.”
- Logical connectors: Symbols like AND, OR, and XOR that define the flow of control between events and functions, allowing for parallel or alternative execution paths.
- Organization units: Elements that determine which organization within the structure of an enterprise is responsible for a specific function, such as “sales department” or “procurement department.”
- Information objects: Representations of data or documents utilized or produced during the process, like “material” or “order.”
Step 5. Construct the EPC diagram
With all elements identified:
- Initiate with a triggering event: Place the initial event that starts the process at the top or beginning of your diagram.
- Sequence functions and events: Alternate between functions and events to depict the process flow accurately. Ensure that each function leads to an event and vice versa.
- Apply logical connectors appropriately: Use connectors to represent decision points, parallel processes, or converging paths. For example, an AND connector indicates parallel tasks, while an XOR represents exclusive choices.
- Assign organizational responsibilities: Link functions to their respective organizational units to clarify roles and responsibilities within the process.
- Attach relevant information objects: Connect data or documents to the functions where they are used or generated, providing a comprehensive view of information flow.
Step 6. Review, validate, and refine
After constructing the diagram:
Collaborate with stakeholders: Share the EPC diagram with team members and process participants to gather feedback. Their insights can help identify any inaccuracies or missing elements.
Refine the diagram: Incorporate feedback to adjust and improve the diagram, ensuring it accurately reflects the process and is easy to understand.
Step 7. Finalize and distribute
Once validated:
Ensure clarity and consistency: Double-check that all symbols are used consistently and that the diagram is free from ambiguities.
Share the diagram: Distribute the finalized EPC diagram to relevant stakeholders. Consider integrating it into process documentation, training materials, or workflow management systems to serve as a reference for process execution and improvement.
EPC Diagram Templates
Below, you’ll find ready-to-use EPC diagram templates that can be customized to fit your specific workflow needs.
Process Attributes EPC

Simple Event Driven Process Chain (EPC)

EPC Diagram Example

Event Driven Process Diagram

Event Driven Process Diagram

Importance of EPC Diagrams in Business Process Modeling
EPC diagrams play a vital role in business process modeling by providing a clear and structured way to visualize workflows. For businesses these diagrams are crucial for several reasons:
1. Clear understanding of processes
EPC diagrams offer a visual representation of how tasks, events, and decisions flow within a business process. By breaking down complex workflows into simple, easy-to-understand elements, businesses can better grasp how different steps interact. This clarity helps teams and stakeholders at all levels—whether in operations, management, or IT—understand the process more thoroughly, making it easier to spot inefficiencies or bottlenecks.
2. Identifying areas for improvement
One of the key benefits of EPC diagrams is their ability to highlight process inefficiencies. By mapping out a process step-by-step, organizations can pinpoint where delays, redundancies, or errors occur. This provides an opportunity for process optimization, helping businesses increase efficiency, reduce costs, and improve overall productivity.
3. Better communication across teams
EPC diagrams foster better communication and collaboration across departments. With a clear visual map of how a process works, teams in different areas—such as sales, finance, or customer service—can align their efforts and work together more effectively. This is especially important in large organizations where multiple teams are involved in complex workflows.
4. Streamlining compliance and documentation
For industries that require compliance with regulations (e.g., healthcare, finance, manufacturing), EPC diagrams help ensure that all steps in a process are properly documented and compliant with standards. Having a visual model makes it easier to show auditors and regulators how processes are being followed, streamlining the compliance process.
5. Improving decision-making
By illustrating the various paths and decision points in a process, EPC diagrams provide valuable insights that support better decision-making. Managers can use these diagrams to evaluate different scenarios, assess risks, and make informed choices about process adjustments or improvements.
When to Use EPC Diagrams
The application of EPC diagrams in business helps organizations document, analyze, and improve processes. Here are key scenarios where EPC diagrams can improve business performance.
1. Process mapping and documentation
Whenever a company wants to clearly document how a specific process works, an EPC diagram is a great tool. It helps break down complex workflows into easy-to-understand visual steps. This is useful for businesses that need to formalize their operations, especially when they want to standardize procedures or onboard new employees. By mapping out processes, businesses can ensure consistency and clarity across teams.
2. Identifying and resolving process bottlenecks
When a business notices inefficiencies or delays in its operations, EPC diagrams can be used to analyze the workflow and identify bottlenecks. For example, if there’s a delay in processing customer orders, an EPC diagram can help pinpoint exactly where the holdup occurs. By visualizing the process in detail, companies can make data-driven decisions to improve workflow efficiency.
3. Improving compliance and meeting regulations
In industries like healthcare, finance, and manufacturing, compliance with regulations is critical. EPC diagrams help companies map out and document processes to ensure they meet regulatory requirements. For instance, in the healthcare sector, an EPC diagram could show the process of patient intake and treatment, ensuring all necessary steps are followed to comply with healthcare laws. This documentation can also serve as evidence during audits or inspections.
4. Process optimization and continuous improvement
EPC diagrams are perfect for companies aiming to optimize their processes over time. Once a process is mapped out, businesses can analyze it to find opportunities for improvement. Whether it’s reducing unnecessary steps, automating certain tasks, or reallocating resources, EPC diagrams provide a clear overview that helps businesses make changes for continuous improvement. This is particularly useful for organizations adopting lean management or Six Sigma methodologies.
5. Training and onboarding
When training new employees, especially in large organizations, it can be difficult to explain complex processes through written instructions alone. EPC diagrams simplify this by providing a visual tool that helps new hires quickly understand the steps they need to follow. For example, a customer service department can use an EPC diagram to show how to handle a customer complaint from start to finish, making it easier for new team members to grasp the workflow.
6. Cross-departmental collaboration
EPC diagrams are especially helpful in businesses where multiple departments are involved in a single process. For example, in a manufacturing company, the production, quality control, and logistics teams might each be responsible for different steps in the process. An EPC diagram helps visualize how these teams interact and how their tasks depend on one another, fostering better collaboration and coordination.
7. Software and system design
In industries that rely on complex software or systems, EPC diagrams are used to map out processes for system design and optimization. This is particularly useful for IT teams who need to understand how software modules interact within a larger business process. EPC diagrams help identify system requirements and ensure that the software supports business operations efficiently.
Benefits of Event-Driven Process Chain Diagrams
EPC diagrams offer several benefits that can greatly improve business processes. Here are some key advantages:
1. Clear visualization of workflows
EPC diagrams make complex processes easier to understand by providing a visual map of each step, ensuring everyone in the organization is on the same page.
2. Improved decision-making
By providing insights into process flows, EPC diagrams help businesses make smarter, more informed decisions, such as identifying bottlenecks and evaluating alternatives.
3. Process optimization and efficiency
EPC diagrams highlight inefficiencies, allowing businesses to streamline processes, reduce waste, and improve overall efficiency.
4. Enhanced collaboration and communication
With a common visual language, EPC diagrams improve cross-functional communication, ensuring smoother workflows and better teamwork.
5. Better documentation and compliance
For regulated industries, EPC diagrams ensure processes are documented and compliant with laws, making it easier to meet audit requirements.
6. Streamlined training and onboarding
EPC diagrams help new employees understand processes quickly, reducing training time and improving onboarding efficiency.
7. Continuous improvement
By regularly reviewing EPC diagrams, businesses can identify areas for improvement and stay competitive by optimizing operations over time.
History of Event-Driven Process Chains
Event-driven Process Chains (EPC) are one of the popular types of flowcharts used for business process modeling, illustrating the sequence of events and functions within an organization. Developed in the early 1990s by Professor August-Wilhelm Scheer and his colleagues at the University of Saarland in Germany, EPCs were created to provide a clear and structured method for documenting and analyzing business processes.
The development of EPCs was part of a broader initiative known as the Architecture of Integrated Information Systems (ARIS), aimed at improving the design and implementation of information systems. EPCs gained widespread adoption across various industries, particularly for modeling processes in enterprise resource planning (ERP) systems like SAP R/3.
Over time, EPCs have evolved, with various adaptations and extensions developed to capture different process patterns and meet specific modeling needs. This evolution has led to a diverse range of EPC variants, each tailored to address unique business requirements.
Today, EPCs remain a valuable tool for organizations seeking to visualize, analyze, and improve their business processes, offering a standardized approach to process documentation and optimization.
How to Use Creately to Create EPC Diagrams
Creately makes it easy to create EPC diagrams with its intuitive features designed for process modeling. Whether you’re mapping a simple workflow or a complex business process, Creately’s tools help you build clear and structured EPC diagrams effortlessly.
1. Start with a template or a blank canvas
Creately offers pre-designed EPC diagram templates that you can customize to fit your needs. If you prefer to start from scratch, you can use a blank canvas and add elements as needed. The drag-and-drop interface makes it easy to position and organize your diagram.
2. Use the built-in EPC symbols
Creately provides a rich library of EPC diagram symbols, including events, functions, connectors, organizational units, documents, and more. You can quickly drag and drop these elements onto the canvas and connect them to represent your process flow accurately.
3. Customize and style your diagram
Easily adjust colors, shapes, and line styles to make your EPC diagram visually clear and aligned with your company’s branding. Creately allows you to resize, label, and format elements to ensure your diagram is easy to read and understand.
4. Collaborate in real time
With real-time collaboration, multiple team members can work on the same EPC diagram simultaneously. You can share the diagram with colleagues, add comments, and make instant updates, making it perfect for process planning and team discussions.
5. Access anywhere, anytime
Since Creately is cloud-based, you can access your EPC diagrams from any device, whether you’re at the office or working remotely. Your work is automatically saved, so you never lose progress.
6. Export and share with ease
Once your EPC diagram is complete, you can export it in different formats like PNG, JPEG, PDF, or SVG. This makes it easy to include in reports, presentations, or share with stakeholders.
Conclusion: What Is an EPC Diagram
In conclusion, EPC diagrams are an essential tool for visualizing and improving business processes. By understanding the key components and symbols, you can effectively model workflows, identify inefficiencies, and optimize operations. Whether you’re documenting existing processes or planning improvements, EPC diagrams provide a clear and structured approach to process management. With this guide, you now have the knowledge to start using EPC diagrams to enhance your business processes.
References
M. Nüttgens, Feld, T. and Zimmermann, V. (1998). Business Process Modeling with EPC and UML: Transformation or Integration? pp.250–261. doi:https://doi.org/10.1007/978-3-642-48673-9_17.
Loos, P. and Allweyer, T. (1998). Object-orientation in business process modeling through applying event driven process chains (EPC) in UML. [online] IEEE Xplore. doi:https://doi.org/10.1109/EDOC.1998.723246.
FAQs About EPC Diagrams
What is an EPC diagram used for?
What are the main components of an EPC diagram?
How do EPC diagrams help in business process improvement?
What is the difference between EPC and BPMN diagrams?