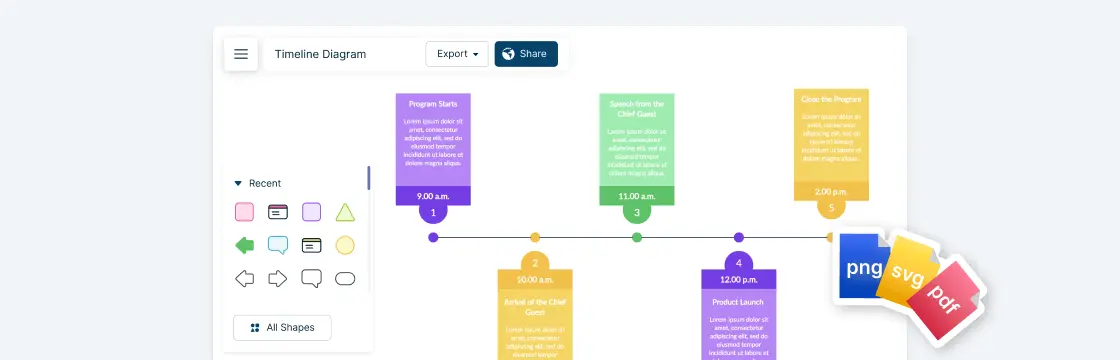
A timeline is a simple but powerful way to show how events unfold over time, whether you’re mapping a project plan, telling a historical story, or tracking milestones for a presentation. By laying information out in chronological order, timelines make complex sequences easier to follow at a glance. In this guide, we’ll walk you through everything you need to know on how to make a timeline. From gathering your information to choosing the right layout and styling your timeline for impact, you’ll learn step by step how to make your timelines both informative and easy to understand.
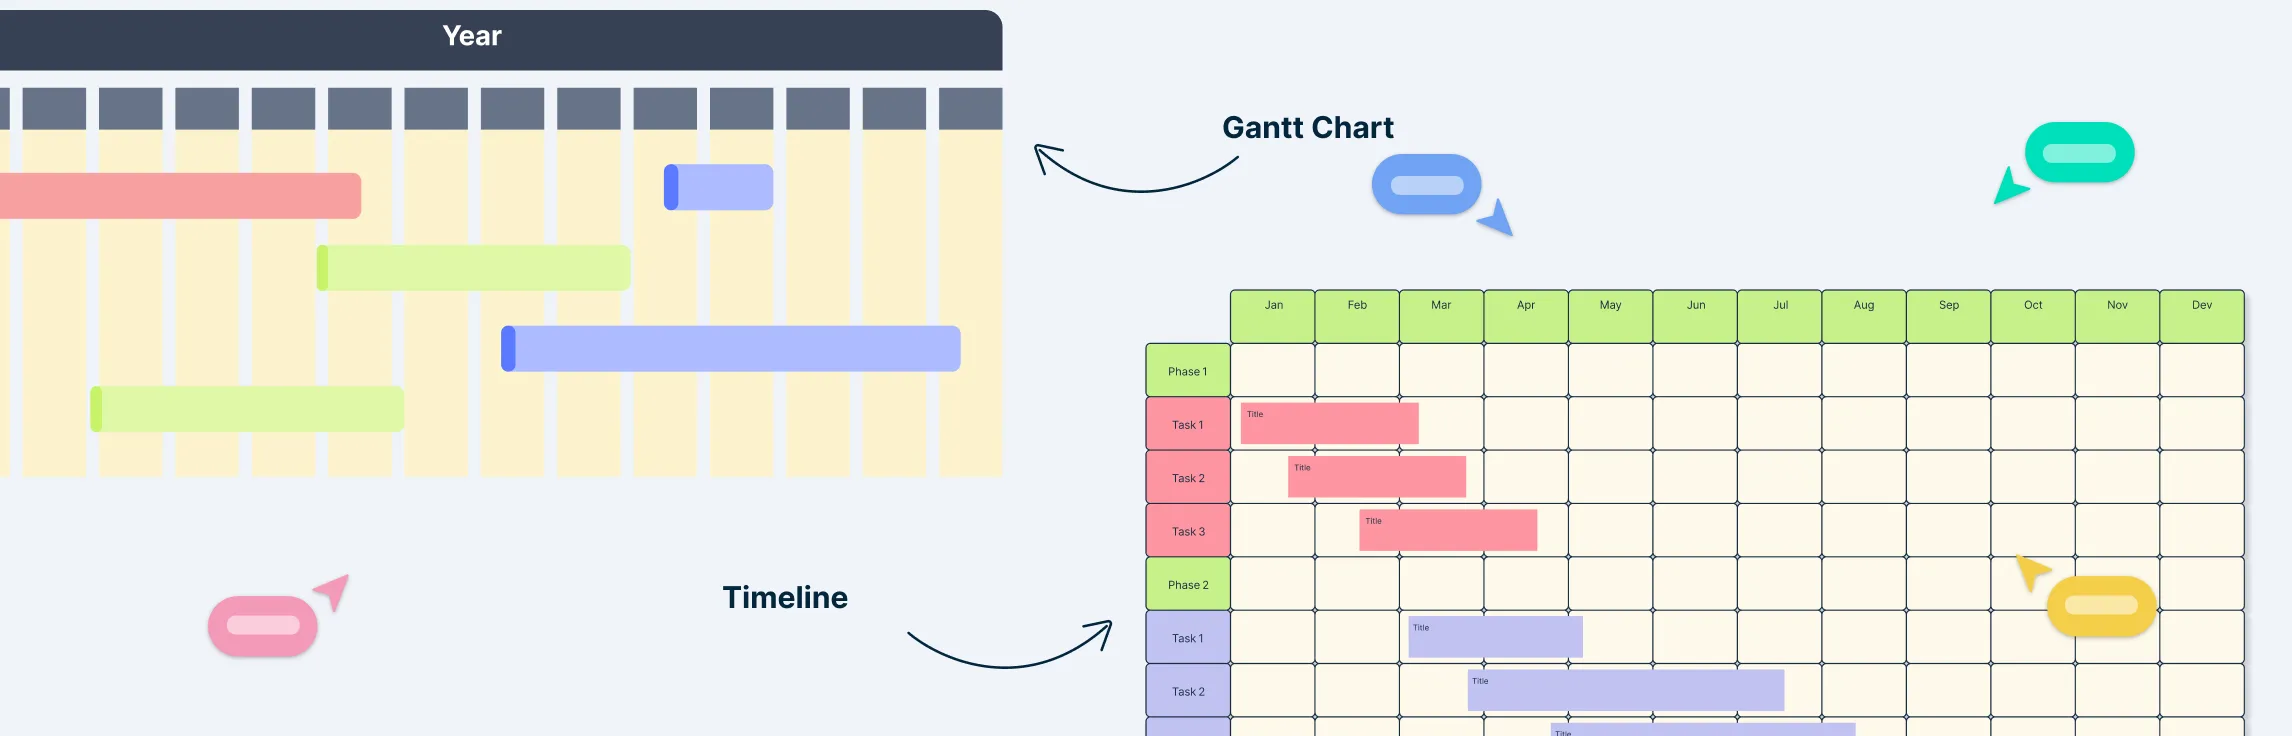
When it comes to planning projects, keeping everything on track can feel like juggling flaming torches—exciting, but a little terrifying. That’s where the right visual tools come in. Some projects need a high-level overview to show milestones at a glance, while others demand detailed tracking of tasks, deadlines, and dependencies. Picking the right approach can make the difference between smooth execution and constant fire-fighting. In this guide, we’ll break down the key differences between a Gantt chart and timeline, show when each shines, and help you choose the perfect tool to plan, track, and impress your team.
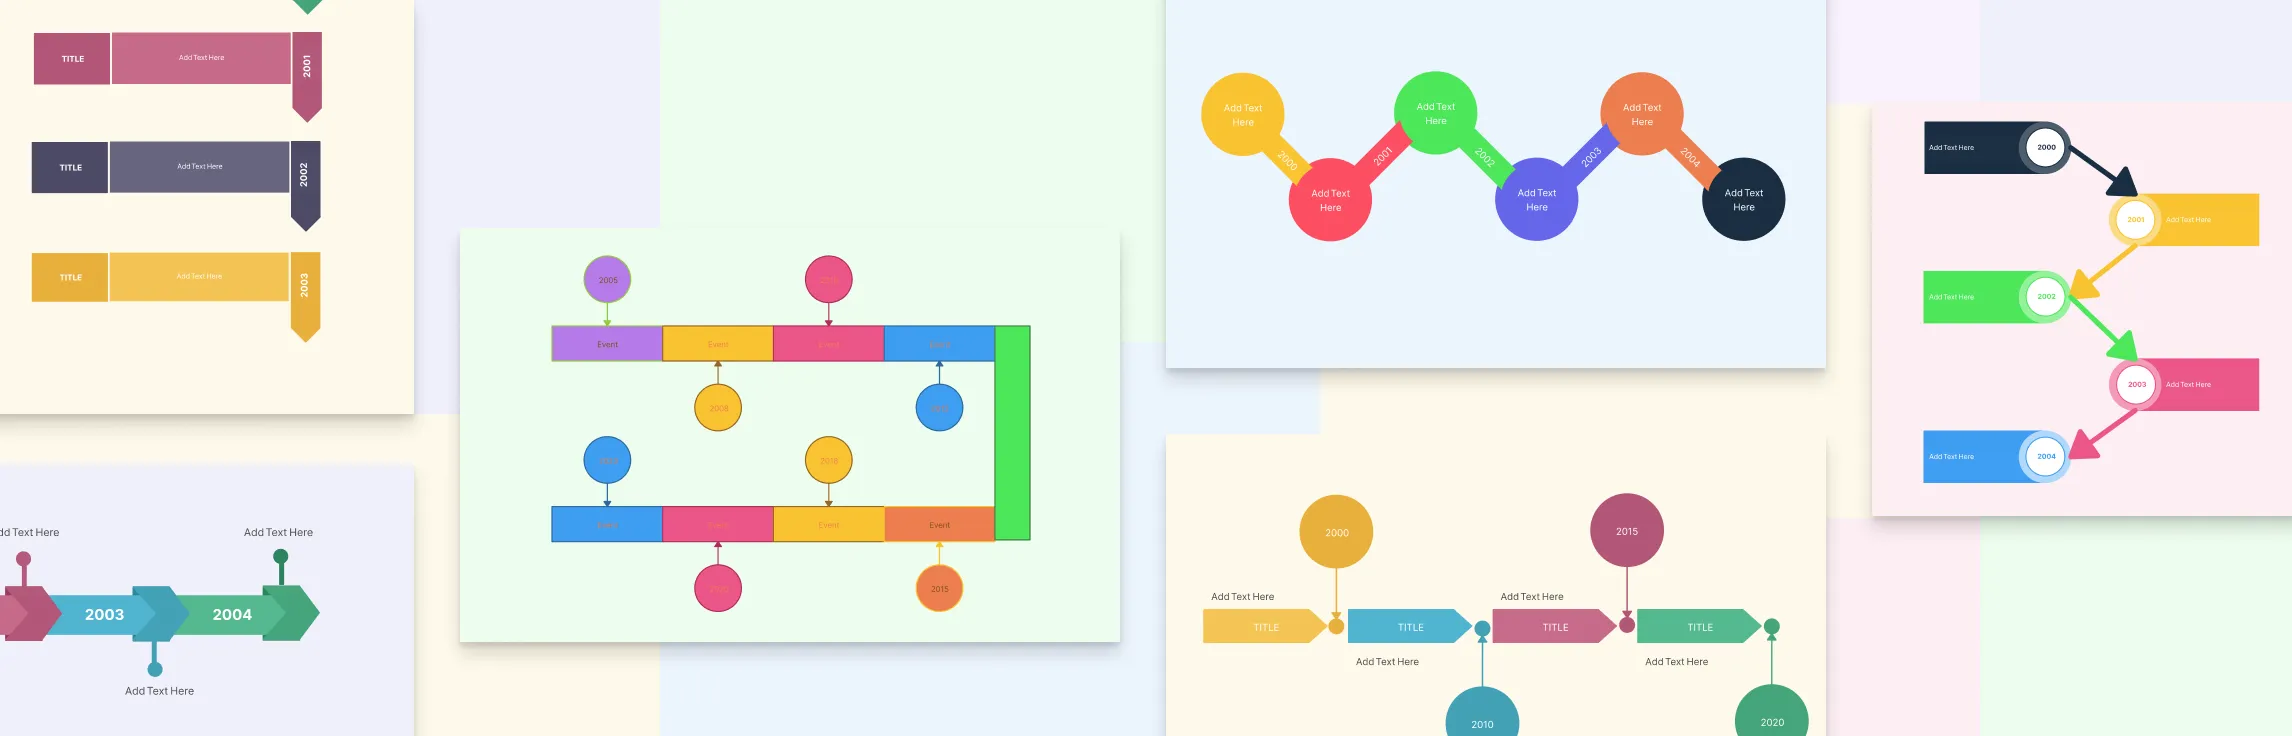
A timeline is a visual way to display events or tasks in the order they occur, helping you quickly understand how things progress over time. Whether you’re mapping historical events, planning a project, or organizing ideas, knowing the different types of timelines can make your work clearer and more effective. In this guide, we’ll explore the main types of timelines, their uses, and how you can easily create them using a visual tool like Creately.
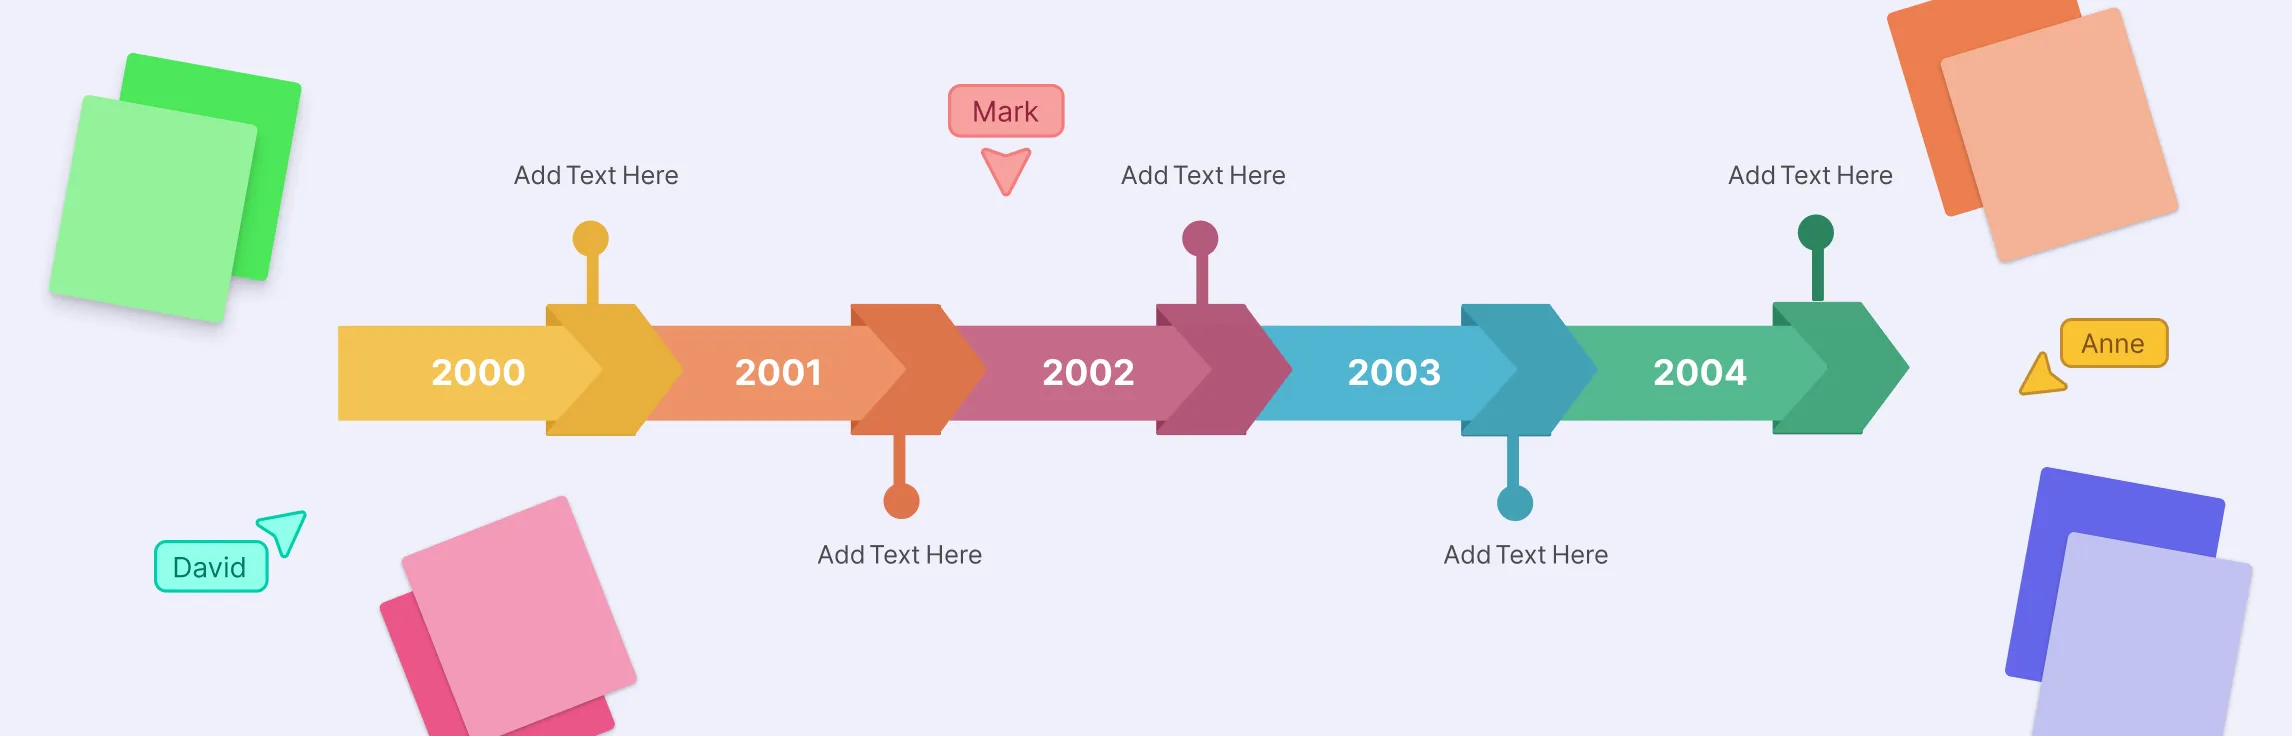
A timeline diagram is a simple but powerful way to show how events unfold over time. Whether it’s used to track project milestones, visualize historical events, or map a product’s journey, timelines make it easy to see progress and relationships at a glance. In this guide, we’ll explain the timeline meaning, its key elements, and why it’s such a useful tool for organizing information clearly.