In the dynamic landscape of modern business, optimizing processes and ensuring quality are paramount. Six Sigma, a data-driven methodology, is designed to reduce defects and improve process efficiency. Its tools are not only essential for enhancing processes but also play a transformative role in effective team management.
What Are Six Sigma Tools?
Six Sigma tools are methodologies, techniques, and strategies used to identify, analyze, and improve business processes. These tools help in reducing variation, eliminating defects, and improving quality and efficiency. The primary goal of Six Sigma is to achieve near-perfect performance (no more than 3.4 defects per million opportunities). Below are some of the most commonly used Six Sigma tools:
Six Sigma is a disciplined, data-centric approach for eliminating defects and minimizing variability in business processes. Using statistical methods and a structured framework known as DMAIC (Define, Measure, Analyze, Improve, Control), Six Sigma aims to achieve near-perfect quality, making it a staple in industries from manufacturing to service sectors.
The Benefits of Using Six Sigma Tools
The Data-Driven Advantage
The importance of Six Sigma tools lies in their ability to provide a structured approach to problem-solving. Rather than relying on guesswork or intuition, these tools enable organizations to make decisions based on concrete data and statistical analysis. This data-centric approach not only leads to more accurate problem identification but also helps in developing targeted solutions that address the real issues at hand.
Versatility Across Industries
One of the key strengths of Six Sigma tools is their versatility. They can be applied across various industries and departments, from manufacturing and healthcare to finance and customer service. This flexibility allows organizations to implement a consistent problem-solving methodology throughout their operations, fostering a culture of continuous improvement.
Proactive Quality Management
Six Sigma tools promote a proactive rather than reactive approach to quality management. By focusing on preventing defects before they occur, organizations can significantly reduce the time and resources spent on correcting issues after the fact. This preventive stance not only improves overall efficiency but also contributes to long-term cost savings and enhanced customer satisfaction.
Fostering Employee Engagement and Collaboration
The implementation of Six Sigma tools encourages employee engagement and cross-functional collaboration. As team members learn to use these tools effectively, they develop a deeper understanding of processes and their interconnections within the organization. This holistic view often leads to innovative solutions and fosters a sense of ownership among employees, driving continuous improvement from within.
A Common Language for Improvement
The systematic nature of Six Sigma tools provides a common language for process improvement across different levels of an organization. This shared understanding facilitates better communication between departments and hierarchies, aligning everyone towards common goals and objectives.
Six Sigma tools are not just a set of techniques; they represent a comprehensive approach to business excellence. By providing a data-driven, structured methodology for process improvement, these tools empower organizations to achieve higher levels of quality, efficiency, and customer satisfaction. As businesses continue to face increasing pressure to optimize their operations, the importance of Six Sigma tools in driving sustainable success cannot be overstated.
By leveraging tools like Six Sigma Tools, businesses can convert complex data into actionable insights, streamlining operations and fostering a culture of continuous improvement.
For more foundational knowledge on quality improvement techniques, explore the 7 Basic Tools of Quality Improvement
The Top 12 Visual Tools for Six Sigma (With templates)
1. Value-Stream Mapping
Value-stream mapping is a powerful Six Sigma tool designed to analyze and visualize the flow of materials and information required to deliver a product or service to a customer. This technique captures various metrics, such as time periods, error rates, and delays, providing a comprehensive snapshot of the entire process.


While traditionally used in lean manufacturing, value-stream mapping has broad applications across different industries, including healthcare, finance, and software development. By identifying bottlenecks and inefficiencies, organizations can streamline their operations and improve overall efficiency.
How To Create a Value Stream Map
Identify the Product or Service: Choose a specific product or service for analysis.
Map the Current State: Draw a detailed flowchart representing each step in the current process, capturing data on time, inventory, and delays.
Analyze the Flow: Examine the map to identify inefficiencies, such as bottlenecks or redundant steps.
Design the Future State: Create a new map that eliminates identified inefficiencies, aiming for a smooth and streamlined process.
Implement the Changes: Develop an action plan to transition from the current state to the future state, continuously monitoring for improvement.
Organizations can use templates like those found in Creately to optimize this process. With tools that support real-time data integration and collaboration, teams can effectively visualize and improve their value streams using Value Stream Mapping Templates
2. Cause and Effect Analysis
Cause-and-effect analysis, also known as a fishbone diagram or Ishikawa diagram, is a visual tool used to identify the potential causes of a specific problem. This method allows teams to systematically brainstorm and categorize the possible root causes of an issue, helping to uncover all contributing factors.

Creating a Cause and Effect Diagram
Creating a cause-and-effect diagram involves several structured steps:
Identify the problem: Clearly define the problem and write it in a box on the left-hand side of a paper or digital workspace.
Draw the main backbone: Draw a horizontal line from the box to the right, which will serve as the main spine of the fishbone diagram.
Identify major categories: Draw several lines branching off from the spine and label them with categories such as People, Methods, Materials, Equipment, Environment, and Management. Each line represents a major cause category that could contribute to the problem.
Brainstorm sub-causes: For each category, brainstorm possible sub-causes and draw lines extending from each major cause line, detailing more specific factors that may be affecting the issue.
Analyze the diagram: Once the diagram is complete, teams can analyze it to identify the most likely root causes that should be addressed as a priority.
Implementing cause-and-effect analysis offers several advantages:
Comprehensive Exploration: By systematically listing all potential causes, teams ensure no aspect is overlooked.
Visual Representation: The diagram provides a clear, visual understanding of the problem, making it easier to communicate and brainstorm solutions.
Root Cause Identification: Helps teams pinpoint root causes, leading to more effective and permanent solutions.
Facilitates Team Collaboration: Engages team members in collective problem-solving, leveraging diverse perspectives and expertise.
To facilitate the creation of a cause-and-effect diagram, using tools like the Cause and Effect Diagram for DMAIC and the Fishbone Diagram Maker from Creately can streamline the process significantly, providing templates and collaborative features for teams.
3. The 5 Whys
The 5 Whys is a straightforward problem-solving method that helps uncover the root cause of an issue by repeatedly asking ‘why.’ This technique prioritizes simplicity and can effectively tackle moderately difficult problems, making it one of the indispensable Six Sigma tools.
The 5 Whys is an iterative interrogative technique used to explore the cause-and-effect relationships underlying a particular problem. The primary goal is to determine the root cause of a defect or problem by repeating the question “Why?” typically five times. Each answer forms the basis of the next question.

Key Features of the 5 Whys
Simplicity: The technique’s straightforward nature makes it accessible to teams at all levels.
Flexibility: While “5” is in the name, the actual number of “whys” can vary based on the complexity of the issue.
Quick Implementation: It can be applied rapidly, often yielding insights in a single session.
Team Engagement: The process encourages team participation and collective problem-solving.
How to Implement the 5 Whys
1. Identify the Problem:
Clearly state the specific issue you’re trying to resolve.
Example: “Customer complaints about late deliveries have increased by 30%.”
2. Ask the First “Why?”:
Question: “Why are customer deliveries late?”
Possible Answer: “Because orders are leaving our warehouse behind schedule.”
3. Dig Deeper with Subsequent “Whys”:
Continue asking “Why?” for each answer. Here’s how it might unfold:
Why are orders leaving the warehouse late? “Because packing takes longer than estimated.”
Why does packing take longer than estimated? “Because we often run out of packing materials.”
Why do we run out of packing materials? “Because our inventory management system isn’t updated in real-time.”
Why isn’t the inventory management system updated in real-time? “Because the software integration with our suppliers’ systems is faulty.”
4. Identify the Root Cause:
The final “Why?” should point to the root cause.
In this example: The root cause is a faulty software integration affecting inventory management.
5. Develop Countermeasures:
Once the root cause is identified, develop and implement solutions to address it.
Example solution: Upgrade the inventory management system and improve integration with supplier systems.
4. The Kanban System
The Kanban system is a practical, visual tool that enables teams to optimize workflow, improve efficiency, and streamline processes. Originating from the Toyota Production System, Kanban, which means ‘billboard’ in Japanese, leverages visual signals to control the flow of work, ensuring that production aligns seamlessly with current demand.

Benefits of Kanban
Implementing a Kanban system offers multiple advantages:
Effective Inventory Control: By only ordering or producing items when there is a demand, Kanban minimizes excess inventory holding costs.
Increased Efficiency: Visual cues in the Kanban system help identify bottlenecks, allowing teams to address issues in real-time.
Improved Flexibility: The gradual and continuous workflow adjustments make processes more adaptable to changes in demand.
Enhanced Collaboration: Teams easily understand task statuses and responsibilities through visual Kanban boards.
Implementing Kanban
To successfully implement a Kanban system in your organization, follow these steps:
Map your Workflow: Identify all steps involved in your production or supply process.
Visualize Tasks: Use Kanban boards, dividing them into columns representing different stages of your workflow.
Set Limits: Define acceptable WIP (Work In Progress) limits to prevent overloading any part of the process.
Implement Visual Cues: Utilize cards or digital signals for tasks, ensuring transparency and real-time updates.
Continuously Monitor and Improve: Regularly review processes, adjust WIP limits, and apply changes to improve workflow.
An excellent tool for planning and visualizing these steps is the Capacity Planning Kanban Board. Additionally, try Online Kanban Board softwarefor comprehensive visualization and collaboration features.
5. Pareto Chart
A Pareto Chart is a powerful statistical tool based on the Pareto Principle, which posits that 20% of the causes are responsible for 80% of the effects. This tool helps identify and prioritize the most influential factors in any process, making it an essential component of the Six Sigma toolkit. It blends a vertical bar graph and a line graph to visualize individual contributions of various factors and their cumulative impact.
Using Pareto Chart for Prioritization
The primary benefit of using a Pareto Chart diagram is its ability to pinpoint the most significant issues affecting the process. By focusing on these high-impact areas, teams can implement targeted improvements that yield substantial benefits. Resources are allocated more efficiently, leading to enhanced productivity and quality.
Incorporate tools like Creately’s Prioritization Matrix Template to further refine your analysis and streamline decision-making processes.

Steps to Create a Pareto Chart
Data Collection: Collect data related to the process in question. This could involve defect types, causes of problems, or any measurable attribute.
Categorize Data: Organize the data into categories that contribute to the issues being analyzed.
Calculate Frequencies: For each category, count the number of occurrences or measure their impact.
Construct the Chart: Plot the categories on the x-axis and their frequencies on the y-axis using vertical bars. Next, draw a cumulative percentage line on the same chart.
Analyze Results: Identify the critical few categories that require immediate attention.
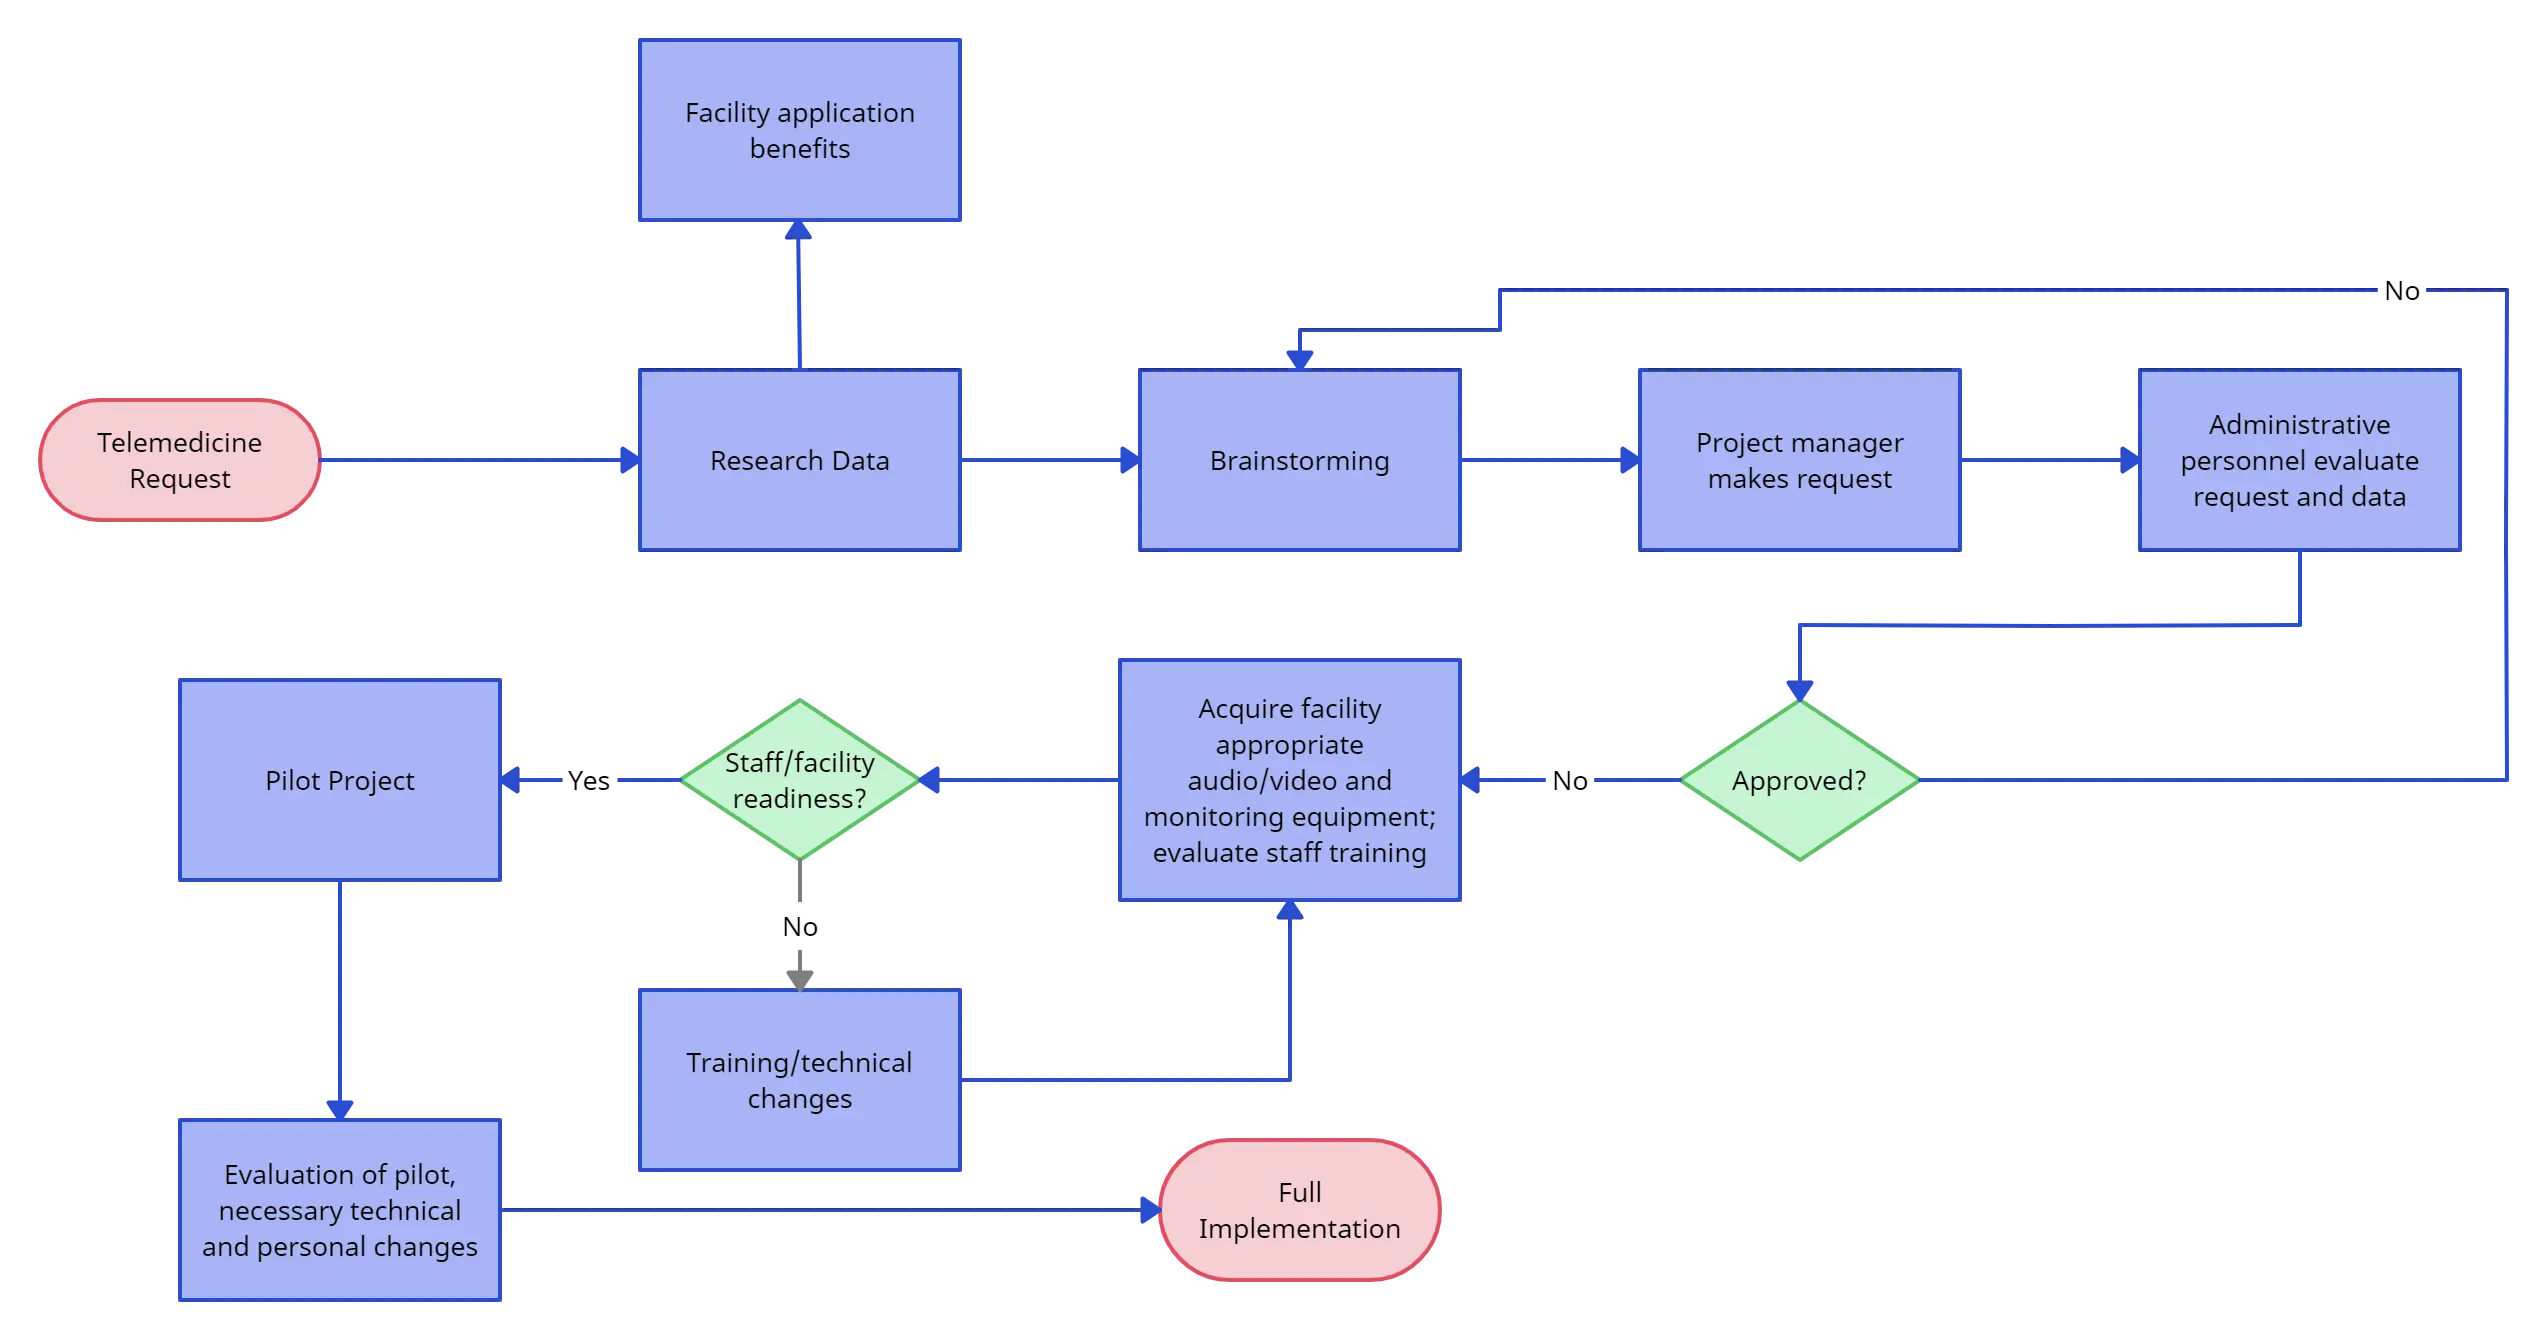
6. Process Mapping
Process mapping is a strategic tool used to visualize and understand the flow of a business process from start to finish. This essential Six Sigma tool depicts various elements such as activities, tasks, roles, inputs, and outputs, providing a clear overview of how a particular process is executed.
Types of Process Maps in Six Sigma
1. Flowchart: Flowcharts are the simplest and most widely used process maps, showing the sequence of steps in a process with standardized symbols. Ideal for straightforward processes, they provide a clear visual of the workflow, decision points, and loops. Flowcharts are easy to create and useful for initial process analysis.
2. Swimlane Diagram: Swimlane diagrams, or cross-functional flowcharts, organize activities into parallel lanes, representing departments or roles. They’re useful for visualizing cross-functional processes, defining responsibilities, and identifying handoff points and potential inefficiencies between departments.

3. Value Stream Map: Value Stream Maps offer a detailed view of the flow of materials and information, focusing on value-adding and non-value-adding activities. Often used in manufacturing and supply chains, they highlight areas of waste and opportunities for improvement, key for Lean Six Sigma projects.
4. SIPOC Diagram SIPOC (Supplier, Input, Process, Output, Customer) diagrams provide a high-level overview of a process, helping define project scope and identify key stakeholders. They ensure teams consider all critical elements, from suppliers to customers, at the start of a process improvement project.

Benefits of Process Mapping in Six Sigma
1. Clarity and Transparency
Process maps visually simplify complex workflows, ensuring everyone, from front-line workers to executives, shares a clear understanding of operations.
2. Identifying Inefficiencies
Process mapping reveals bottlenecks, redundancies, and non-value-adding activities, helping teams uncover inefficiencies and drive improvements.
3. Improved Communication
Process maps create a shared language across departments, clarifying roles and fostering better collaboration by visualizing how different parts of the organization interact.
4. Risk Mitigation
By highlighting potential failure points, process maps help mitigate risks and ensure compliance by documenting standard procedures.
5. Facilitating Continuous Improvement
Process maps provide a baseline for measuring improvements, helping teams prioritize areas for optimization and track progress over time.
6. Enhanced Training and Onboarding
Visual maps are effective tools for training new hires, offering a clear guide to processes and accelerating onboarding.
7. Customer Focus
Process mapping identifies customer touchpoints and opportunities to improve satisfaction, aligning internal processes with customer needs.
7. Project Charter
A well-defined project charter is essential for Six Sigma teams to maintain clarity and direction. This foundational document outlines the project’s scope, objectives, and stakeholders, ensuring that everyone involved has a clear understanding of the project’s goals and boundaries. With a robust project charter, teams can reduce confusion and enhance coordination, making project execution smoother and more efficient.
A project charter is a formal document that provides an overview of a project, establishing its purpose and scope from the outset. It acts as a blueprint that guides the project team, detailing important aspects such as budgets, timelines, and key deliverables. This document is crucial in preventing scope creep and ensuring that all team members are aligned with the project’s objectives.

Key Components of a Project Charter
A comprehensive project charter includes the following elements:
Project Purpose: Clearly defines why the project is being initiated.
Objectives: Outlines the goals the project aims to achieve.
Scope: Delimits what is included and excluded from the project.
Stakeholders: Identifies key individuals or groups involved in or affected by the project.
Timeline: Provides a schedule of major milestones and deadlines.
Resources: Lists the manpower, budget, and materials required for the project.
In Six Sigma projects, the project charter is instrumental in keeping teams focused on measurable outcomes. It serves as a reference point when making decisions and helps in maintaining the integrity of the project scope. By using visual tools like project charter templates, teams can collaboratively work on their charters, ensuring that all viewpoints are considered and documented effectively.
8. RACI Matrix
A RACI Matrix (Responsible, Accountable, Consulted, Informed) is a vital Six Sigma tool that delineates the roles and responsibilities within a project or process. Its primary purpose is to ensure clarity and accountability, thus preventing overlaps and gaps in task assignments. This tool is instrumental for effective team management and enhancing operational efficiency.

How to Create a RACI Matrix
To create a RACI Matrix, follow these steps:
List all tasks: Identify and list all the tasks that need to be completed in the business process.
Identify roles: Determine who is involved in each task and outline their specific roles.
Assign RACI: For each task, assign one of the four roles (Responsible, Accountable, Consulted, Informed) to each person involved. Typically, there’s one Accountable person per task, while others may be Responsible, Consulted, or Informed.
Review and communicate: Review the matrix with your team to ensure everyone understands their roles. Make necessary adjustments and ensure the matrix is accessible to all stakeholders.
Use this RACI Matrix Template for an effective visualization of your roles and responsibilities.
How The RACI Matrix Helps in Six Sigma
Enhanced Clarity: Ensures everyone involved knows their specific duties and responsibilities, eliminating confusion.
Improved Communication: Facilitates clear and systematic communication within the team, as everyone understands their role in the project’s success.
Identifies Gaps: Helps identify gaps and role overlaps, enabling swift resolution and efficient task execution.
Failure Modes and Effects Analysis (FMEA) is a systematic approach for identifying potential failures within a process, product, or system. Its primary goal is to anticipate problems before they occur, allowing for proactive measures to mitigate risks and avoid costly disruptions. This methodology is widely used in various industries, including manufacturing, healthcare, and aerospace, to enhance reliability and safety.
9. FMEA Molde
FMEA involves analyzing different failure modes, which are ways in which a process or system could fail. Each failure mode is examined to determine its potential effects and the causes behind it. The purpose is to prioritize these failures based on their severity, occurrence, and detectability. This prioritization helps teams focus on the most critical issues that could impact the quality and performance of a product or service.

Steps to Perform FMEA
Identify potential failure modes: Brainstorm all possible ways the process or product could fail.
Analyze causes and effects: Determine the reasons for each failure and its impact on the system.
Assign Risk Priority Numbers (RPN): Rate each failure based on severity, occurrence, and detection to prioritize actions.
Develop and implement mitigation plans: Create strategies to address the high-priority failures.
Review and update: Continuously monitor and revise the FMEA process as new information arises.
Advantages of FMEA
Using FMEA brings several advantages. It helps in risk management by providing a structured approach to identify and mitigate potential failures. This leads to improved product quality, enhanced customer satisfaction, and reduced costs associated with rework and defects. Furthermore, FMEA fosters a proactive mindset within teams, encouraging continuous improvement and innovation.
For more information and templates to efficiently conduct FMEAs, check out the failure mode and effects analysis template and the FMEA Analysis Template on Creately.
10. Regression Analysis
Regression analysis is a statistical process used to examine the relationship between a dependent variable and one or more independent variables. It’s an essential tool in Six Sigma for predictive analysis and understanding data dynamics. Using regression analysis, teams can forecast outcomes, identify trends, and reveal influential factors impacting a process.
Types of Regression Analysis Used in Six Sigma
Simple Linear Regression: This type analyzes the relationship between a single independent variable and a dependent variable. It’s often used for straightforward predictive analysis.
Multiple Regression: When multiple independent variables affect a dependent variable, multiple regression is employed. This is useful for complex processes where numerous factors are at play.
Logistic Regression: Ideal for binary outcomes, logistic regression helps in scenarios where the outcome is categorical, such as pass/fail or yes/no.
Conducting Regression Analysis
Conducting regression analysis involves several critical steps:
Identify Variables: Determine your dependent and independent variables. The choice of variables is crucial for accurate predictions.
Collect Data: Gather data from processes under evaluation. Ensure the data is clean and relevant to the variables identified.

Choose the Regression Model: Select the appropriate type of regression analysis based on the complexity and nature of the data.
Analyze Results: Use statistical software to run the regression analysis. Interpret the results to understand relationships and predict outcomes.
Implement Findings: Apply the insights gained from the analysis to improve processes, reduce variability, and optimize outcomes.
Tools like Creately can facilitate these steps by providing robust data visualization and collaboration features, making it easier to conduct detailed regression analysis. For more ideas to improve your processes, check out our comprehensive guide.
11. 5S System
The 5S System is a workplace organization methodology designed to create a clean, efficient, and well-organized environment. The acronym stands for Sort, Set in order, Shine, Standardize, and Sustain.

Sort: Identify and eliminate unnecessary items from the workspace.
Set in Order: Arrange essential items in a logical order for efficiency.
Shine: Clean and inspect the workplace regularly to maintain standards.
Standardize: Implement consistent procedures and guidelines.
Sustain: Ensure ongoing adherence to 5S principles and continuous improvement.
How the 5s System is Used in 6 Sigma
Increased Productivity: The 5S system significantly boosts productivity by creating a well-organized workspace where tools and materials are easily accessible. By removing unnecessary items and arranging resources logically, employees spend less time searching for what they need and more time on value-added tasks. This streamlined workflow leads to faster, more efficient processes.
Improved Safety and Quality: A clean, clutter-free environment reduces the risk of accidents and injuries, ensuring a safer workspace for employees. With safety risks minimized, workers can focus on maintaining high standards of quality. Additionally, the standardized procedures in 5S help reduce errors, improving overall product or service quality.
Reduced Costs: By optimizing space, resources, and inventory management, the 5S system leads to cost reductions. Eliminating waste, whether in the form of excess inventory, inefficient processes, or poorly maintained equipment, helps organizations cut down on expenses. This efficiency directly impacts profitability.
Enhanced Employee Morale: A well-organized workplace creates a more pleasant environment, improving employee morale. When employees take pride in their clean, functional workspaces, they are more motivated and engaged. This increased job satisfaction leads to better performance and collaboration within the team.
Positive Customer Perception: An organized and well-maintained facility makes a strong impression on visitors and customers. The professionalism of a 5S environment enhances an organization’s image, fostering greater trust and confidence among clients. This positive perception can lead to stronger customer relationships and business growth.
Broad Industry Implementation: Industries such as manufacturing, healthcare, retail, and education have successfully adopted the 5S system to enhance operational efficiency. These industries use 5S as a foundation for further improvements, often incorporating it into broader Lean and Six Sigma initiatives to drive continuous improvement and long-term success.
The 5S System offers numerous benefits, including enhanced productivity, improved safety, and reduced waste. By maintaining a well-organized workspace, teams can minimize downtime and enhance overall efficiency.
Explore more about the 5S System Model and how to apply its principles effectively.
12. Kaizen
Kaizen, a Japanese term meaning “change for better” or “continuous improvement,” is a core philosophy in Lean and Six Sigma methodologies, originally derived from the Toyota Production System. Unlike drastic or large-scale changes, Kaizen focuses on small, incremental improvements that, over time, significantly enhance efficiency, quality, and productivity. One of the defining features of Kaizen is its emphasis on involving all employees—regardless of their level or role—in the improvement process. This inclusive approach not only fosters a culture of collaboration but also helps identify inefficiencies that may otherwise go unnoticed. When implemented effectively, Kaizen leads to sustainable improvements in both processes and work environments.

Steps to Implement Kaizen
1. Identify Improvement Areas
The first step in Kaizen is identifying areas that need enhancement. This could involve anything from process bottlenecks, equipment inefficiencies, to workplace organization. Gathering feedback from employees, who are most familiar with day-to-day operations, is crucial for uncovering these opportunities for improvement.
2. Form a Kaizen Team
Once the areas for improvement are identified, it’s important to assemble a Kaizen team. This team should include individuals with relevant knowledge and expertise related to the process or problem at hand. Cross-functional collaboration often leads to more creative solutions and ensures that different perspectives are considered.
3. Plan and Implement Changes
After the Kaizen team has identified potential solutions, the next step is to develop actionable plans for improvement. These plans should outline the steps needed to address the problem, the resources required, and a clear timeline for implementation. Once the plan is in place, the team moves forward with executing the changes.
4. Measure Results
After implementing the changes, it is essential to measure the results. This involves assessing the impact of the improvements on the process or workflow, comparing performance metrics before and after implementation. Key performance indicators (KPIs) such as time savings, cost reductions, or improved quality can help gauge the effectiveness of the changes.
5. Standardize Improvements
If the changes lead to positive results, the next step is to standardize the new process. This includes documenting the improved methods and creating standard operating procedures (SOPs) to ensure that the improvements are consistently followed. Standardization prevents backsliding and ensures that the gains achieved through Kaizen are maintained in the long term.
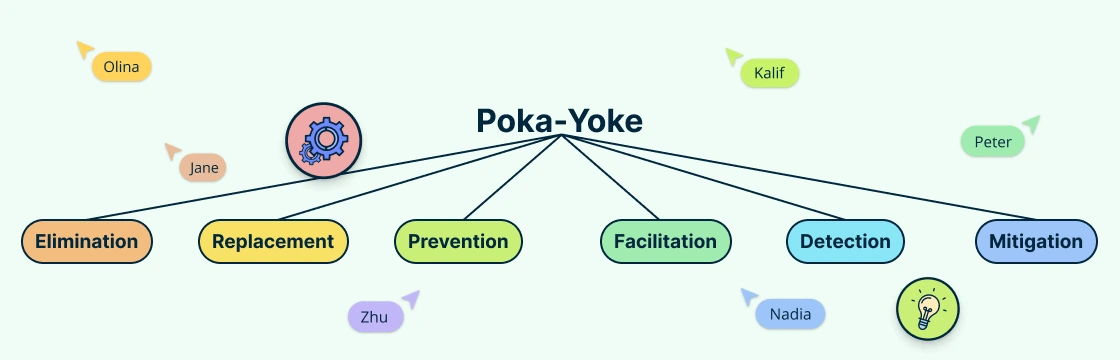
13. Poka-Yoke
Poka-Yoke, a term originating from Japanese manufacturing, translates to “mistake-proofing.” This technique aims to prevent errors by designing processes in such a way that mistakes are either impossible or immediately detectable, minimizing the risk of defects. It’s a critical component in Six Sigma tools, ensuring high-quality outcomes through error prevention.

Types and Examples of Poka-Yoke Systems
Control Poka-Yoke: These systems control the process to prevent mistakes from occurring. For example, a safety lock on a machine that won’t start unless all safety guards are in place.
Warning Poka-Yoke: These provide alerts when a potential error is about to occur. For instance, an alarm that sounds when a driver’s seatbelt isn’t fastened.
Physical Poka-Yoke: These changes are built directly into the design. An example is a three-pronged plug that can only be inserted one way.
Enhancing Six Sigma with Creately
Creately’s visual workspace enhances the implementation of Six Sigma methodologies by providing powerful tools for superior visualization, collaboration, and real-time feedback. Its platform allows teams to work together seamlessly, making complex processes more accessible and streamlined.
Real-Time Collaboration
Creately enables teams to collaborate in real time on key Six Sigma tools like Cause-and-Effect diagrams, Value Stream Maps, and RACI Matrices. Team members can contribute and provide feedback instantly, improving engagement and ensuring that no insights are missed during process improvement discussions.
Enhanced Visualization
Six Sigma projects often involve complex data and processes, and Creately’s interactive visuals and templates make it easier to digest this information. By visually mapping out processes, inefficiencies and bottlenecks can be quickly identified and addressed, helping teams make data-driven decisions faster.
Comprehensive Data Integration
With Creately, users can import and link data from various sources into their visual models. These models update automatically as new data comes in, allowing teams to maintain an accurate, up-to-date view of their processes. This feature is particularly useful for tracking key performance indicators (KPIs) during Six Sigma projects, ensuring that decision-making is based on the most current data.
Features of Creately for Six Sigma Projects
Customizable Frameworks: Creately offers a range of customizable templates for market analysis, process improvement, and troubleshooting, aligning perfectly with Six Sigma’s structured problem-solving approach.
Change Management: Visual tools help teams explain and communicate complex process changes effectively. This transparency is crucial for tracking progress and ensuring that changes are implemented smoothly.
Agile Project Management: Creately supports tools like Kanban boards, enabling teams to manage workflows more efficiently and track Six Sigma project milestones with ease.
By leveraging Creately’s visual platform, teams can enhance the effectiveness of Six Sigma projects, from identifying problems to implementing and standardizing solutions.