Project plans can fall apart fast when task dependencies aren’t clear. That’s where project network diagrams come in. They help you visualize how work flows, spot bottlenecks early, and keep timelines realistic as projects grow in complexity.
In this guide, you’ll learn how to use network diagrams in project management to plan, analyze, and optimize project schedules with confidence. We’ll walk through the different approaches, practical steps, and best practices so you can turn complex project timelines into clear, actionable plans your team can actually follow.
What Is a Network Diagram in Project Management
In project management, network diagrams help teams make sense of complex schedules. Instead of looking at tasks as isolated items, they show how work is connected, what depends on what, and how delays can ripple through a project. This makes them especially useful when managing tight timelines, multiple dependencies, or high-risk projects.
A project network diagram visually maps out project activities and the logical relationships between them. It focuses on sequence and dependency, helping project managers understand how work flows from start to finish and where timing really matters.
What is a project schedule network diagram in project management?
A project schedule network diagram takes a project network diagram one step further by incorporating time-based information. It includes task durations, start and finish dates, float/slack, and often identifies the critical path. This type of diagram is specifically used to plan, manage, and optimize the project schedule, providing a timeline-oriented view that links task dependencies with project deadlines.
How network diagrams fit into the project planning lifecycle
Network diagrams are typically used after project tasks have been identified and before the final schedule is locked in.
They help project managers:
Sequence activities logically
Analyze dependencies and constraints
Identify scheduling risks early
Validate timelines before moving to gantt charts or execution
Because of this, network diagrams play a key role during schedule development, timeline validation, and risk planning.
Key components of a project management network diagram
Every network diagram is built using a few core elements:
Activities (nodes): Individual tasks that make up the project. Each activity represents work that needs to be completed.
Dependencies: The logical relationships between activities. These show which tasks must start or finish before others can move forward.
Float or slack: The amount of time an activity can be delayed without affecting the overall project deadline. Tasks on the critical path have no float.
Milestones: Important checkpoints that mark major progress points in the project, such as phase completion or key deliverables.
Uses of Project Management Network Diagrams
Visualize the flow of work, showing how tasks connect and how the project progresses from start to finish.
Identify dependencies and constraints to spot bottlenecks and plan around potential issues early.
Determine the critical path to understand which tasks directly impact the project finish date.
Calculate float or slack to know which tasks have scheduling flexibility and which have none.
Improve risk analysis by highlighting where delays, resource shortages, or sequence changes may affect the schedule.
Support schedule optimization by testing task sequences, durations, and resource allocations visually.
Enhance communication and alignment by providing a shared visual language for teams and stakeholders.
Link planning with execution by feeding the network diagram structure into gantt charts, resource plans, and progress trackers.
Types of Network Diagrams in Project Management
In project management, there isn’t just one way to draw a network diagram — different approaches help you visualize task sequences and dependencies in ways that make sense for your project’s size and complexity. Here are the key types you’ll see in practice:
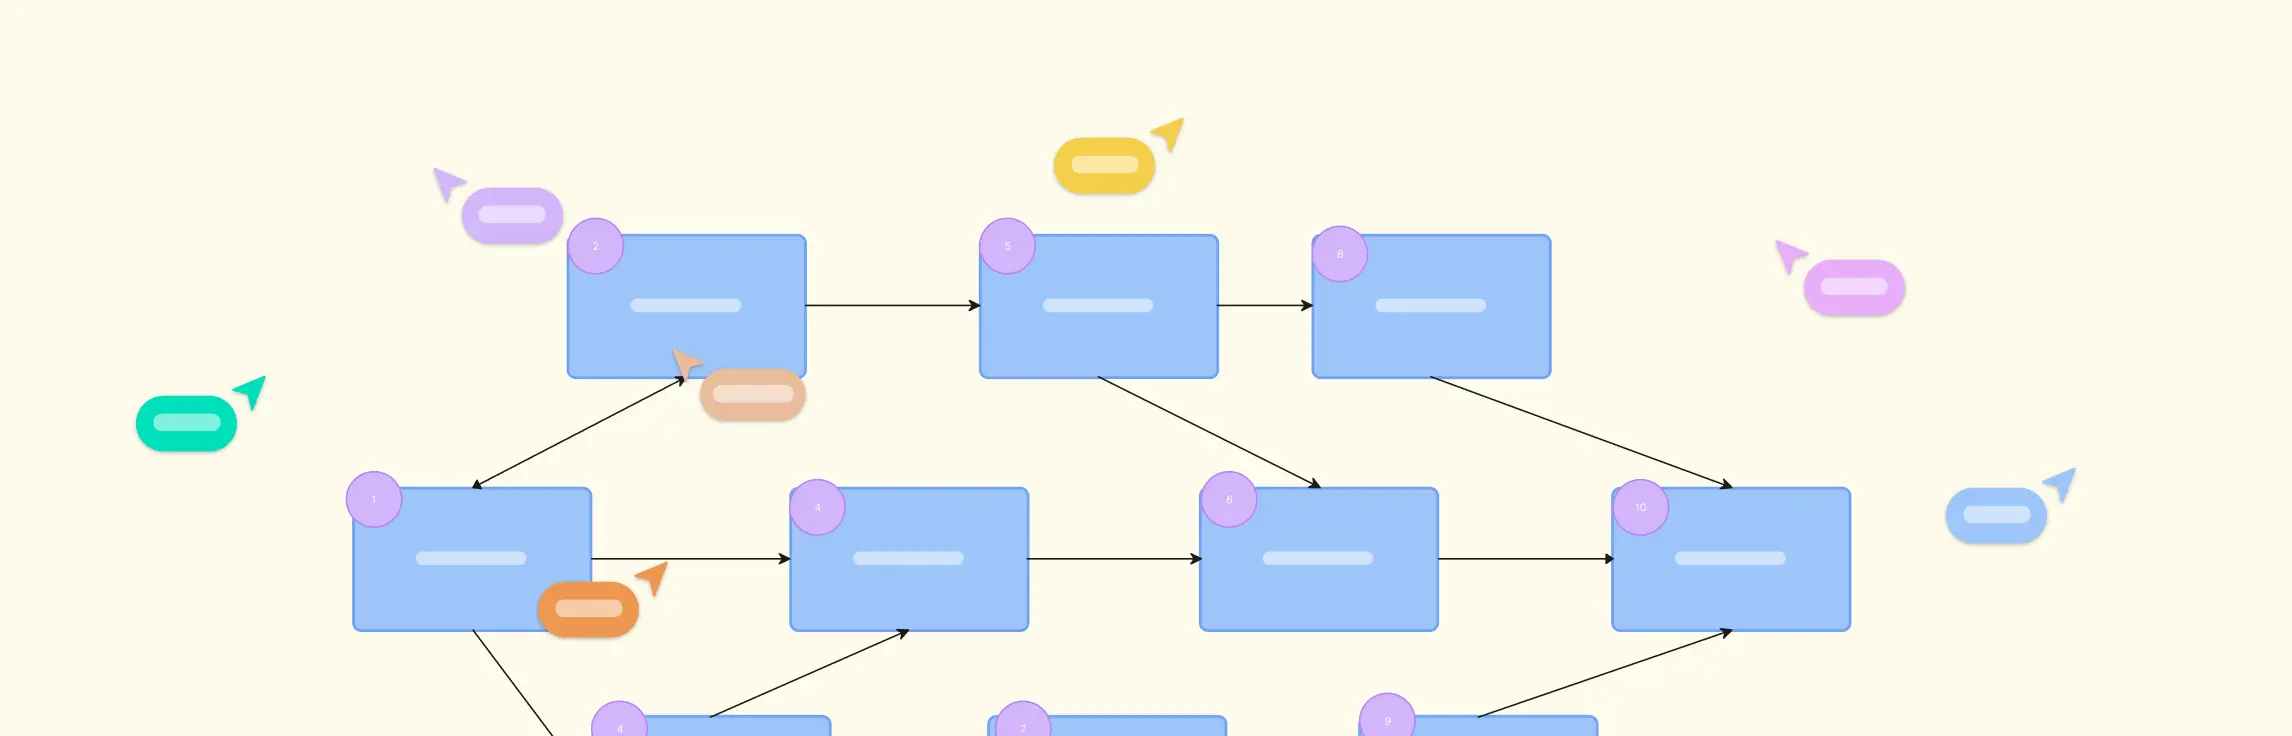
Type 1: Precedence diagram method (PDM)
Activities are shown as boxes (nodes) connected by arrows representing dependencies. The precedence diagram supports finish-to-start, start-to-start, finish-to-finish, and start-to-finish relationships, making it flexible for complex task flows.


Type 2: Arrow diagram method (ADM)
Activities are drawn on arrows, with nodes as connection points for dependencies. The arrow diagramming method focuses on task logic and is useful for simpler projects or when arrow-based visualization is preferred.
Type 3: Critical path method (CPM)
Builds on network diagrams to identify the longest sequence of dependent tasks, called the critical path. This shows which tasks cannot slip without delaying the project, helping with schedule optimization and risk management.

Type 4: Program evaluation and review technique (PERT)
Similar to PDM but incorporates uncertainty in task durations using optimistic, most likely, and pessimistic estimates. PERT is ideal for projects with high uncertainty or complex new tasks.

Type 5: Dependency structure matrix (DSM)
Represents task relationships in a compact matrix format. DSM helps identify tightly coupled tasks and cycles, useful in complex engineering or product development projects with many interdependencies.
Type 6: Gantt chart (alternative)
Uses horizontal bars on a timeline to represent task durations and overlaps. Gantt charts provide a clear, visual overview of the schedule and show how tasks are sequenced over time, making it easy to track progress and understand timelines.

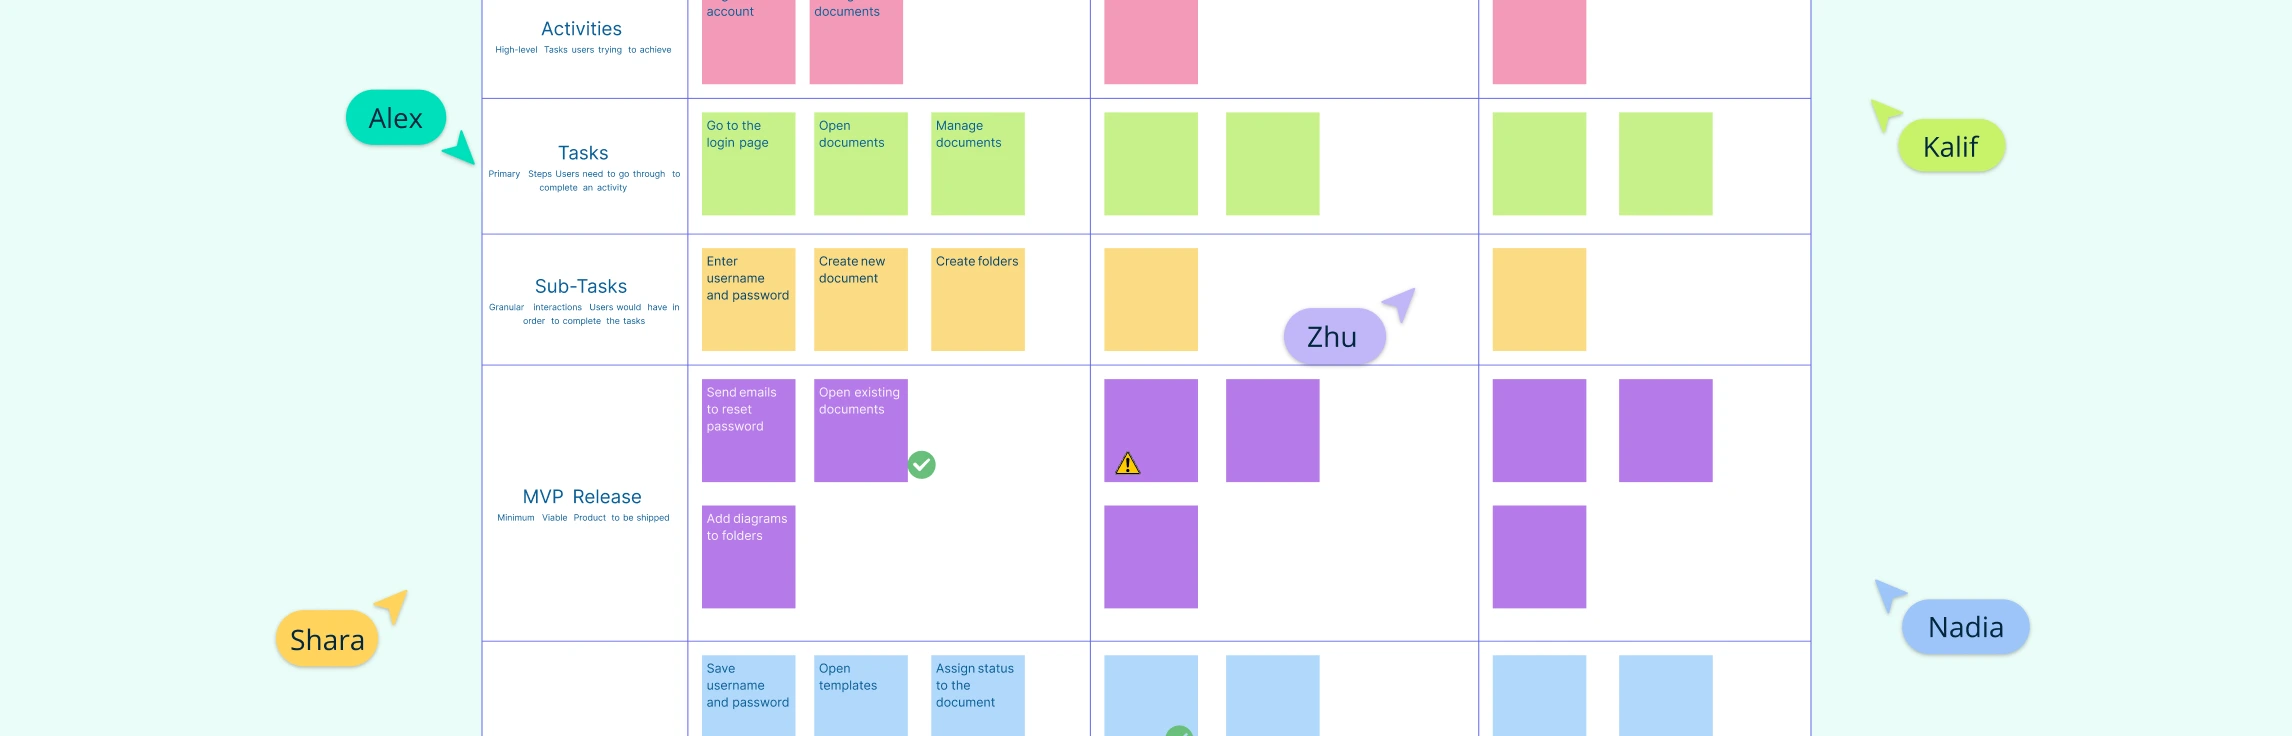
How to Create a Project Network Diagram
Step 1: Identify and list all activities
Start by listing every task the project will include. Break work down into manageable pieces so nothing is overlooked. This is like gathering all the building blocks before you start assembling the model — the more complete your list, the more reliable your schedule will be.
Step 2: Define dependencies and sequence
Once you have your task list, figure out how the work flows. Which tasks must happen before others? Which can run at the same time? Write down these relationships so you know the proper sequence. This step turns a flat list of work into a meaningful structure of connected activities.
Step 3: Assign durations and resources
Now it’s time to add how long each activity will take. Estimate durations based on experience, historical data, or team input. Also think about who will do the work and what resources (people, equipment, approvals) each task needs. These details help make your network diagram realistic rather than theoretical.
Step 4: Select your diagram methodology
Not all network diagrams are created equal. Choose the method that fits your needs:
Precedence diagram method (PDM) – the most common approach, showing activities as boxes connected by arrows.
Arrow diagram method (ADM) – shows activities on arrows with nodes representing connection points.
Critical path method (CPM) – focuses on finding the longest sequence of dependent tasks to determine the shortest possible project duration.
PERT – incorporates uncertainty by estimating optimistic, pessimistic, and most likely durations.
Pick the right method for your project’s complexity and what your team is comfortable with.
Step 5: Construct the diagram and annotate
Now build the diagram. Represent each activity and connect them with lines or arrows based on the relationships you defined. As you lay it out, add annotations like:
Lead and lag – show if a successor activity can start early (lead) or must wait a bit (lag).
Slack/float – highlight where you have flexibility in the schedule.
Critical path – visually distinguish the sequence of tasks that directly impacts your project finish date.
A well-annotated diagram makes it easy to see where risk and opportunity live in your schedule.
Step 6: Validate with stakeholders
Once your draft diagram is ready, review it with your team and key stakeholders. Ask questions like: Are these dependencies correct? Do the durations make sense? Their input helps catch blind spots early and builds shared understanding.
Step 7: Use tools and visual best practices
Using the right tool makes creating network diagrams faster, easier, and more accurate. Creately is built for this, offering features that streamline every step of diagram creation in project management.
Tools and templates
Start with a Creately network diagram template to avoid starting from scratch. Templates come pre-structured for project schedules, so you can focus on tasks and dependencies, not layout.
Drag-and-drop shapes and connectors make it easy to adjust activity positions, update dependencies, or tweak timelines in seconds.
Access a library of project management shapes and icons, including nodes, milestones, and arrows, so your diagrams are always professional and standardized.
Visual best practices with Creately
Keep diagrams clear and readable using automatic alignment and smart snapping, which minimizes crossing lines and clutter.
Use consistent shapes and colors to represent tasks, milestones, and critical paths, helping your team quickly interpret the diagram.
Label dependencies and durations directly on the diagram so the logic is obvious at a glance.
Highlight critical paths and slack using color-coding or bold lines, making risks and flexibility immediately visible.
Collaborate in real-time: share and edit diagrams with stakeholders so everyone stays aligned without version conflicts.
With Creately, creating a network diagram isn’t just faster—it’s more accurate, visually appealing, and team-friendly, making it a perfect tool for managing complex project schedules.
Benefits and Challenges of Network Diagrams in Project Management
Network diagrams in projects are powerful tools, but like any method, they come with advantages and limitations. The table below summarizes the key benefits and challenges to help project managers understand their value and potential pitfalls.
| Benefits of Project Network Diagrams | Challenges of Project Network Diagrams |
| Visualize the sequence of tasks and dependencies clearly | Can become complex and hard to read for very large projects |
| Identify the critical path and tasks that directly impact project completion | Requires accurate and complete task data to be effective |
| Calculate float/slack to understand scheduling flexibility | Updating diagrams manually can be time-consuming without the right tools |
| Improve risk analysis by showing how delays affect the schedule | May require training or experience to interpret correctly |
| Enhance communication and alignment among stakeholders | Can be overwhelming for teams unfamiliar with network diagram conventions |
| Support schedule optimization by allowing scenario testing | Overly detailed diagrams can distract from the overall project plan |
| Facilitate integration with gantt charts, resource plans, and progress tracking | Complexity increases exponentially as project size and interdependencies grow |
Resources:
Project Management Academy (n.d.) ‘How to Create a Project Schedule Network Diagram’. Available at: https://projectmanagementacademy.net/resources/blog/project-schedule-network-diagram/?utm_source=chatgpt.com
ProjectManager (2023) ‘How to Make a Project Network Diagram: Free Tools & Examples’. Available at: https://www.projectmanager.com/blog/network-diagrams-free-tools?utm_source=chatgpt.com
FAQs on Network Diagram for Project Schedules
What are the best practices for project network diagrams?
Why are network diagrams important in project management?
How do network diagrams help with resource management?
Can network diagrams be used for risk management?
How do network diagrams compare to Gantt charts?