Understanding the intricate web of evolutionary relationships among various species can be challenging. A phylogenetic tree serves as a crucial tool in this pursuit, offering a visual representation of evolutionary descent from common ancestors. These diagrams are a fundamental element in the study of biology and evolution, providing a structured way to organize and interpret biological diversity and lineage.
What is a Phylogenetic Tree?
A phylogenetic tree is a diagram that depicts the evolutionary descent of species, organisms, or genes from a common ancestor. Imagine a branching tree: the root signifies the most recent common ancestor, while the branches represent the divergence of various species over time. The tips of the branches indicate the current or final stage of evolutionary lineages.
The primary purpose of a phylogenetic tree is to visualize the evolutionary pathways and relationships among different species. By tracing these paths, researchers can unravel the history of life on Earth. Here are a few key use cases for phylogenetic trees.
Organize Biological Diversity: Phylogenetic trees help arrange species into a hierarchical structure, making it easier to classify and study the vast array of life forms.
Understand Evolutionary Events: They provide insights into significant evolutionary events, such as speciation, adaptive radiation, and convergent evolution.
Hypothesize Relationships: Since phylogenetic trees are based on available data, they serve as hypotheses about the evolutionary relationships among organisms, which can be tested and refined with further research.


The Importance of Phylogenetic Trees
Evolutionary Insights
Phylogenetic trees play an important role in evolutionary biology, offering profound insights into the evolutionary processes that shape our world. By illustrating hypothesized evolutionary relationships, these diagrams help researchers trace patterns of shared ancestry and understand the historical development of various species. Phylogenies shed light on how species have diverged from common ancestors, allowing scientists to reconstruct evolutionary events and study traits that have evolved over time.
Taxonomic Classification
In taxonomy, phylogenetic trees help structure classifications that reflect evolutionary relationships, aiding in the identification and categorization of species based on their lineage. This phylogeny-based classification system is far more informative and accurate than traditional methods, as it considers genetic data and evolutionary histories. The trees make it easier to discern which species are more closely related, providing a clear framework for taxonomic naming practices.
Understanding Evolutionary Relationships: Phylogenetic trees offer a visual representation of evolutionary pathways, helping demystify complex evolutionary relationships among species.
Tracing Common Ancestry: The branching patterns of trees depict common ancestors, showing how different species have diverged and evolved.
Hypothesis Testing: Trees serve as hypotheses that can be tested and refined as new data emerge, making them dynamic tools in evolutionary studies.
Creately enhances the study of phylogenetic trees by providing robust visual collaboration tools, perfect for educators, researchers, and students. With data-integrated diagramming and visualization support, users can model and document evolutionary relationships comprehensively. The platform’s features facilitate efficient project execution and collaboration, ensuring that visual representations of complex biological data are both insightful and practical.
What Does a Phylogenetic Tree Represent?
Branching Patterns
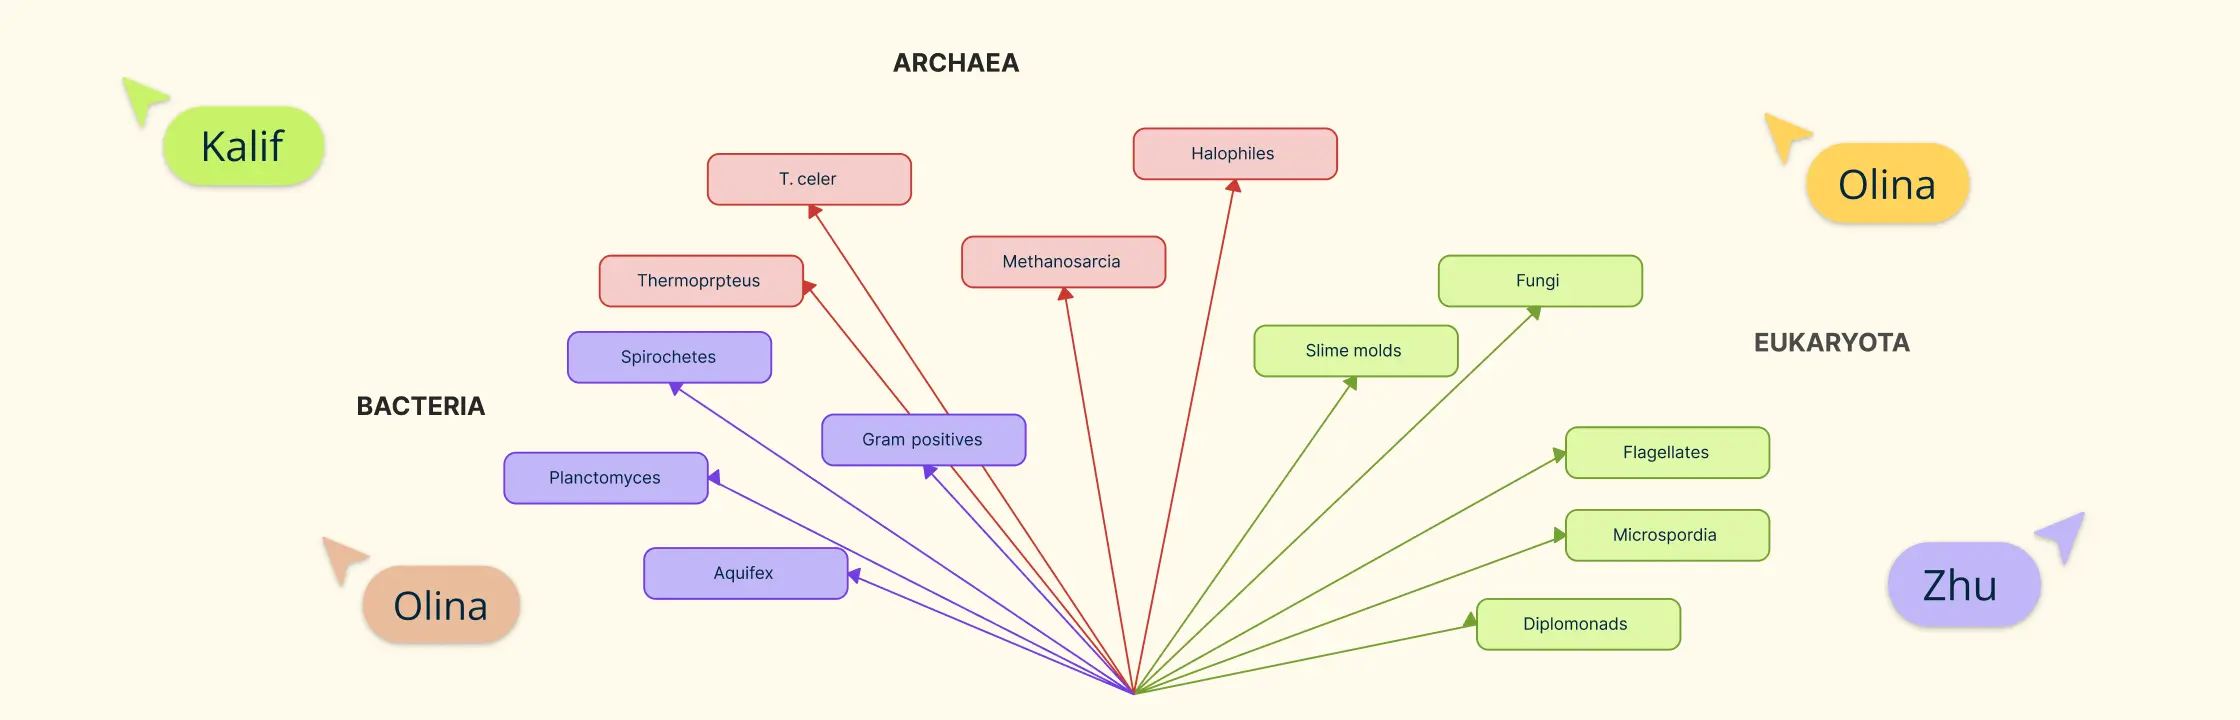
Phylogenetic trees, also known as evolutionary trees, graphically represent the evolutionary descent of species. The branching patterns indicate how different groups of organisms are related through common ancestry. Each branch point, or node, signifies a common ancestor from which various lineages diverge.
The shape and structure of the tree, known as its topology, are crucial for understanding evolutionary relationships. In these trees, closer branch points represent a more recent common ancestor, indicating a closer evolutionary relationship. Studying these patterns can reveal significant evolutionary events, such as speciation or diversification.
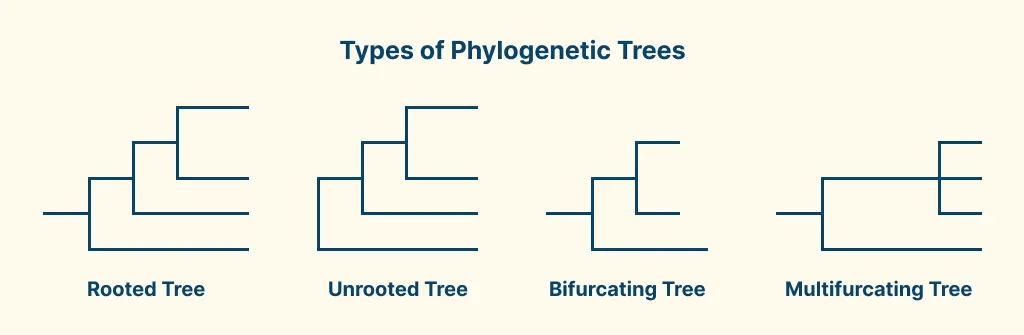
Rooted Vs. Unrooted Trees
Phylogenetic trees can be classified into rooted and unrooted trees. Rooted trees have a single common ancestor or root at the base, from which all organisms in the tree descend. This root helps in determining the direction of evolution, with branches extending outwards to represent various evolutionary paths.
| Rooted Phylogenetic Tree | Unrooted Phylogenetic Tree |
| Depicts a common ancestor at the base | Lacks a designated root |
| Shows the direction/time of evolution | Illustrates relationships without indicating evolutionary direction |
| Used for understanding lineage evolution | Focuses on exploring relationships without time constraints |
Unrooted trees, on the other hand, do not specify a common ancestor. They focus on the relationships between organisms but do not indicate the path of evolutionary descent. Unrooted trees can be particularly useful when the focus is purely on the connections among different species without implying chronological order.
Anatomy of a Phylogenetic Tree
Key Components
The primary components of a phylogenetic tree include:
Nodes: These represent common ancestors where lineages diverge.
Branches: Lines that connect nodes and tips, representing evolutionary pathways.
Tips: The endpoints of branches, representing existing species or groups.
Root: The single common ancestor of all species in the tree.
Branch Lengths and Polytomies
Branch lengths in a phylogenetic tree can be significant or irrelevant based on the tree type. For instance, phylograms show branch lengths proportional to evolutionary change, whereas cladograms do not. Polytomies, represented as nodes from which three or more branches emerge, indicate areas where the exact branching order is unclear due to insufficient data.
Understanding these aspects is essential for anyone learning how to read a phylogenetic tree, as they influence the interpretation of evolutionary relationships.
Different Tree Shapes and Formats
Phylogenetic trees can be depicted in various formats, such as rectangular, circular, or diagonal. Regardless of the shape, the branching patterns remain the same and represent the same evolutionary history. Another key aspect to consider is that rotating a tree around a node does not change the informational content, as only the topology matters.
Effective tools are necessary for constructing and visualizing these diagrams. Platforms like Creately provide visual collaboration capabilities, allowing users to model and document evolutionary relationships efficiently. With data-integrated diagramming and unlimited collaboration, Creately enhances the understanding and application of phylogenetic tree construction in both educational and professional settings.
Phylogenetic Tree Templates


Which Species Are More Related?
Identifying Relationships
Determining which species are more closely related on a phylogenetic tree involves analyzing their common ancestors. Essentially, two species are considered more related if they share a more recent common ancestor. This aspect is crucial in studying evolutionary biology and understanding the links between different organisms, which can be represented beautifully through phylogenetic tree diagrams.
Role of Common Ancestors
The branching points or nodes in a phylogenetic tree indicate common ancestors. The more recent the common ancestor, the closer the relationship between the descendant species. For instance, if Species A and Species B diverge from a common ancestor more recently compared to Species A and Species C, then Species A and Species B are more closely related. This method of analysis is pivotal for researchers and geneticists who aim to map lineage data accurately.
Why Tree Rotations Don’t Change Relationships
It’s essential to understand that rotating a phylogenetic tree does not alter the relationships between species. The concept might seem counterintuitive initially, but rotations merely change the tree’s appearance and not the fundamental branching patterns. As long as the tree’s topology is preserved, meaning the branching order remains the same, the relationships between species stay unchanged. This insight can significantly aid in avoiding misinterpretations and errors while analyzing phylogenetic trees.
Shared Common Ancestors: Two species are more closely related if they share a recent common ancestor.
Nodes Indicate Relationships: Nodes represent divergence from common ancestors, crucial for understanding species relatedness.
Tree Rotations: Rotations do not impact the relationships depicted by the tree, ensuring accurate analysis.
Tips for Reading Phylogenetic Trees
Reading phylogenetic trees can be initially overwhelming. However, with a structured approach, you can unravel the evolutionary stories they depict. Here are some essential tips to help you navigate and interpret these evolutionary diagrams.
Focusing on Branching Patterns
The key to understanding phylogenetic trees lies in focusing on the branching patterns. These patterns, rather than branch lengths, are crucial as they reflect evolutionary relationships. The branches demonstrate paths of descent, showing how species diverge from common ancestors. Always trace the lineage to determine shared ancestry.
Handling Tree Rotations
Phylogenetic trees can often be rotated at their nodes without changing the information they convey. This is because such rotations do not alter the evolutionary relationships depicted by the tree. When reading, remain aware that the orientation of the branches is not as important as the structure of the branching itself.
Rotating trees at branch points does not affect the relationships indicated.
Focus on the sequence of branching when identifying relationships.
Understanding Polytomies
Polytomies, where a branch point diverges into three or more lineages, indicate insufficient data to resolve the particular branching order. Recognize them as areas where further research could elucidate the evolutionary relationships:
A polytomy highlights gaps in our evolutionary knowledge.
It does not imply equal relatedness among diverging groups.
With these tips, you can better grasp how to read phylogenetic trees and appreciate the evolutionary insights they provide. Creately, with its powerful visual collaboration tools, enhances this understanding by allowing for seamless visualization and documentation of these complex diagrams. By integrating data with visual elements, you can model and analyze phylogenetic trees with greater clarity and efficiency.
Final Thoughts
Phylogenetic trees are invaluable in modern biology, providing insights into evolutionary events and helping to structure taxonomic classifications. As we delve deeper into interpreting these visual diagrams, tools like Creately enhance the understanding and application of phylogenetic trees by offering robust features for visual collaboration and data-integrated diagramming.
By leveraging these advanced features, educators, researchers, and students can better visualize and document evolutionary relationships, leading to more informed and accurate biological insights. The use of visual tools transforms how we approach the study of evolution, making complex concepts more accessible and collaborative. Embrace the power of phylogenetic trees and the potential of visual collaboration to unlock new dimensions of understanding in evolutionary biology.