Managing remote teams is harder when people cannot easily see who does what, who owns decisions, or how teams connect. Org charts for remote teams help by making team structure visible, giving distributed employees more context, and creating clarity across roles, locations, and time zones.
What Is a Remote Team Org Chart?
A remote team org chart is a visual map of how a distributed team is organized. It shows reporting lines, roles, departments, and team connections, and can also include details like location, time zone, work arrangement, and cross-functional relationships. This helps remote employees understand how the organization works and where they fit in.
Why Remote Teams Need More Structure, Not Less
Remote work offers flexibility, but it also removes the visibility people naturally get in shared offices. Without that visibility, employees may be less clear on who leads what, who to go to for help, and how teams connect. That is why remote teams need structure to be clearly shown, not simply assumed. Org charts help make that structure easier to see and understand.
What to Include in a Remote Team Org Chart
A useful remote team organizational chart should include:
- Employee names to clearly identify each person in the organization.
- Job titles to show each person’s role and level of responsibility.
- Reporting lines to make it clear who reports to whom.
- Departments to show how teams are grouped across the business.
- Team relationships to help employees understand who they work closely with.
- Locations or regions to show where employees are based.
- Work arrangements such as remote, hybrid, or onsite to give more context to how teams operate.
- Time zones to make coordination across distributed teams easier.
- Cross-functional connections to show how people collaborate across departments or projects.
Including this extra context helps distributed employees understand who people are, what they do, and how the organization fits together.
Benefits of Org Charts for Managing Remote Teams
| Benefit of managing remote teams with org charts | Why it matters |
| They clarify roles and responsibilities | Role ambiguity is a common challenge in remote work. Org charts make reporting lines, leadership structure, and team relationships easier to see, helping employees understand who manages them, who owns a function, and where their role fits. |
| They improve communication paths | Remote teams rely on intentional communication. Org charts show the right communication paths across the business, making it easier for employees to identify teammates, managers, and cross-functional partners while reducing delays. |
| They make remote onboarding easier | Onboarding is harder when new hires cannot learn team structure by observing the workplace. A remote org chart gives them a quick way to understand their manager, team, related departments, and key collaborators. |
| They help distributed teams see the bigger picture | Remote employees can sometimes feel disconnected from the wider organization. Org charts show how teams and functions connect, helping employees understand how work flows across the company and how their role contributes to larger goals. |
| They support collaboration across departments and time zones | Distributed teams often work across functions, locations, and time zones. Org charts make these connections easier to see, helping employees identify the right people across departments and collaborate more smoothly. |
| They make team changes easier to communicate | In remote settings, reporting changes and team updates are easier to miss. An updated org chart gives everyone one clear view of the current structure, making changes easier to communicate and helping teams adjust faster. |
How to Use Org Charts to Manage Remote Teams More Effectively
Using Creately’s org chart maker for this makes the process much easier because you can build, update, and share your remote team org chart in one place. Instead of relying on static charts or scattered spreadsheets, you can map reporting lines clearly, add remote-specific team details, and keep the structure current as the team changes.
Step 1: Import your remote team structure
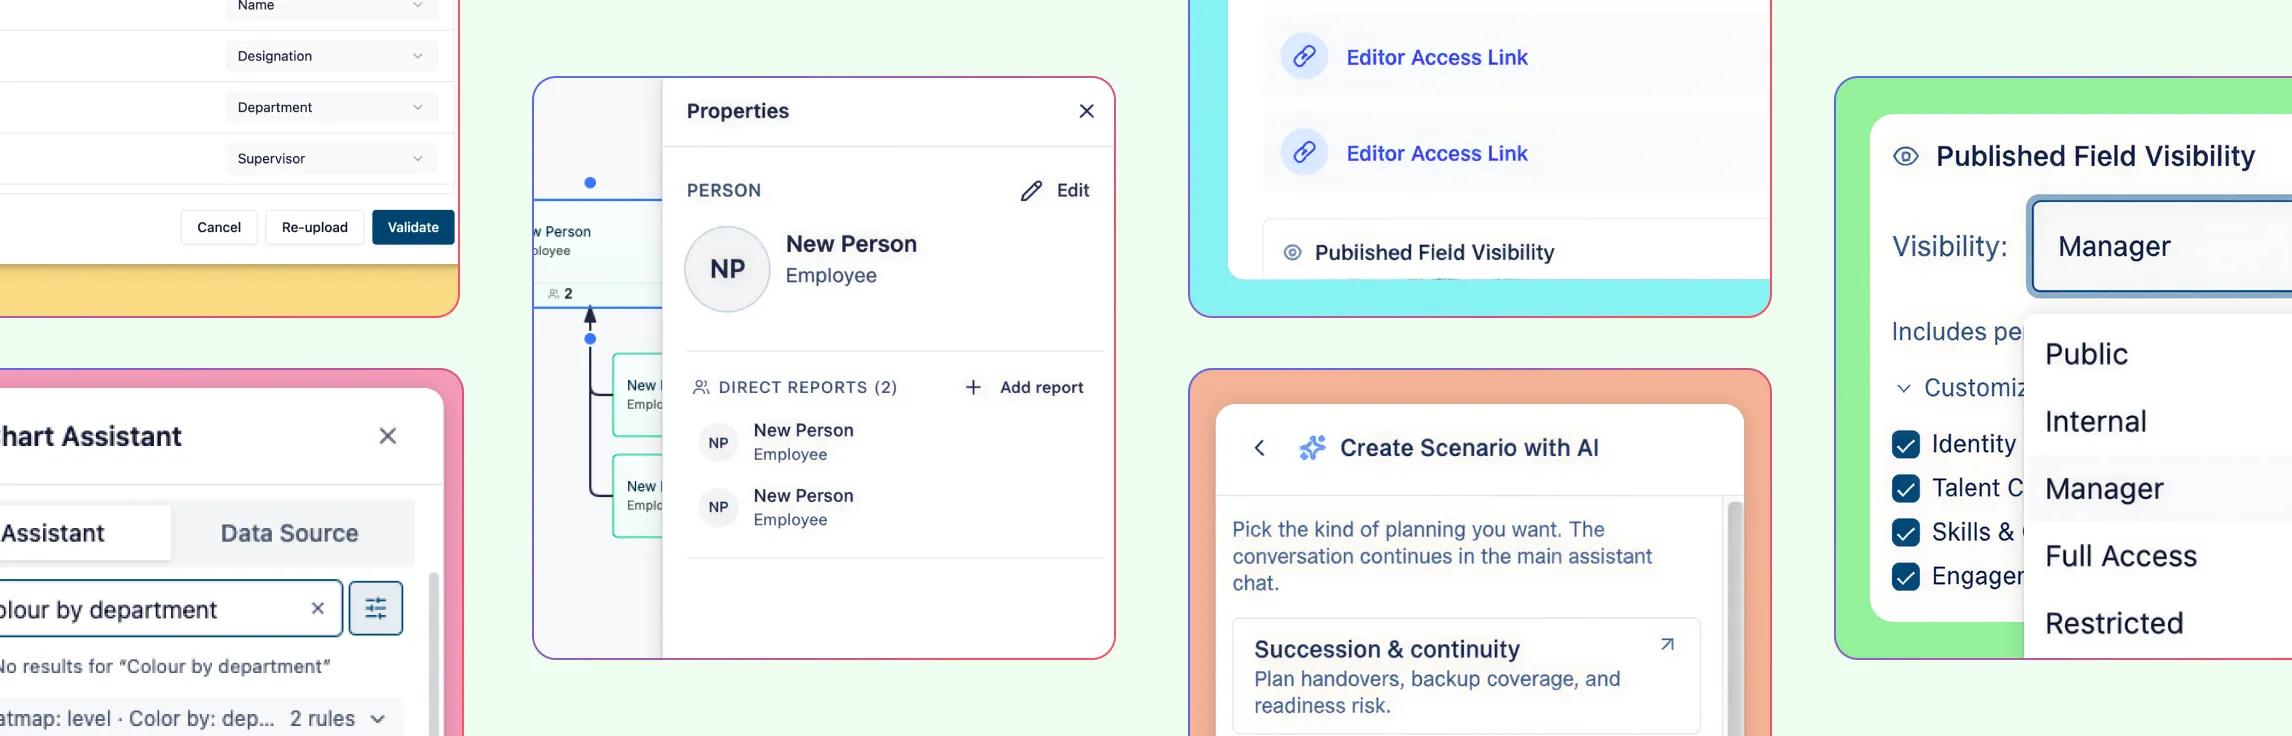
Start by building the base organizational chart in Creately. You can import a spreadsheet with employee names, titles, departments, and reporting lines, and the system will auto-map common columns, validate issues like missing IDs or unknown managers, and generate the hierarchy with auto-layout. You can also start from scratch and build the structure manually.
- Import team data from CSV
- Auto-map common fields like name, title, and manager
- Validate reporting issues before import
- Generate the org chart automatically
Step 2: Build out reporting lines and team structure
Once the chart is in place, add managers, direct reports, and teams to reflect how your remote organization works. Creately lets you grow the chart visually using blue connection dots on each card, so you can add people and reporting lines quickly without drawing everything from scratch.
- Add managers and direct reports visually
- Use quick-create actions to expand the chart faster
- Build the org chart from scratch when needed
Step 3: Add remote team details
After the structure is mapped, add the context remote teams need to work better together. Creately supports details like location, region, and work arrangement, along with role and department information, so employees can better understand how the team is organized across locations and ways of working.
- Add roles and departments
- Include location or region details
- Show remote, hybrid, or onsite work arrangement
- Use custom fields for extra team information
Step 4: Make the chart easier to navigate
As the organizational chart grows, make it easier for people to find the information they need. In Creately, users can search by name, title, department, or other field values, zoom to matching people, and use focus views to isolate a department or team. This makes large remote org charts much easier to use.
- Search by name, title, department, or other details
- Zoom to the right person or team
- Use focus view to isolate one part of the org chart
Step 5: Use visual views to understand the team better
Once your organizational chart includes the right data, use Creately’s visual views to make the team easier to analyze. You can filter people by specific criteria, apply color-coded views, and surface patterns across departments, locations, or work arrangements to better understand how the remote team is structured.
- Filter people by team details
- Use color-based views for faster visibility
- Compare how teams are distributed across the organization
Step 6: Keep the org chart updated together
A remote org chart only works if it stays current. Creately makes this easier with inline editing, real-time updates, and shared collaboration. Teams can edit details directly on cards, leave comments, and work together on the same organizational chart so everyone has one up-to-date view of the organization.
- Update names, titles, and details inline
- Collaborate with comments and shared editing
- Keep one current version of the org chart for everyone