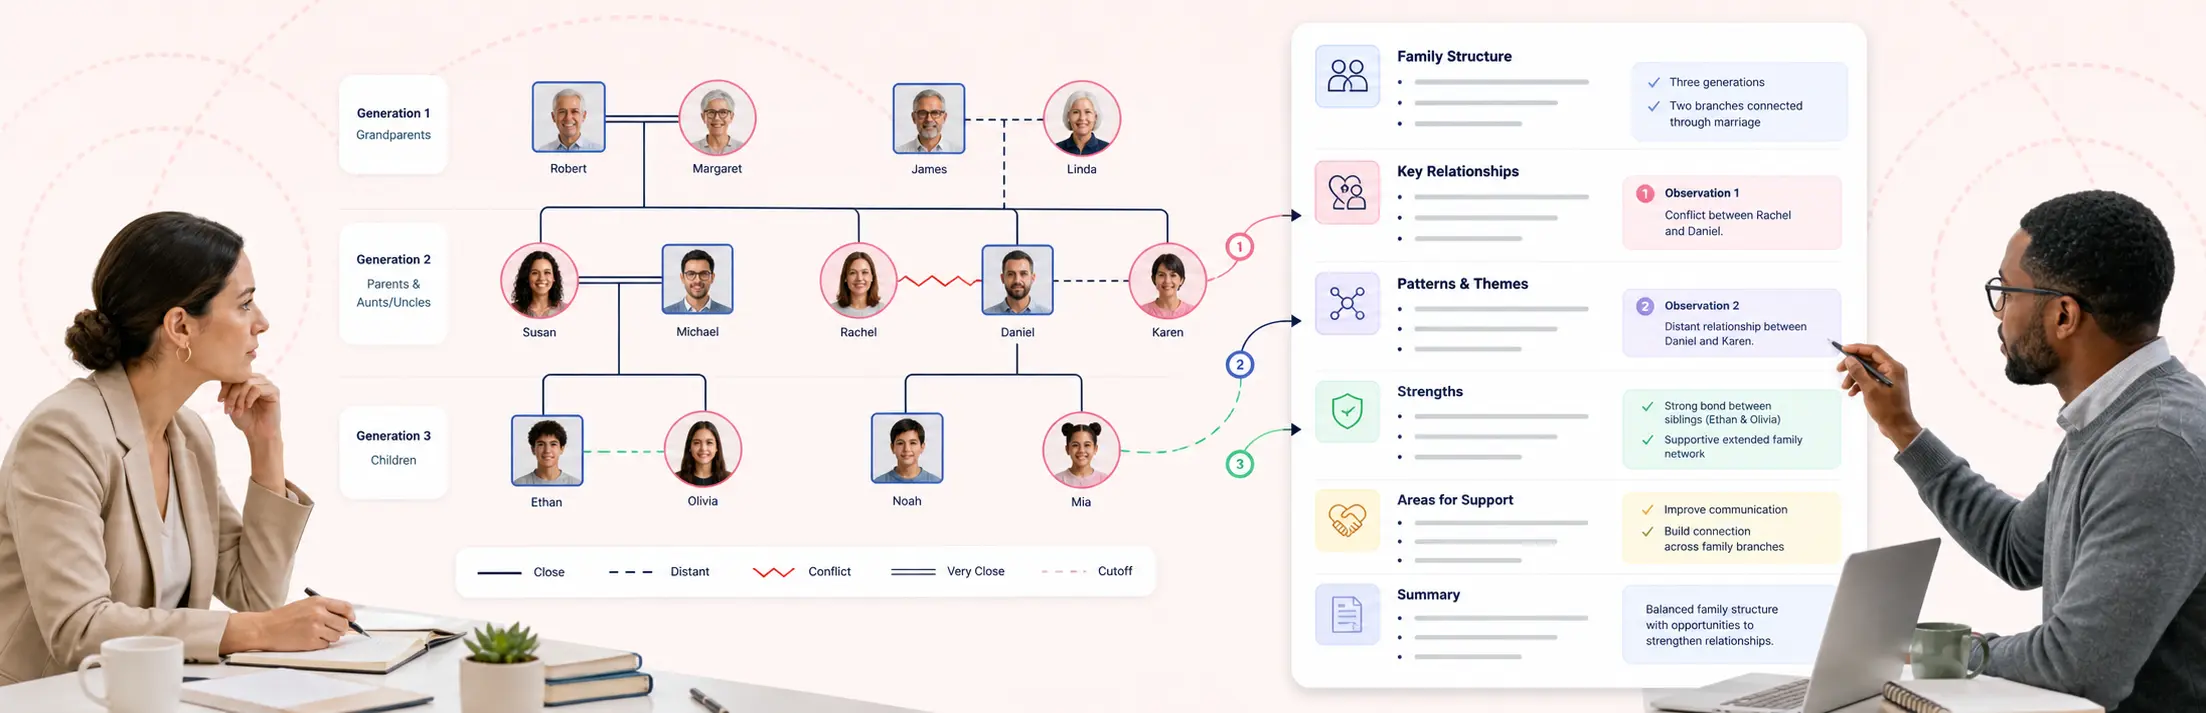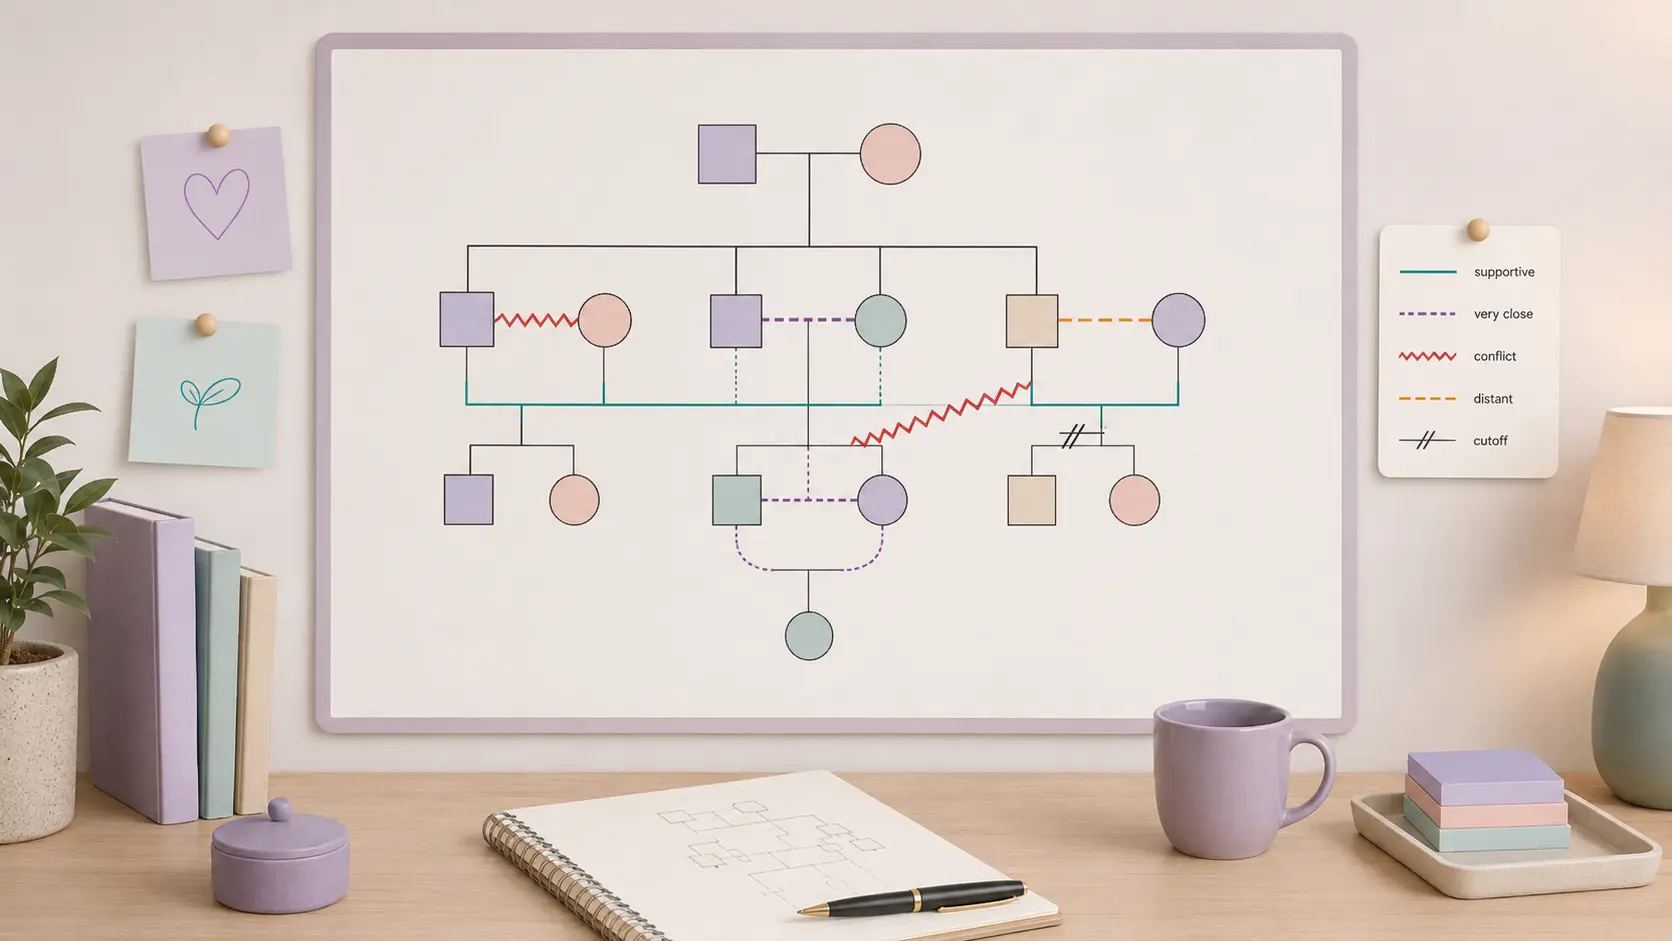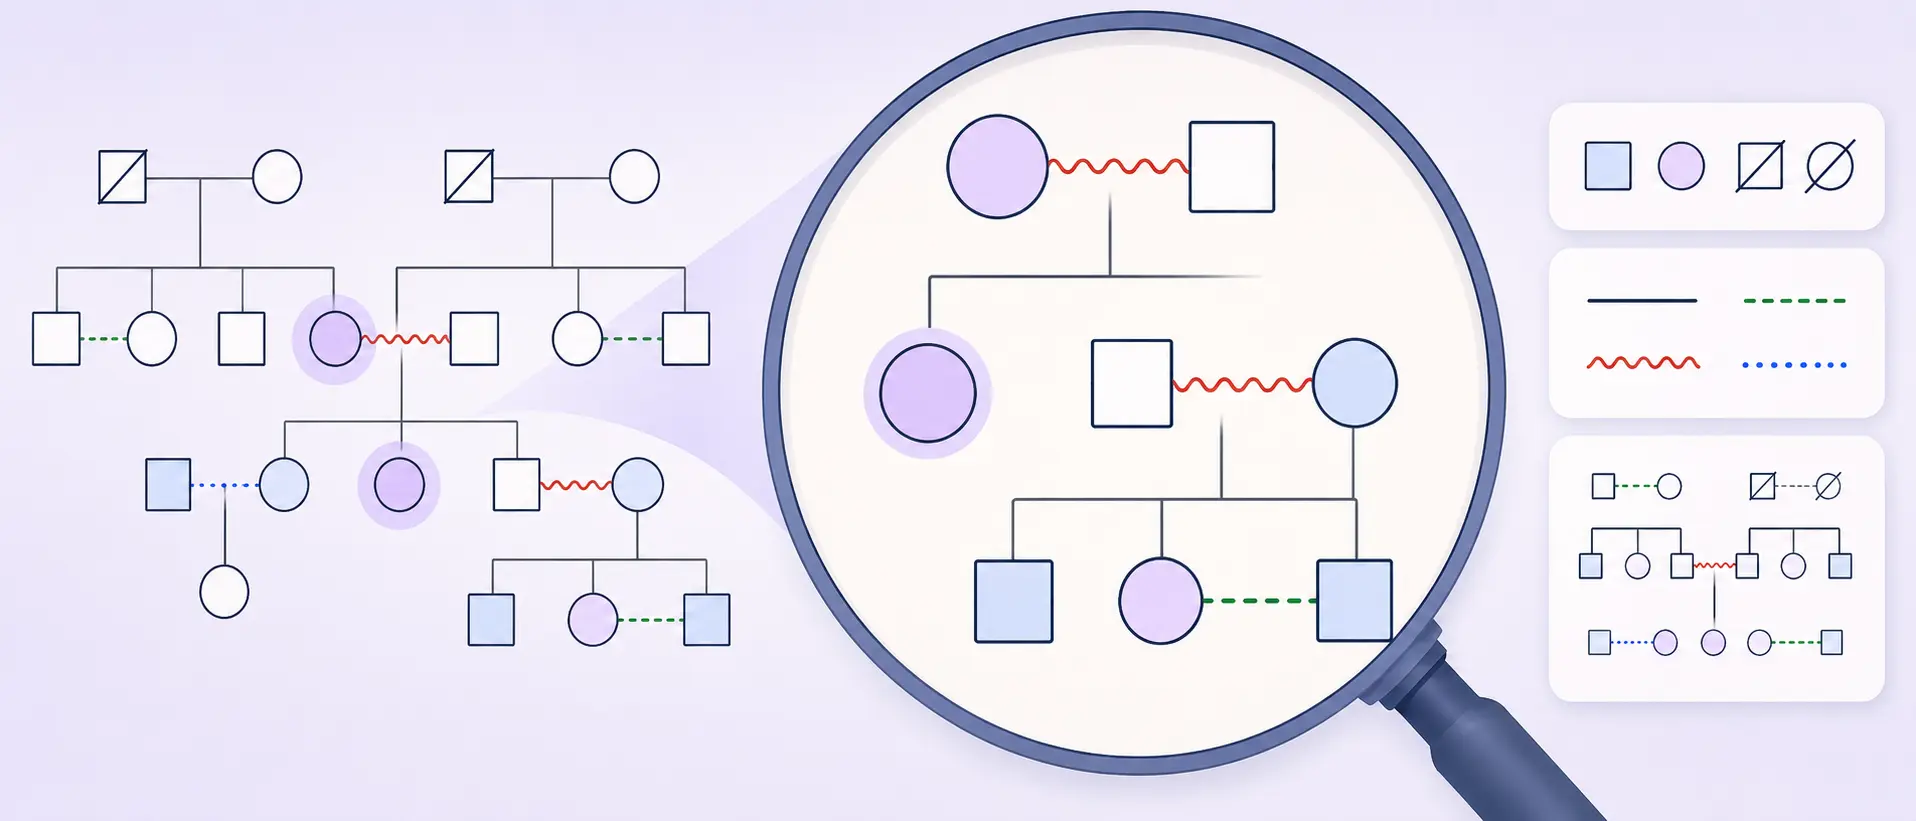
A genogram can look confusing at first, with different symbols, lines, dates, notes, and relationship markers spread across several generations. But once you know what to look for, it becomes much easier to read. In this guide, we explain how to read a genogram step by step, including its structure, symbols, relationships, life events, and patterns.
Steps to Read a Genogram
Reading a genogram means understanding who is in the family, how they are connected, and what the diagram shows about relationships, life events, health history, and patterns across generations. Unlike a basic family tree, it can show details such as marriage, divorce, adoption, conflict, illness, loss, and caregiving roles. It should be used to notice patterns and ask better questions, not to make quick conclusions or diagnose a family problem.
Step. 1 Start With the Legend or Key
Before reading the genogram, look for a legend or key. The legend explains what the symbols and lines mean.
This matters because genogram symbols can vary slightly depending on the tool, organization, school, or professional setting. One diagram may use a certain line style to show conflict, while another may use a slightly different style. If you skip the legend, you may misunderstand the diagram.
Look for symbols that explain:
- person shapes
- gender or identity markers
- death or life status
- marriage, divorce, separation, or cohabitation
- biological, adopted, foster, or step relationships
- emotional relationships such as closeness, conflict, distance, or cutoff
- health conditions or medical notes
If the genogram does not include a legend, read it carefully and avoid making assumptions about unfamiliar symbols.
Creately tip: Use the built-on diagram legend and clear relationship labels to make the genogram easier to read at a glance. This helps readers quickly understand what each marker, condition, or relationship line represents.
Step 2. Find the Main Person
Most genograms are built around one main person. This person may be called the index person, client, patient, focus person, or identified person.
They are often marked with a double border, arrow, highlight, or label. Once you find the main person, the rest of the genogram becomes easier to follow because you can see how everyone else connects to them.
Ask:
- Who is the genogram centered around?
- Are they part of the youngest, middle, or older generation?
- Which family members are directly connected to them?
- What relationships or patterns around this person seem important?
Starting with the main person helps you avoid getting lost in a large family map.
Step 3. Read the Basic Family Structure First
Before you look at emotional relationships or deeper patterns, understand the basic family structure.
Start by identifying the generations shown. Many genograms show at least three generations, such as grandparents, parents, and children. Some may show more, especially in family therapy, social work, medical history, or genetic counseling.
Then look at the main family connections:
- parents
- children
- siblings
- partners
- grandparents
- stepfamily members
- adopted or foster family members
- previous partners
- household members
Pay attention to birth order as well. Siblings are usually shown from oldest to youngest, often from left to right. This can help you understand family roles, age gaps, and sibling relationships.
At this stage, the goal is simple: understand who belongs to the family system and how they are connected.
Step 4. Understand the Main Genogram Symbols
Genograms use shapes and markers to represent people and important family details. A square usually represents a male, a circle usually represents a female, and a diamond or neutral symbol may be used when gender is unknown, unspecified, or represented differently depending on the notation system.
A deceased person is often shown with an X through the symbol, with the age or year of death written nearby. Genograms may also include symbols for pregnancy, miscarriage, abortion, stillbirth, twins, adoption, foster care, and other family situations.
Always check the legend to confirm what each symbol means.
Step 5. Read Structural Relationship Lines
Structural relationship lines show how people are connected in the family. These are the lines that show marriages, partnerships, parent-child relationships, siblings, divorces, separations, and other family links.
For example:
- a horizontal line may show a marriage or partnership
- a broken line may show separation
- a line with a slash may show divorce
- a vertical line usually connects parents to children
- child lines show biological, adopted, foster, or step relationships depending on the style used
This part of the genogram shows the family structure. It tells you who is connected to whom, but it does not always tell you how they feel about each other.
For example, two people may be married but emotionally distant. A parent and child may be biologically connected but cut off from each other. This is why structural lines and emotional lines should be read separately.
Step 6. Read Emotional Relationship Lines Separately
Emotional relationship lines show the quality of relationships between people. These lines may show closeness, conflict, distance, cutoff, hostility, abuse, or very close attachment.
This is one of the most important parts of reading a genogram because it helps show how people interact, not just how they are related.
Common emotional relationships may include:
- close relationship
- very close relationship
- distant relationship
- conflict
- cutoff or estrangement
- hostile relationship
- fused or overly dependent relationship
- abusive relationship
Do not jump to conclusions from one emotional line. A conflict line does not explain the full relationship. It simply shows that conflict is an important part of that relationship and may need more context.
For example, a cutoff between a parent and adult child could be related to long-term conflict, abuse, migration, divorce, family secrets, or personal boundaries. The line tells you there is a pattern to explore, but it does not tell the whole story by itself.
Creately tip: Creately’s relationship types use distinct visual notation, so it is easier to separate family structure from emotional dynamics such as closeness, conflict, cutoff, distance, or abuse.
Step 7. Look at Dates, Ages, and Life Events
Dates and ages can change how you understand a genogram. They help explain when important events happened and whether certain patterns appear at similar life stages.
Look for:
- birth and death dates
- age at death or diagnosis
- marriage, divorce, or separation dates
- age when children were born
- migration or relocation
- major losses, illness, adoption, foster placement, or remarriage
Timing helps you understand context. For example, a child’s behavior after a parent’s death may be read differently from the same behavior before the loss. A family cutoff after a divorce may mean something different from a cutoff after abuse, illness, or migration.
When reading a genogram, ask what changed before and after major life events.
Step 8. Look for Patterns Across Generations
Once you understand the structure, symbols, relationship lines, and timing, start looking for patterns.
A genogram is especially useful because it can show repeated patterns across generations. These patterns may not be obvious when family information is shared only through conversation or notes.
Look for patterns such as:
- relationship patterns, such as repeated divorce, conflict, cutoff, or estrangement
- health patterns, such as chronic illness, inherited conditions, addiction, or mental health concerns
- life event patterns, such as early deaths, migration, displacement, trauma, or repeated loss
- caregiving patterns, such as parentification, kinship care, or family members taking responsibility at a young age
- family structure patterns, such as blended families, adoption, foster care, or absent family members
- communication patterns, such as silence around certain people, events, or relationships
Patterns should be treated as clues, not final answers. A repeated pattern may suggest something worth exploring, but it does not prove the cause.
For example, if several generations show conflict between fathers and sons, the genogram may point to a relationship pattern. But you would still need more information before deciding why that pattern exists.
Creately tip: The Genogram Assistant can analyze the diagram for inherited risk patterns, health clusters, emotional dynamics, and behavioral patterns, helping you see what may need closer attention.
Step 9. Read for Strengths, Not Just Problems
Many people read genograms only to look for risk, conflict, illness, or trauma. But a good genogram reading should also identify strengths.
Look for supportive relationships, stable caregivers, close siblings, recovery from illness or addiction, cultural or community support, and family members who helped during difficult times.
Strengths are important because they show where support, resilience, and connection exist in the family system.
For example, a genogram may show repeated parental conflict, but it may also show that an aunt, grandparent, older sibling, or community member provided steady support. That support can be just as important as the problem being studied.
Step 10: Use the Genogram to Ask Better Questions
A genogram should help you explore patterns, not make quick assumptions. Once you understand the structure, symbols, relationships, and life events, use what you see to ask better questions.
Ask:
- What information is missing or uncertain?
- Which relationships are close, distant, or conflictual?
- Are there patterns that repeat across generations?
- What major events changed the family structure?
- Are there health conditions or losses that appear more than once?
- What strengths or support systems are visible?
- What does the client, patient, student, or family member think this pattern means?
These questions help you read the genogram more carefully and respectfully.
Creately tip: The Assistant Insights panel can surface missing or unclear details, such as missing ages of onset, incomplete diagnoses, unclear biological relationships, or other data gaps. This helps you decide what to verify next.
Once you understand the notation and reading process, use the written genogram analysis examples to see how evidence, findings, limitations, and follow-up questions can be documented without turning a visible pattern into an unsupported conclusion.
Simple Genogram Example and How to Read It
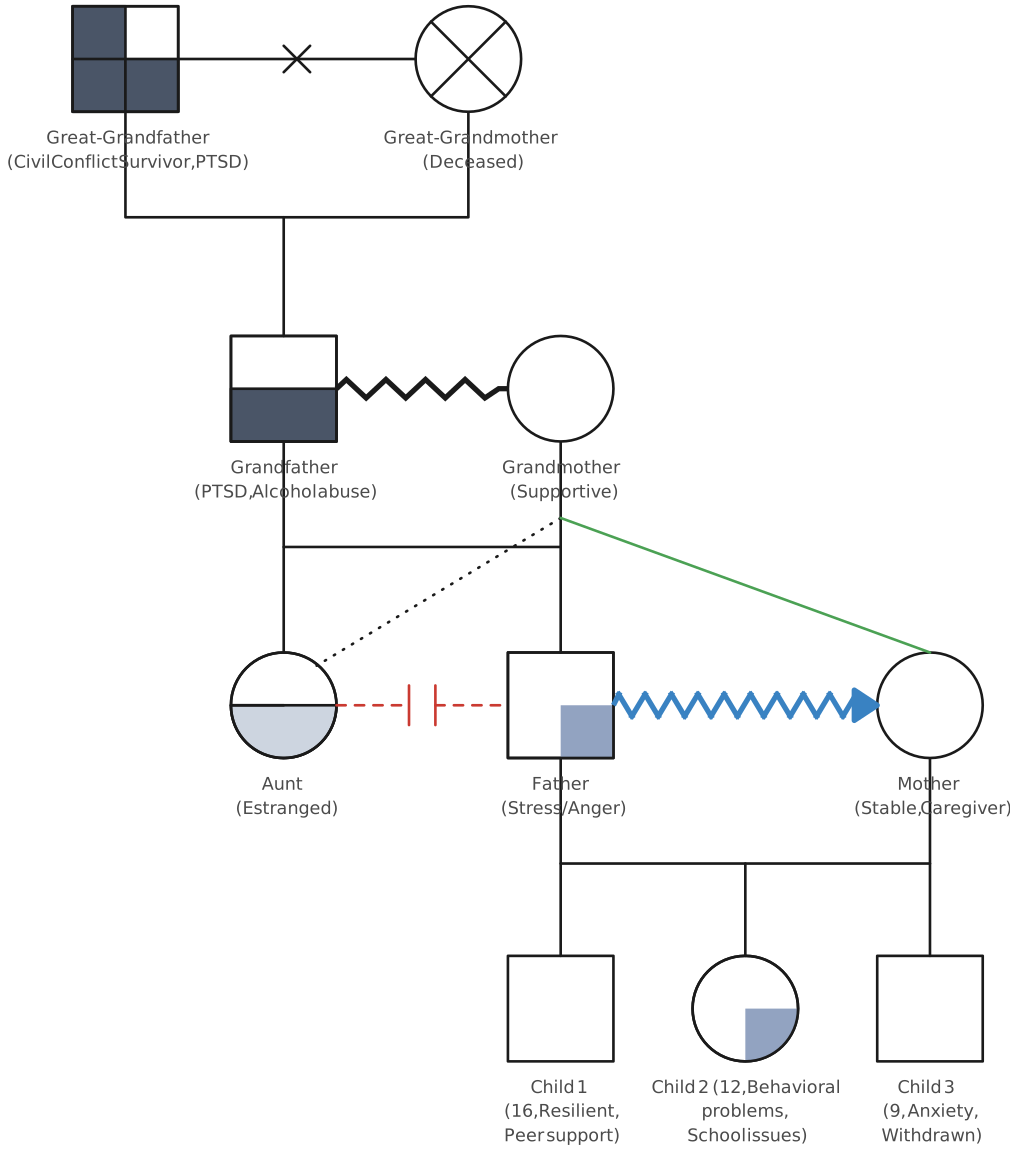

In this example, the genogram shows four generations: great-grandparents, grandparents, parents, and three children. Start by reading the family structure. The father and mother are the parents of Child 1, Child 2, and Child 3. The father’s side also includes an aunt, grandparents, and great-grandparents.
Next, look at the notes and symbols. The great-grandmother is deceased, while the great-grandfather is noted as a civil conflict survivor with PTSD. The grandfather also has PTSD and alcohol abuse, and the father is marked with stress and anger. This may suggest a pattern of trauma and stress across generations.
Now read the relationship lines. The genogram shows conflict between the grandfather and grandmother, estrangement around the aunt, and conflict between the father and mother. It also shows support from the grandmother to the mother.
Finally, look for strengths and questions. The grandmother is supportive, the mother is a stable caregiver, and Child 1 has resilience and peer support. Child 2 and Child 3 show signs of difficulty, so useful follow-up questions could include: How does parental conflict affect each child? What helps Child 1 stay resilient? Could similar support help the younger children?
This example shows how a genogram helps you move from structure to symbols, relationships, patterns, strengths, and better questions.
Common Mistakes When Reading a Genogram
- Skipping the legend: Symbols and relationship lines can vary, so always check what each shape, line, and marker means before interpreting the genogram.
- Confusing structure with emotion: A marriage, sibling, or parent-child line shows how people are connected, but not always how close, distant, or conflictual they are.
- Focusing only on problems: Look beyond conflict, illness, trauma, or loss. Also notice strengths such as supportive relationships, stable caregivers, resilience, and recovery.
- Making quick conclusions: A divorce, cutoff, illness, or conflict line shows something worth exploring, but it does not explain the whole story by itself.
- Treating the genogram as final: Family information can change as new details are shared, corrected, or better understood.