A backend design review can involve several different questions: Where does a request go? Which service owns a record? What runs in each environment? A single diagram rarely answers all of them well. The six templates below give backend engineers a useful view for each question, from system structure to failure handling.
Each template is editable in Creately. Replace the example components with the services, data, and constraints you have actually verified. A diagram is most useful when reviewers can tell what it includes, what it leaves out, and which decision it supports.
Which Backend Engineering Template Should You Use?
| If you need to show… | Start with… | Main question |
|---|---|---|
| Services and their connections | Architecture diagram | What are the system boundaries and dependencies? |
| An API call and its responses | API request sequence | What happens from request to result or error? |
| Entities, keys, and relationships | ER diagram | How should the data fit together? |
| A feature’s interactions over time | Sequence diagram | In what order do components exchange messages? |
| Software on servers or cloud nodes | Deployment diagram | Where does each component run? |
| A repeatable failure investigation | Troubleshooting flowchart | What should an engineer check next? |
These views can describe the same system without duplicating one another. Start with the decision at hand, then add another view when a different question comes up.
1. System Architecture Diagram Template
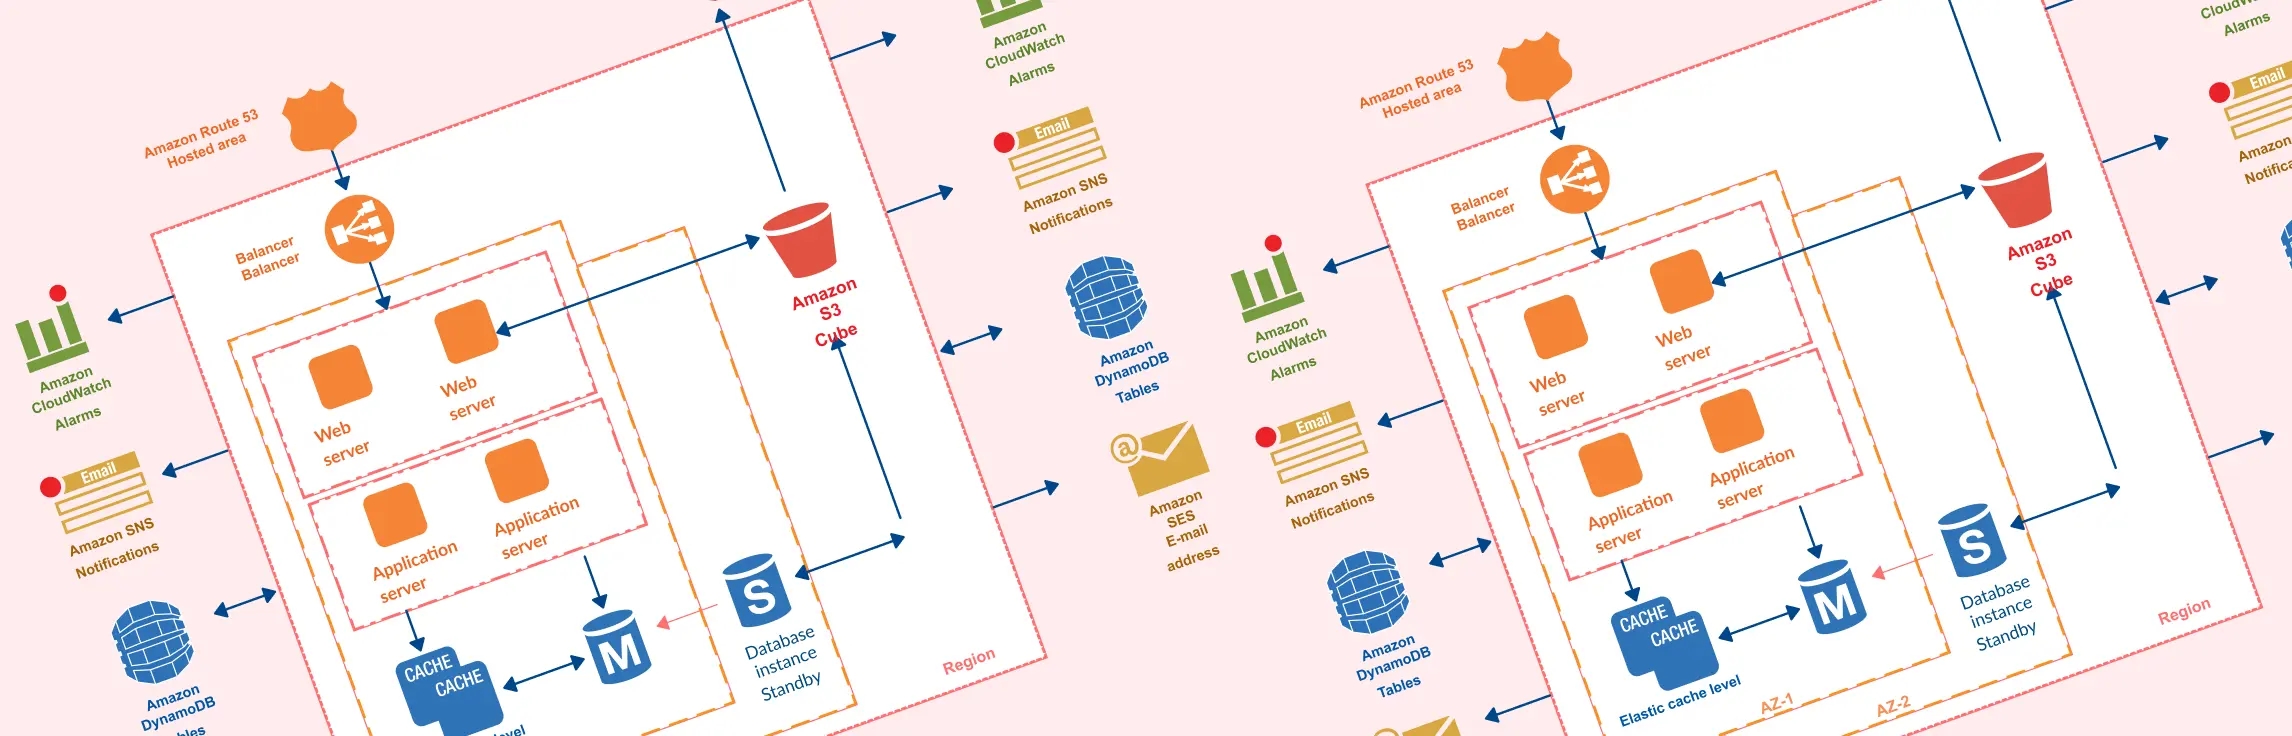
Use an architecture diagram to show the main parts of a backend system and the connections among them. For an order service, that might include the client, API gateway, order service, payment provider, database, and message queue. Label each connection with the kind of request or data it carries. Mark external services and trust boundaries if they affect the design decision.
This architecture diagram template is a starting point for a high-level view. Keep implementation details out of this first diagram so a reviewer can spot missing dependencies. The block diagram guide explains how to break a system into components when you need more detail.


2. API Request Sequence Template
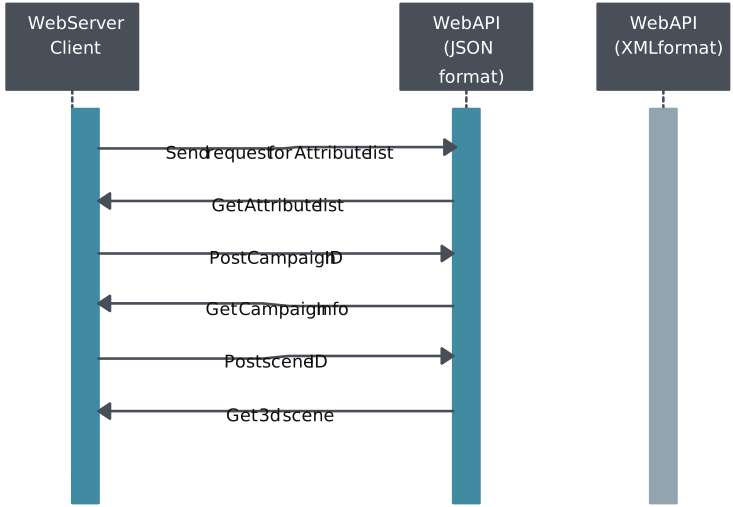
An API request sequence is useful when the team needs to agree on how a client and service interact. Show the caller, the endpoint or service, the request, the response, and any important error or timeout path. If several services participate, add only the ones involved in the behavior under review.
The Web API sequence template shows request and response messages. Its labels are illustrative, so replace them with your endpoint names and actual payload or status information. This is a behavioral view; it does not replace an API contract or test cases. For a simpler view of messages crossing the system boundary, see the system sequence diagram guide.
3. ER Diagram Template for Database Design
Use an entity relationship diagram (ERD) when you need to decide how business data is structured. Add the entities, their key attributes, and the relationships and cardinalities between them. For example, if one customer can place many orders, show that relationship before discussing table names or indexes.
The simple ER diagram template helps expose missing entities and unclear ownership. Validate the model against real data rules, then use the ER diagram creation guide for notation and modeling steps. An ERD describes data structure; it does not show when an API call happens.

4. Sequence Diagram Template for a Feature Flow
A sequence diagram traces one scenario from start to finish. It is useful when several components exchange messages and their order matters, such as checking stock, authorizing a payment, and saving an order. Show the participants as lifelines, label the messages, and add alternative paths for important failures.
The online shopping sequence template provides a concrete scenario to edit. It can help a team discuss what happens when a dependency fails or a validation repeats. For more on notation, see the sequence diagram tutorial.

5. Deployment Diagram Template
Use a deployment diagram to show where software artifacts run and how the runtime nodes connect. It may include application services, containers or servers, databases, network boundaries, and external systems. This view is useful for deployment reviews, operational handoffs, and discussing a change that affects availability or security.
The UML deployment diagram template gives you nodes and connections to customize. Check its labels against the intended environment rather than assuming a design diagram reflects what is live. The deployment diagram tutorial covers the notation in more detail.

6. Troubleshooting Flowchart Template
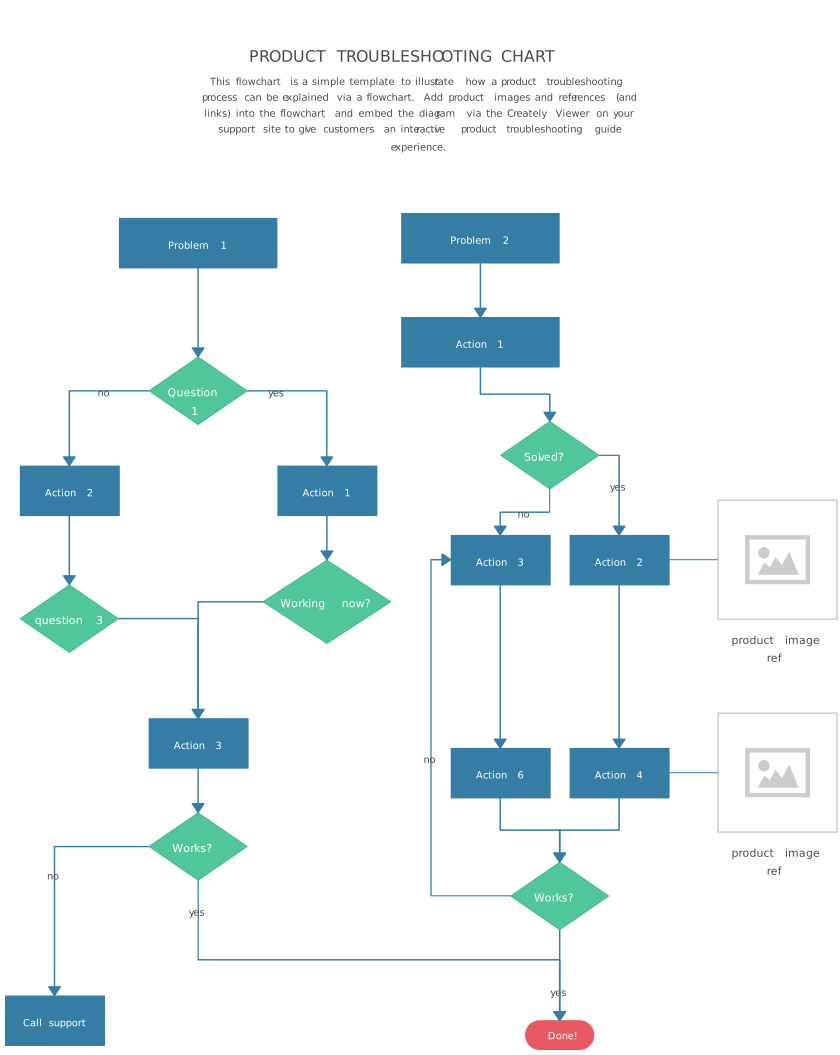
A troubleshooting flowchart turns a known failure into a repeatable set of checks. For a backend service, start with the observed symptom, then branch on facts such as whether the request reached the service, a dependency responded, or a recent deployment changed behavior. End each path with an action or an escalation owner.
The product troubleshooting flowchart was made for a general support process, so adapt its questions to your service and incident runbook. Keep live commands, credentials, and sensitive details in the appropriate operational documentation rather than on a broadly shared diagram. For the wider response and escalation process, see the incident management guide.
Keep the Diagrams Useful After the First Review
Give each diagram a clear title, boundary, owner, and review date. Use the architecture view to orient people, then link the API, data, behavior, and deployment views to the decisions they explain. When the implementation changes, update the affected view and note what was verified. Otherwise, a polished diagram can become a misleading one.
In Creately Workspace, engineers can keep diagrams, notes, and review comments on the same shared canvas. That gives a team a place to discuss a design and preserve the reasoning beside the visual, while the underlying code and operational systems remain the sources to verify against.