AON (Activity-on-Node) Network Diagrams are crucial tools in project management, offering a visual representation of activity relationships and dependencies. In this guide, you’ll learn what an AON network diagram is, explore its key components, and follow simple steps to create one using free, editable AON network diagram templates to get started quickly.
What is an AON Network Diagram
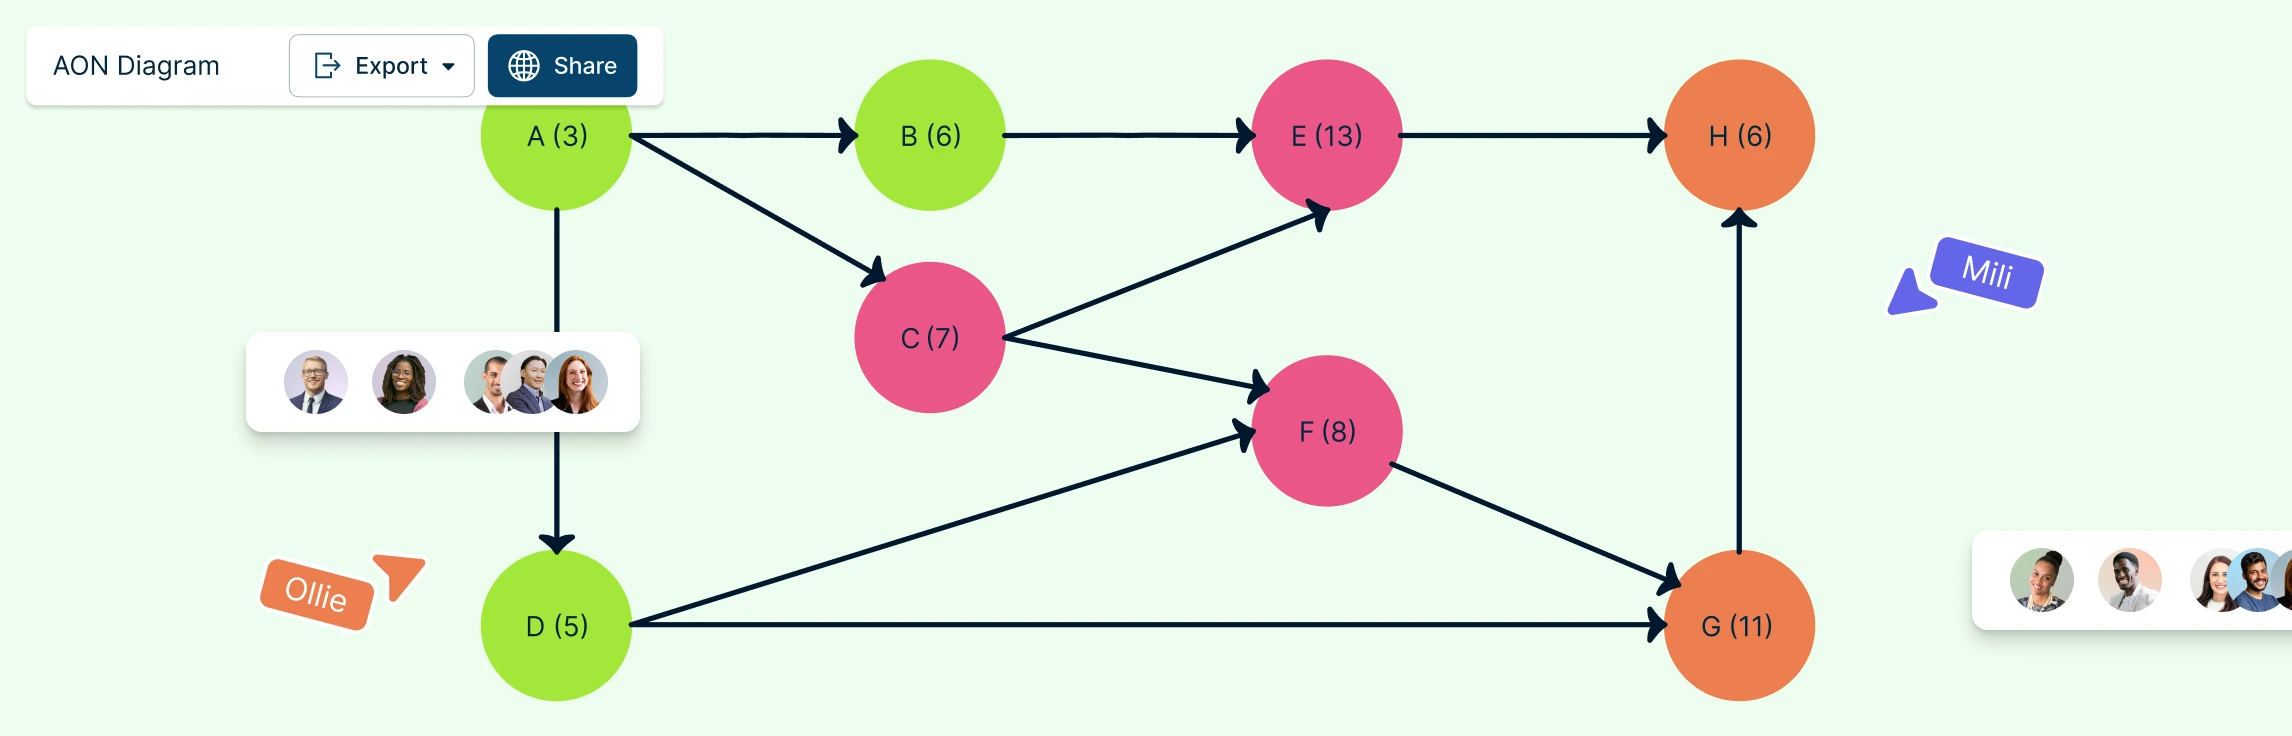
An AON (Activity-on-Node) Network Diagram is a project management tool that visually represents how tasks within a project are structured and interrelated. In AON network diagrams, each activity is represented as a node (usually a box or rectangle), while arrows illustrate the logical dependencies between those activities, showing which tasks must be completed before others can begin. This structure makes it easy to understand task sequencing, parallel activities, and dependency constraints at a glance. AON network diagrams are commonly used in scheduling methods such as the Critical Path Method (CPM) and PERT analysis, where accurately defining task relationships is essential.
Main Components of an AON Network Diagram
AON (Activity-on-Node) Network Diagrams are essential tools in project management, providing a clear visual representation of task dependencies and project timelines. These diagrams consist of nodes representing activities and connectors that define the relationships between tasks.
The main components of an AON Network Diagram are:
Nodes (Activities): Represent tasks or activities within the project.
Connectors (Dependencies): Arrows showing relationships between activities, such as:
- Start-to-Start (SS): Activity A must begin before Activity B can start.
- Finish-to-Finish (FF): Activity A must finish before Activity B can finish.
- Start-to-Finish (SF): Activity A must start before Activity B can finish.
- Finish-to-Start (FS): Activity A must finish before Activity B can start.
Critical Path: The longest sequence of dependent activities that determines the project duration.
Timeline: Indicates the sequence and duration of tasks.
Each node in an AON diagram represents an individual activity or task within a project, positioned in a logical sequence that reflects the project’s timeline. By mapping these activities and their relationships visually, project managers can gain a comprehensive understanding of the entire project flow.
How to Draw an AON Network Diagram
Creating an AON Network Diagram is a systematic approach to visualizing project activities and their interdependencies. It simplifies complex project data and helps ensure accurate planning and efficient execution. Here’s an optimized step-by-step guide for developing an effective AON diagram:
Step 1: Identify Activities
Start by listing all the activities that need to be included in the AON diagram. Each task should have:
- A descriptive name (e.g., “Design Phase”) to clearly define the activity.
- A unique identifier (ID) (e.g., A, B, C) to ensure easy reference and distinction.
- An estimated duration (e.g., 5 days) to determine the timeline and scheduling.
Being specific with these details ensures an accurate and well-structured diagram.
Here’s an example of how to structure the activity details in a table format:
| Activity ID | Activity Name | Estimated Duration |
| A | Requirements Gathering | 3 days |
| B | Design Phase | 5 days |
| C | Development | 10 days |
| D | Testing | 4 days |
| E | Deployment | 2 days |
This table format helps organize activities clearly, making it easier to construct an AON Network Diagram.
Step 2: Determine Dependencies
Analyze the relationships between activities, such as Start-to-Start (SS), Finish-to-Start (FS), Finish-to-Finish (FF), and Start-to-Finish (SF). Identifying and marking these dependencies will guide the flow of tasks in the diagram.
Step 3: Create Nodes
Use nodes to represent each activity. Ensure the nodes are placed logically in the sequence, aligned with the project timeline, to make the diagram easy to follow.
Step 4: Add Arrows
Connect the nodes with arrows to represent task dependencies. The direction of the arrows should clearly indicate the sequence of tasks. Make sure that all relationships are accurately shown based on the dependencies you defined.
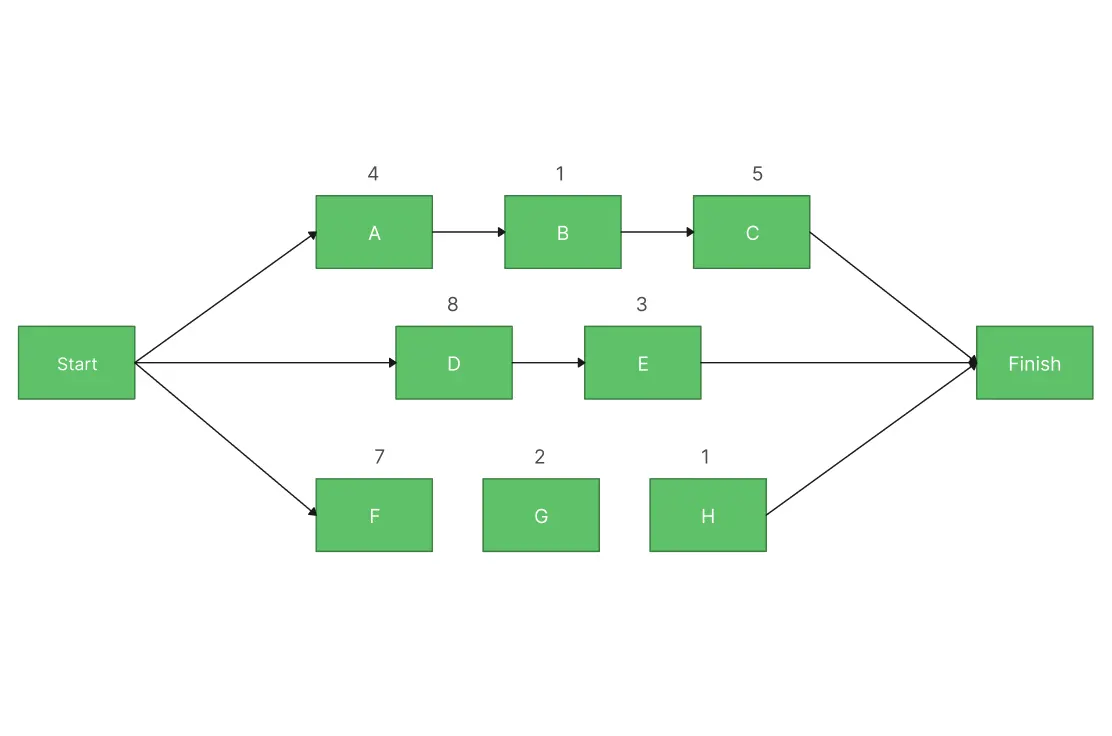
Step 5: Identify the Critical Path
The critical path is the longest sequence of dependent activities that dictates the project’s duration. Highlight this path to ensure that any delays in these activities will directly impact the overall timeline.
Step 6: Review and Revise
Regularly review the diagram with team members and stakeholders to ensure the tasks, dependencies, and critical path are accurate and complete. Adjust the diagram as necessary to accommodate any changes in the project.
Use Cases of AON Network Diagrams
Here are some key use cases where incorporating AON Network Diagrams can significantly enhance project management:
1. Project Scheduling & Timeline Management:
AON diagrams are essential for project scheduling as they provide a clear visualization of task sequences and dependencies, helping to ensure accurate scheduling and on-time project delivery.
2. Critical Path Analysis:
AON diagrams play a key role in critical path analysis by identifying the longest sequence of tasks that define the project timeline highlighting essential tasks to prevent delays. Creately’s critical path software makes it easy to identify and optimize the critical path, helping project managers address dependencies early and keep projects on track.
3. Resource Allocation:
Efficient resource allocation can be achieved using AON diagrams to map out task timings and dependencies, ensuring optimal use of available resources.
4. Risk Management & Bottleneck Identification:
AON diagrams are valuable for risk management and bottleneck identification, enabling proactive identification of potential risks and delays by analyzing task dependencies and critical paths.
5. Complex Project Planning:
For complex project planning, AON diagrams simplify tasks by breaking down large projects into smaller, manageable parts, ensuring efficient planning and execution throughout the project.
6. Stakeholder Communication:
Effective stakeholder communication is made easier with AON diagrams, allowing project progress and task dependencies to be communicated clearly, ensuring alignment and understanding.
7. Process Optimization:
Use AON diagrams for process optimization by identifying inefficiencies in workflows and streamlining processes to enhance performance and productivity.
8. Agile Project Management:
AON diagrams support agile project management teams by mapping out iterative tasks and dependencies, fostering improved collaboration and flexibility in project execution.
9. Training & Education:
In training and education, AON diagrams are useful tools for teaching key project management concepts, especially in task sequencing, scheduling, and understanding task dependencies.
10. Software Development:
AON diagrams aid in software development by mapping out the entire software development life cycle, ensuring logical sequencing of activities like coding, testing, and deployment.
11. Product Development:
For product development, AON diagrams provide a visual roadmap, ensuring smooth transitions from conceptualization to launch and across various stages of the product lifecycle.
Incorporating AON Network Diagrams can streamline project execution, improve clarity, and enhance decision-making across various industries.
Benefits of AON Network Diagrams Over Other Network Diagrams
AON (Activity-on-Node) Network Diagrams offer several advantages over other types like AOA (Activity-on-Arrow) Network Diagrams. Here’s a breakdown of the key benefits:
Clear visualization of dependencies: Shows activities as nodes with arrows, making task relationships and potential delay impacts easy to understand.
Critical path identification: Helps quickly identify the critical path so teams can focus on high-impact tasks and manage bottlenecks more effectively than with AOA diagrams.
Simplified task sequencing: Breaks projects into clear activities and relationships, making execution order easier to follow.
Easy updates and collaboration: Allows quick adjustments to task durations and dependencies as projects change.
Better resource allocation: Visualizes task flow to ensure resources are available when and where they’re needed.
Improved stakeholder communication: Clearly presents timelines and dependencies, helping align teams and stakeholders.
Tool integration: Works well with Gantt charts and other project management tools for a complete project view.
Methodology flexibility: Supports both waterfall and agile project management approaches.
Why Choose Creately for Creating AON Network Diagrams
Creately provides everything you need to create, manage, and collaborate on AON network diagrams, combining intuitive diagramming, project management capabilities, and specialized network design tools in one platform. Here’s what you get.
Ease of Use & Speed
Intuitive diagramming interface: Drag-and-drop controls and smart connectors make creating AON network diagrams fast and easy.
Purpose-built templates: Start quickly with ready-made, fully customizable AON network diagram templates.
Project Planning & Control
Critical path automation: Automatically identify and visualize the critical path to prioritize high-impact tasks.
Project management software support: Creately’s project management software supports scheduling, resource allocation, and risk management by clearly exposing dependencies and bottlenecks.
Collaboration & Communication
Real-time collaboration: Teams can edit together, comment, and track changes instantly.
Clear stakeholder communication: Visual timelines and dependencies make project progress easy to explain and align.
Flexibility & Integration
Tool integration: Works seamlessly with Gantt charts and timelines for a complete project view.
Methodology flexibility: Supports both waterfall and agile project management approaches.
Design Quality & Accessibility
Smart formatting and styling: Automatic alignment and color coding keep diagrams clean and professional.
Cloud-based access: Create, edit, and share diagrams from any device.
Advanced & Specialized Use Cases
- Cisco network design support: Creately’s Cisco network design software enables precise visualization of complex network architectures and integrates smoothly with existing workflows.
Free AON Network Diagram Templates for Fast, Professional Network Design


AON (Activity-on-Node) Network Diagrams are essential tools for project managers, providing a clear and efficient way to visualize task dependencies, scheduling, and critical paths. By simplifying complex project tasks, AON project network diagrams help streamline decision-making, resource allocation, and risk management, ensuring projects stay on track and meet deadlines.
FAQs on Activity on Node Network Diagrams
Where are AON diagrams best applied?
What are best practices for AON diagram making?
How is an AON network diagram different from an AOA diagram??
Can AON network diagrams be updated as projects change?
Resources
Lu, Ming, and Hoi-Ching Lam. “Transform Schemes Applied on Non-Finish-To-Start Logical Relationships in Project Network Diagrams.” Journal of Construction Engineering and Management, vol. 135, no. 9, Sept. 2009, pp. 863–873, https://doi.org/10.1061/(asce)co.1943-7862.0000062.
Yang, Zhi-yong, and Zhuo-fu Wang. “Comparison between AON and AOA Network Diagrams.” IEEE Xplore, 1 Oct. 2010, https://ieeexplore.ieee.org/document/5646036.