April 1, 2026
External Data Integration, High-Performance Org Charts, Smart Alignment Guides, and More
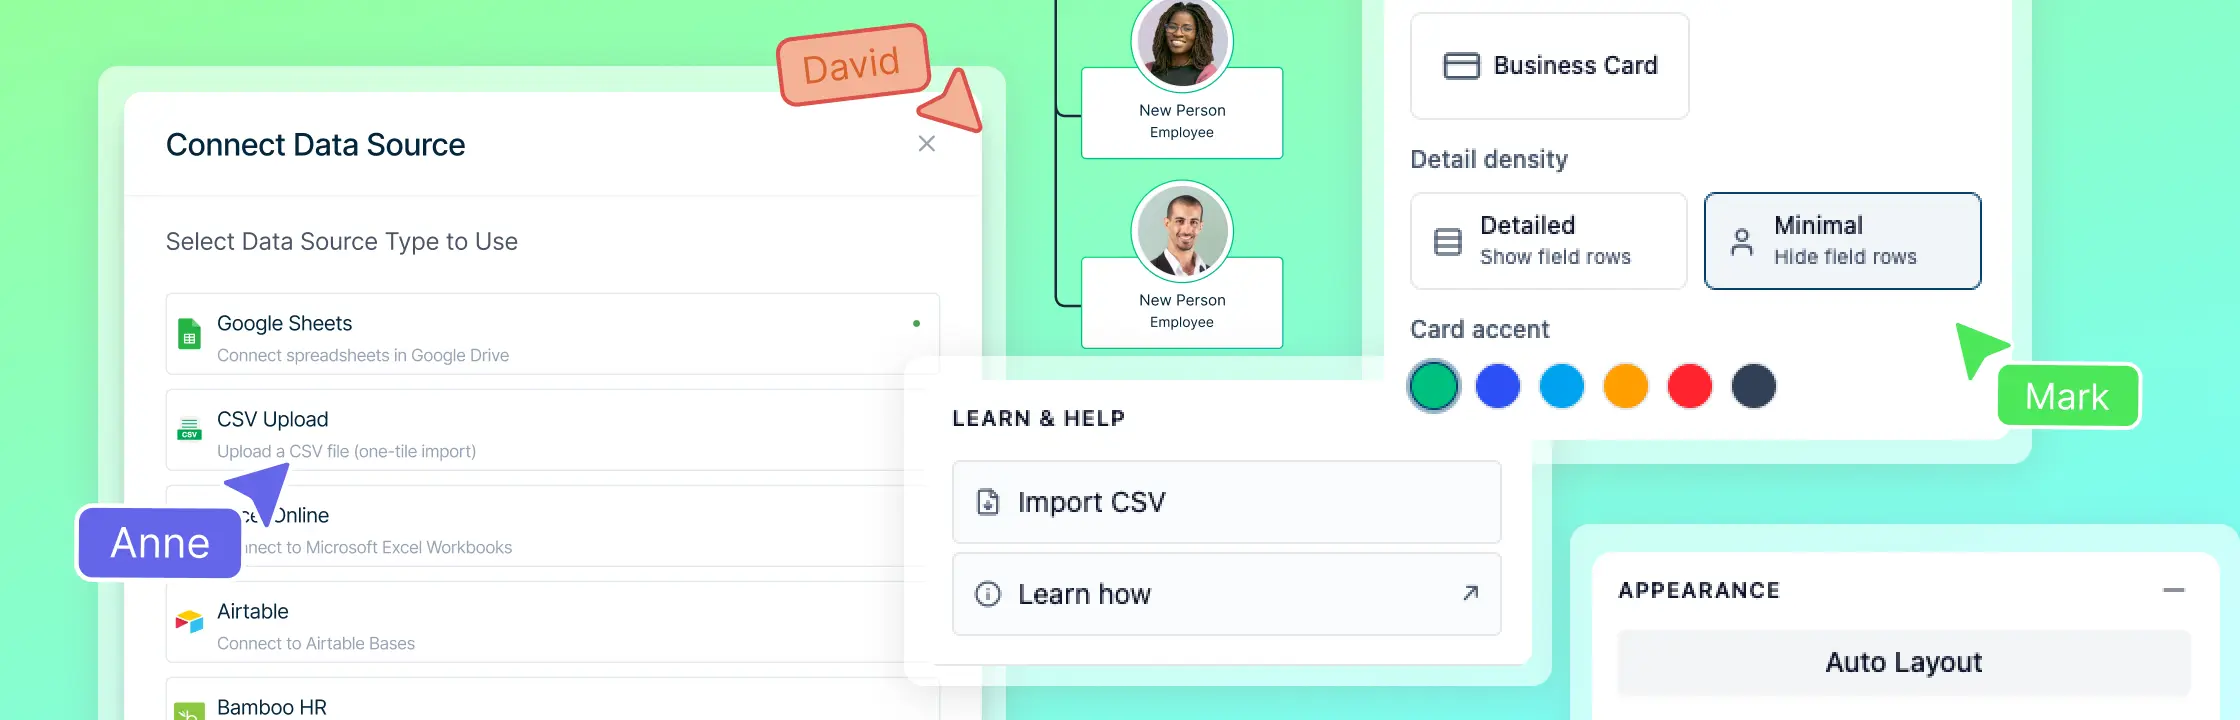
Centralized Process Management with External Data Integration
Connect your diagrams to a single source of truth with our new External Data Binding feature. You can now link shapes directly to a central process registry in Google Sheets or Microsoft Excel, ensuring that any update to your spreadsheet automatically reflects across every diagram. Simply designate a key column for stable IDs and map your data to specific shape properties. With the new “From Data” tab, you can drag records directly onto the canvas to create bound shapes that work even when you’re offline. Clear sync indicators and manual refresh options give you total control over your data, making it easier than ever to manage complex, enterprise-wide processes without manual updates.
Smoother Handling and Faster CSV Org Chart Imports for Large Teams
Working with massive datasets is now faster and more responsive than ever. When you import a large CSV—whether it’s 2,000 or 10,000+ rows—the app now prioritizes your immediate view using lazy loading, focusing on the top levels of your structure so you can start diagramming instantly without lag. To keep your workspace fluid, we’ve overhauled canvas movement, eliminating background stutter during panning and zooming. Even as your diagram grows, the interface remains perfectly responsive, allowing you to navigate through thousands of shapes and expand deep reporting branches with a buttery-smooth, professional feel.
Improved Reliability for Local Backups
We’ve significantly strengthened how your work is protected and restored. A new rolling local backup system now automatically saves your progress every two minutes and whenever you switch tabs, providing a dependable safety net if you ever lose your connection. We’ve also refined the version restore process to be more precise; whether you’re jumping back to a previous save or importing a backup file, the app now ensures a clean transition to that exact state without any overlapping data. These improvements, combined with smarter safeguards for large file processing, ensure your most complex diagrams remain accurate and secure.
Easier Access to Help While You Work
We’ve made it easier to find the guidance you need while building complex diagrams. The “Learn & Help” sections within the AI Org Chart and AI Process Mapping apps now link directly to their specific help center categories. Instead of starting at the help home page, you can now instantly access tailored tutorials and troubleshooting articles for the exact tool you are using, ensuring a faster and more supported workflow.
Precision Design with Smart Alignment Guides
Creating perfectly balanced diagrams is now faster and more intuitive. We’ve introduced dynamic alignment and distribution guides that appear instantly as you move, resize, or rotate shapes. These visual cues help you snap elements to the exact center or edges of nearby objects, ensuring your layout is always professional. Additionally, new spacing guides make it easy to maintain equal distances between multiple items, giving your work a polished, symmetrical look with zero manual effort.
Refined Interface and Workspace Navigation
We’ve polished the editor to keep your workflow fluid and focused. The canvas now stays centered on your active area when expanding or collapsing branches, and selecting search results highlights the correct shapes instantly. We’ve also improved menu behavior—selection dropdowns now close automatically after use, and we’ve ensured that all property panels and assistant tools are fully scrollable. Additionally, folder titles and AI status messages have been updated with clearer, more intuitive language to make navigating your dashboard and tools even simpler.
Advanced Org Chart Customization and Management
Customizing and maintaining complex team structures is now faster and more reliable. We’ve introduced batch styling, allowing you to switch card styles—like moving to a Photo Card view—instantly across thousands of shapes without any sync delays or lag. A new prompt also lets you choose whether to apply design changes to a single person or your entire team with one click. Additionally, our updated CSV import process ensures that re-uploading data accurately reflects your latest changes, while a smarter deletion tool now intelligently manages reporting sub-trees to keep your diagrams perfectly synced and tidy.
Improved Visual Consistency for Flowcharts
We’ve refined the dimensions and paths of our standard flowchart shapes to make building professional processes even easier. By correcting the default sizes and rescaling the underlying shape data, all elements now align perfectly with one another as you draw. Whether you’re connecting a decision diamond to a process square or a terminator, these updates ensure your flowcharts are naturally symmetrical and perfectly proportioned right out of the box.
A More Reliable Collaborative Editing Experience
We’ve restored full synchronization for shared diagrams to ensure a smooth, lag-free experience when working with your team. This update ensures that as soon as you open a shared project, you are instantly connected to the live session. We’ve eliminated delays in seeing updates from other contributors, making it easier than ever to brainstorm and build together in real-time.
Streamlined Genogram Dashboard and Onboarding
Organizing your workspace is now cleaner and more intuitive with a refreshed dashboard experience. We’ve introduced smart name validation for folders, providing instant feedback to help you stay within optimal character limits. To keep your library looking sharp, long project names now truncate neatly, and we’ve updated the folder menu icons to a sleek vertical design. Additionally, the Genogram dashboard now features tailored onboarding options—allowing you to jump directly to a blank canvas or start from a specific scenario—ensuring you can move from your dashboard to your first diagram with fewer clicks.
More Reliable Org Chart Exports and Dashboards
We’ve enhanced our export engine to ensure your downloaded diagrams perfectly match what you see on the screen. When exporting large Org Charts with collapsed branches, the “dot-grid” indicators and team member counts are now accurately preserved in your files, even for data that hasn’t been fully expanded on the canvas. We’ve also updated how standard shapes—like sticky notes and text—are handled during the export process to ensure they always render with high fidelity. Additionally, a small update to the dashboard ensures that all folder labels and record types are now correctly identified, making it easier to manage your growing library of projects.
Improved Property Editing Controls
We’ve updated the properties panel to ensure your editing tools are always within reach. The “Edit” and “Done” controls are now pinned to the top of the panel, so they stay visible even when you are scrolling through long lists of details or expanding multiple sub-sections. This small but impactful change means you can quickly save your changes or toggle into edit mode without having to scroll back to the top of the panel, making fine-tuning your diagram data a much more efficient experience.
Improved Accuracy and Consistency in AI‑Generated Org Charts
We’ve significantly improved how the AI Org Chart Assistant handles complex updates and new scenarios. Previously, adding large departments or moving multiple roles could sometimes lead to overlapping shapes or misaligned layouts. With this update, the AI now intelligently calculates spacing during previews to ensure your diagram remains clean and professional. We’ve also resolved issues where new nodes would occasionally lose their positioning after refreshing or forking a diagram; now, every change is perfectly preserved and accurately reflected in your team counts, ensuring a seamless transition from AI suggestions to your final masterpiece.