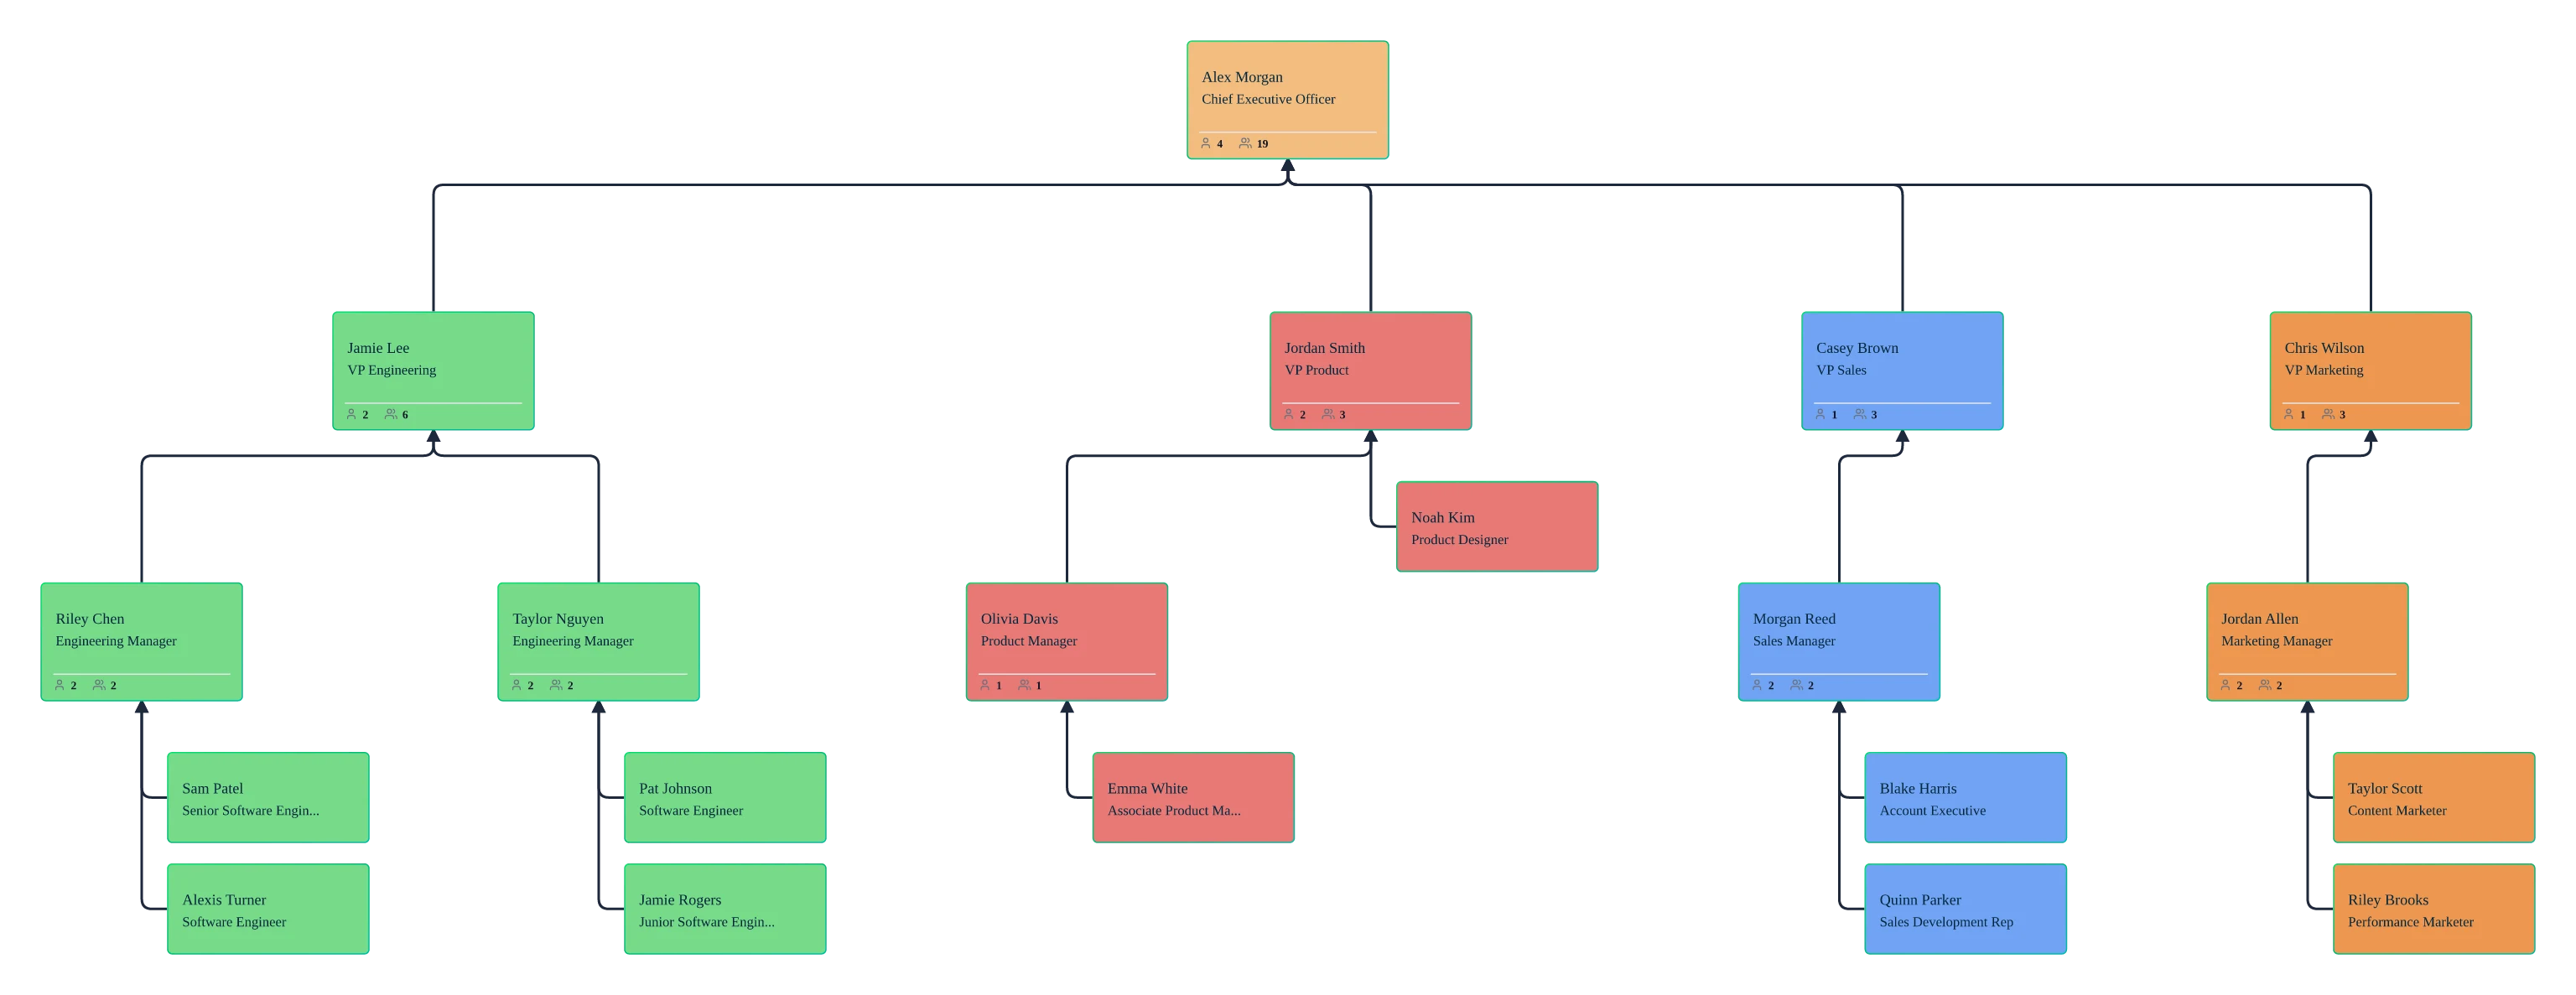
Visualize your evolving structure - See how headcount, roles, and reporting lines fit together as your team grows, without losing the visual context of your existing hierarchy.
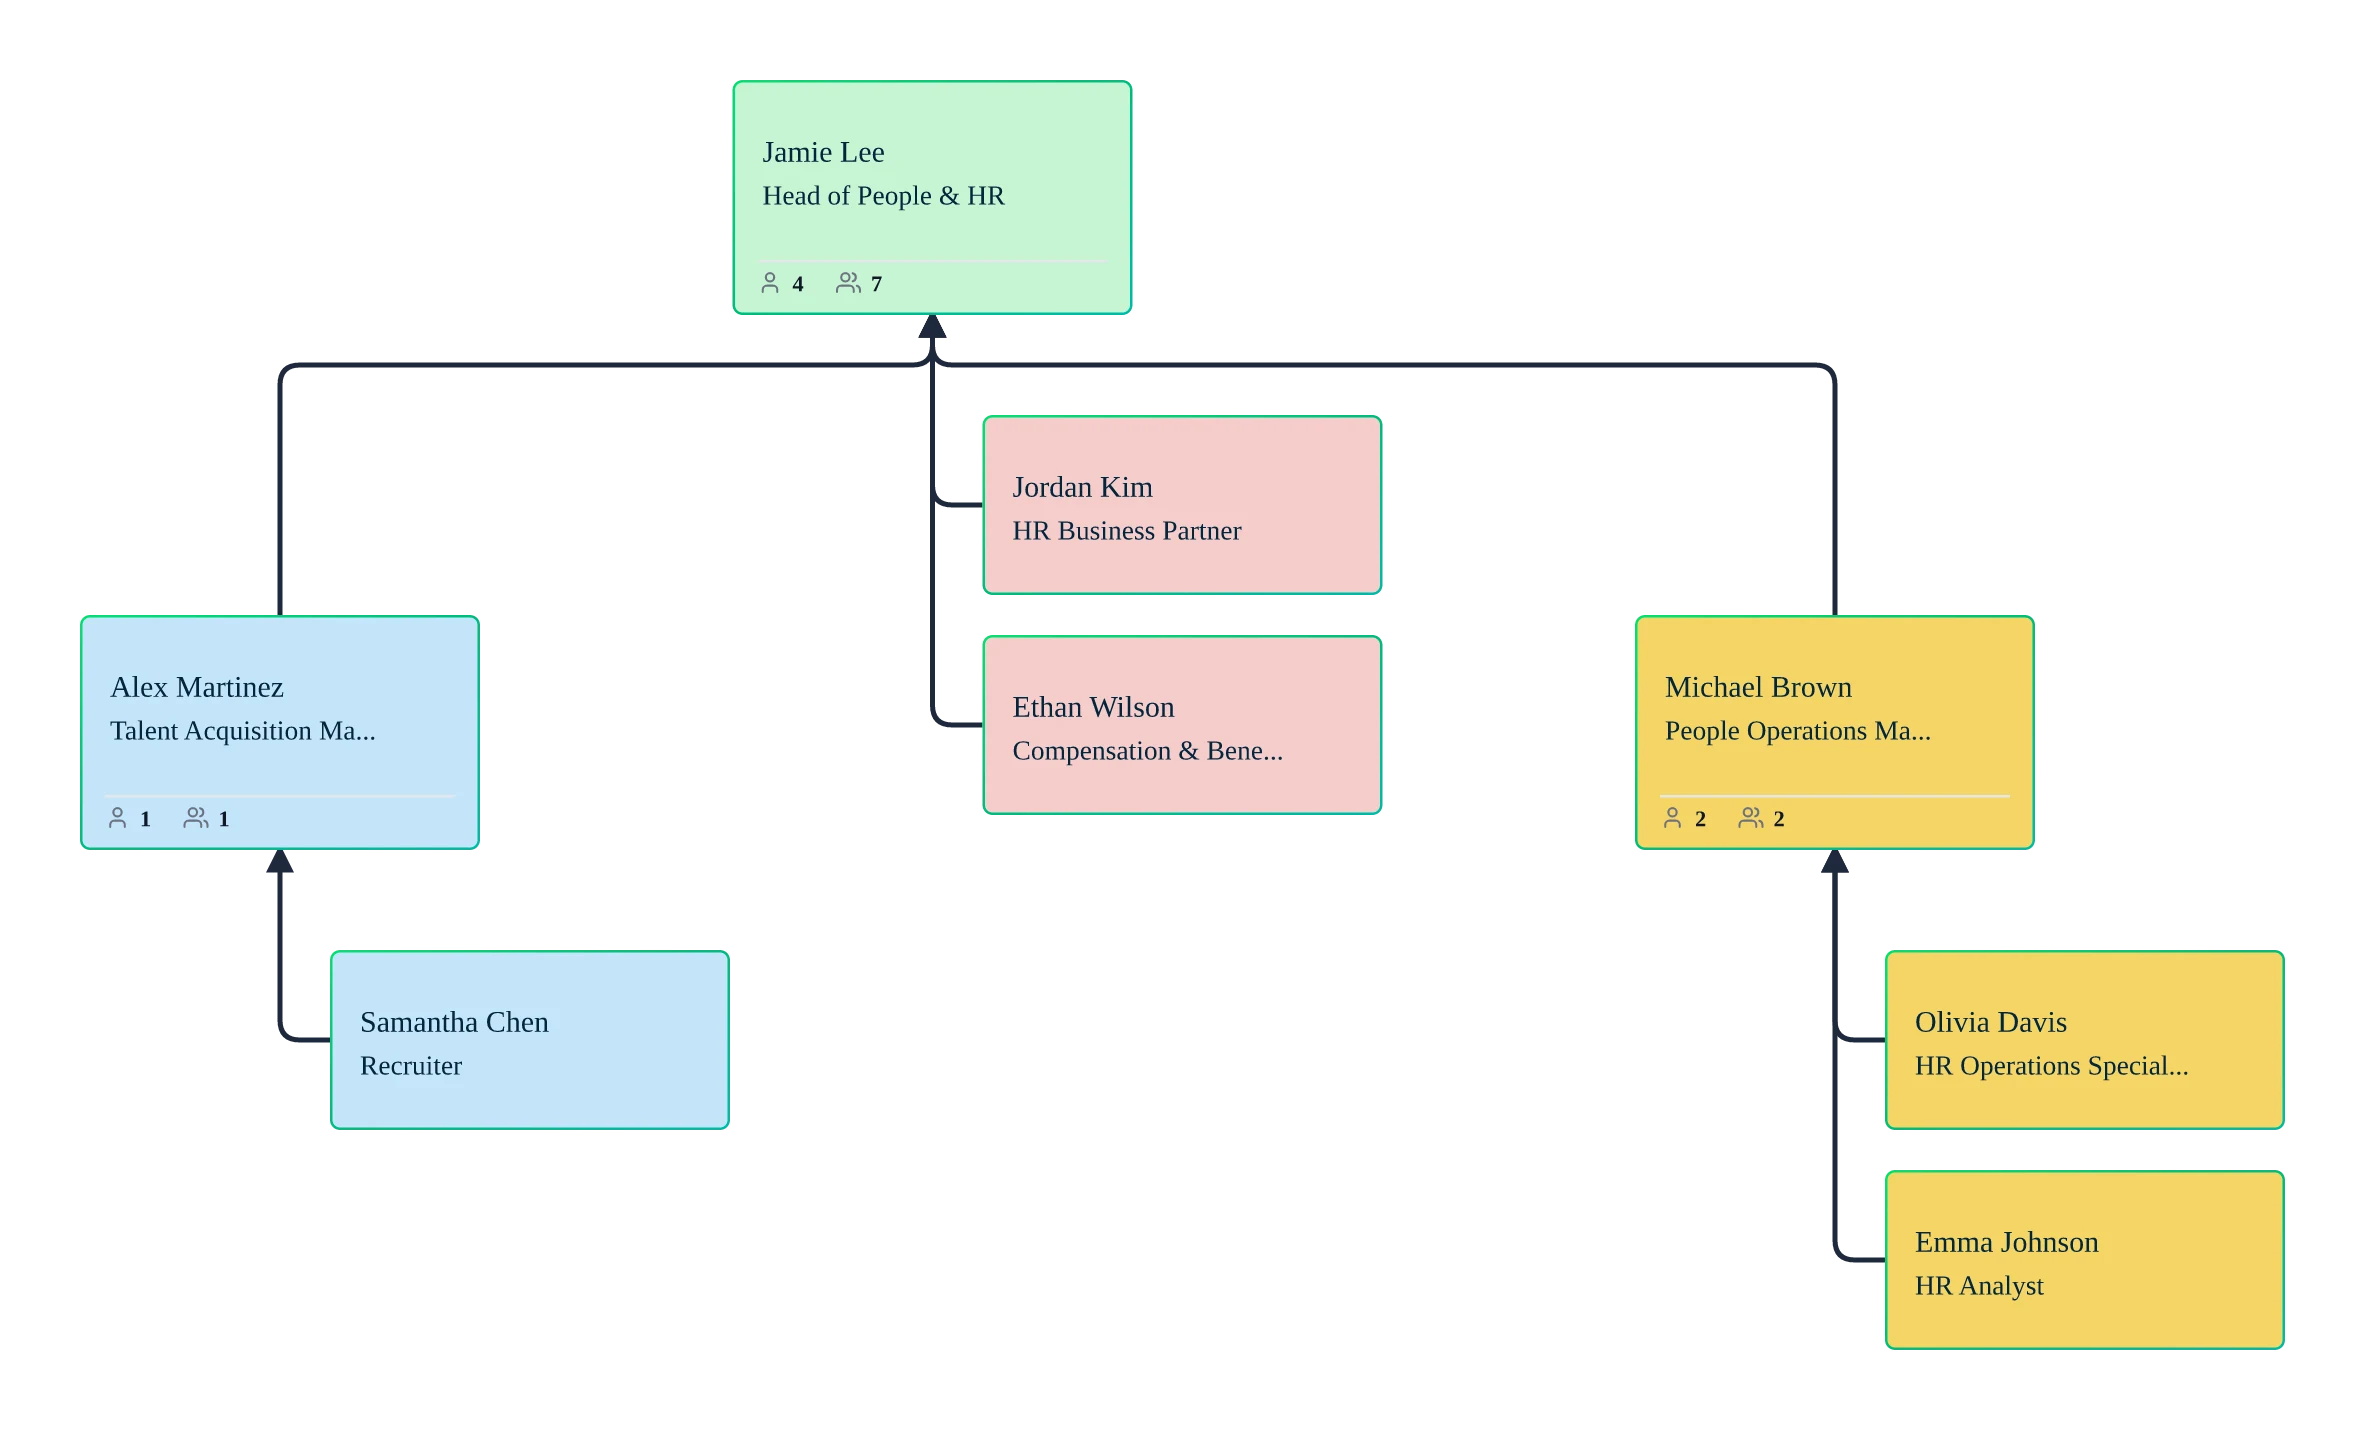
Architect future-ready teams - Help stakeholders instantly see how new departments, matrix teams, and dotted-line roles will evolve within your future workforce structures.
Model changes without the risk - Test high-stakes scenarios for hiring, attrition, and reorgs in a safe sandbox, using data-backed visuals to compare outcomes before you commit.
CERTIFIED
Workforce Planning Org Chart Software
Build a Data-Rich Org Chart for Smarter Growth with Intelligent Workforce Planning Software
Turn your static hierarchy into a dynamic planning workspace. Creately’s workforce planning org chart maker connects your HR data to a visual workspace, allowing you to model growth, visualize talent gaps, and restructure with confidence.
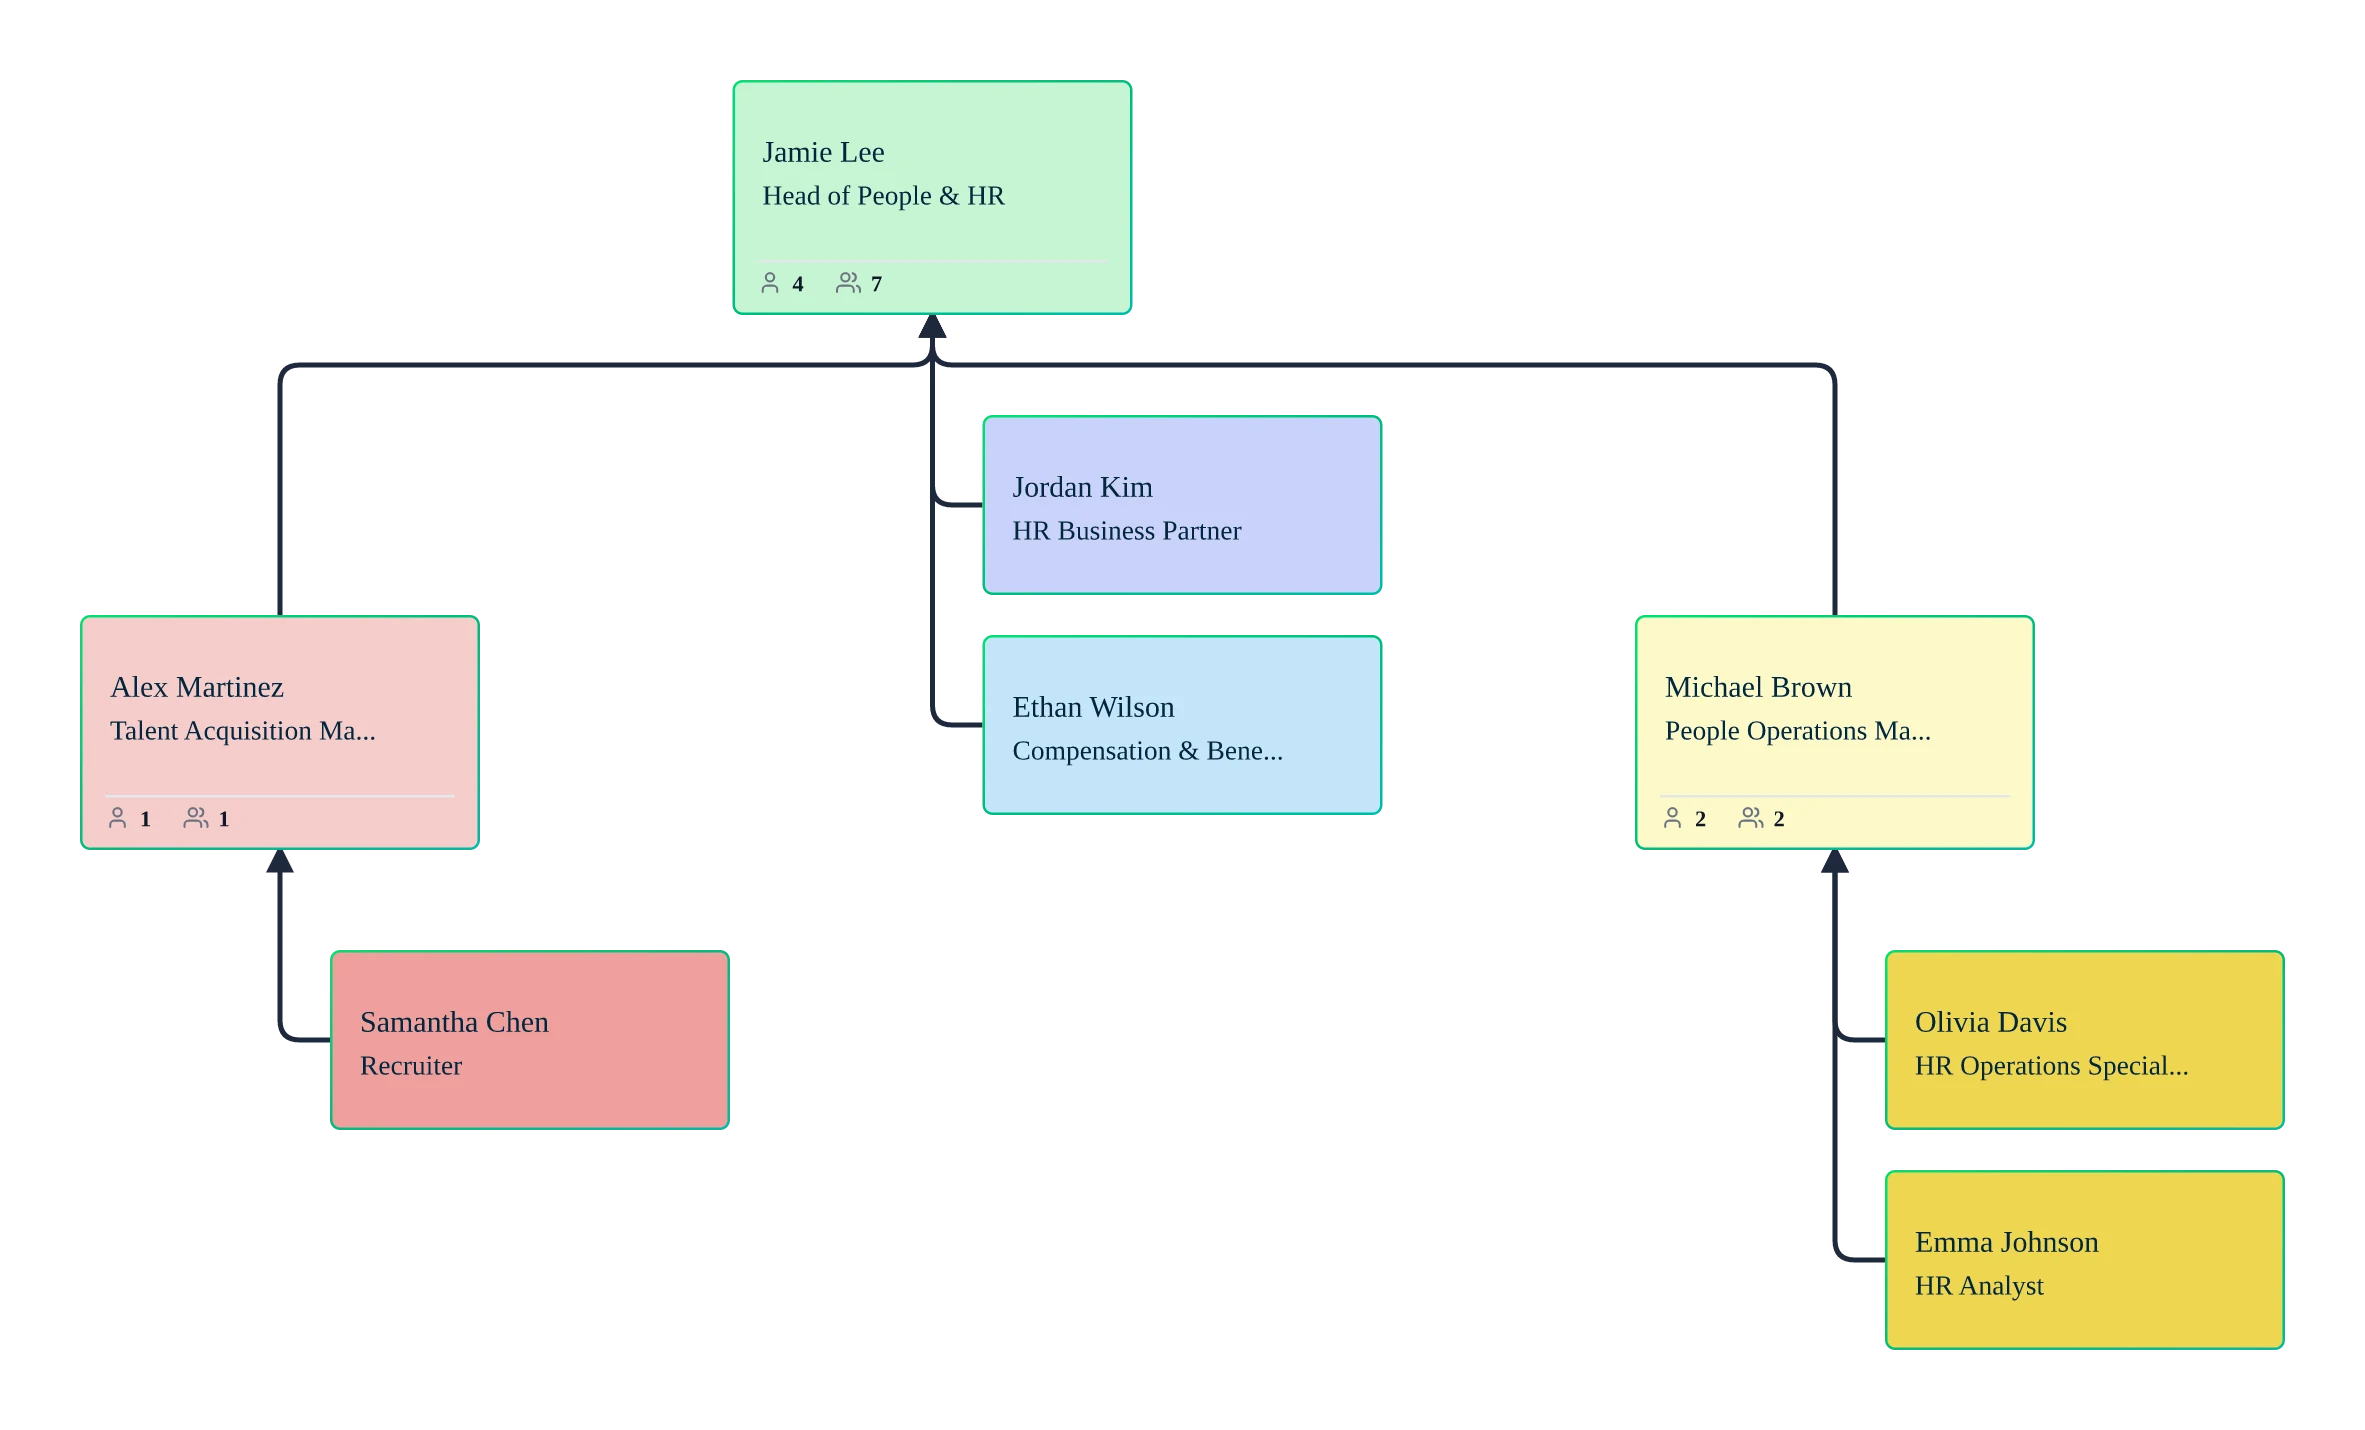
![]() Visualize your evolving structure
Visualize your evolving structure
See how headcount, roles, and reporting lines fit together as your team grows, without losing the visual context of your existing hierarchy.
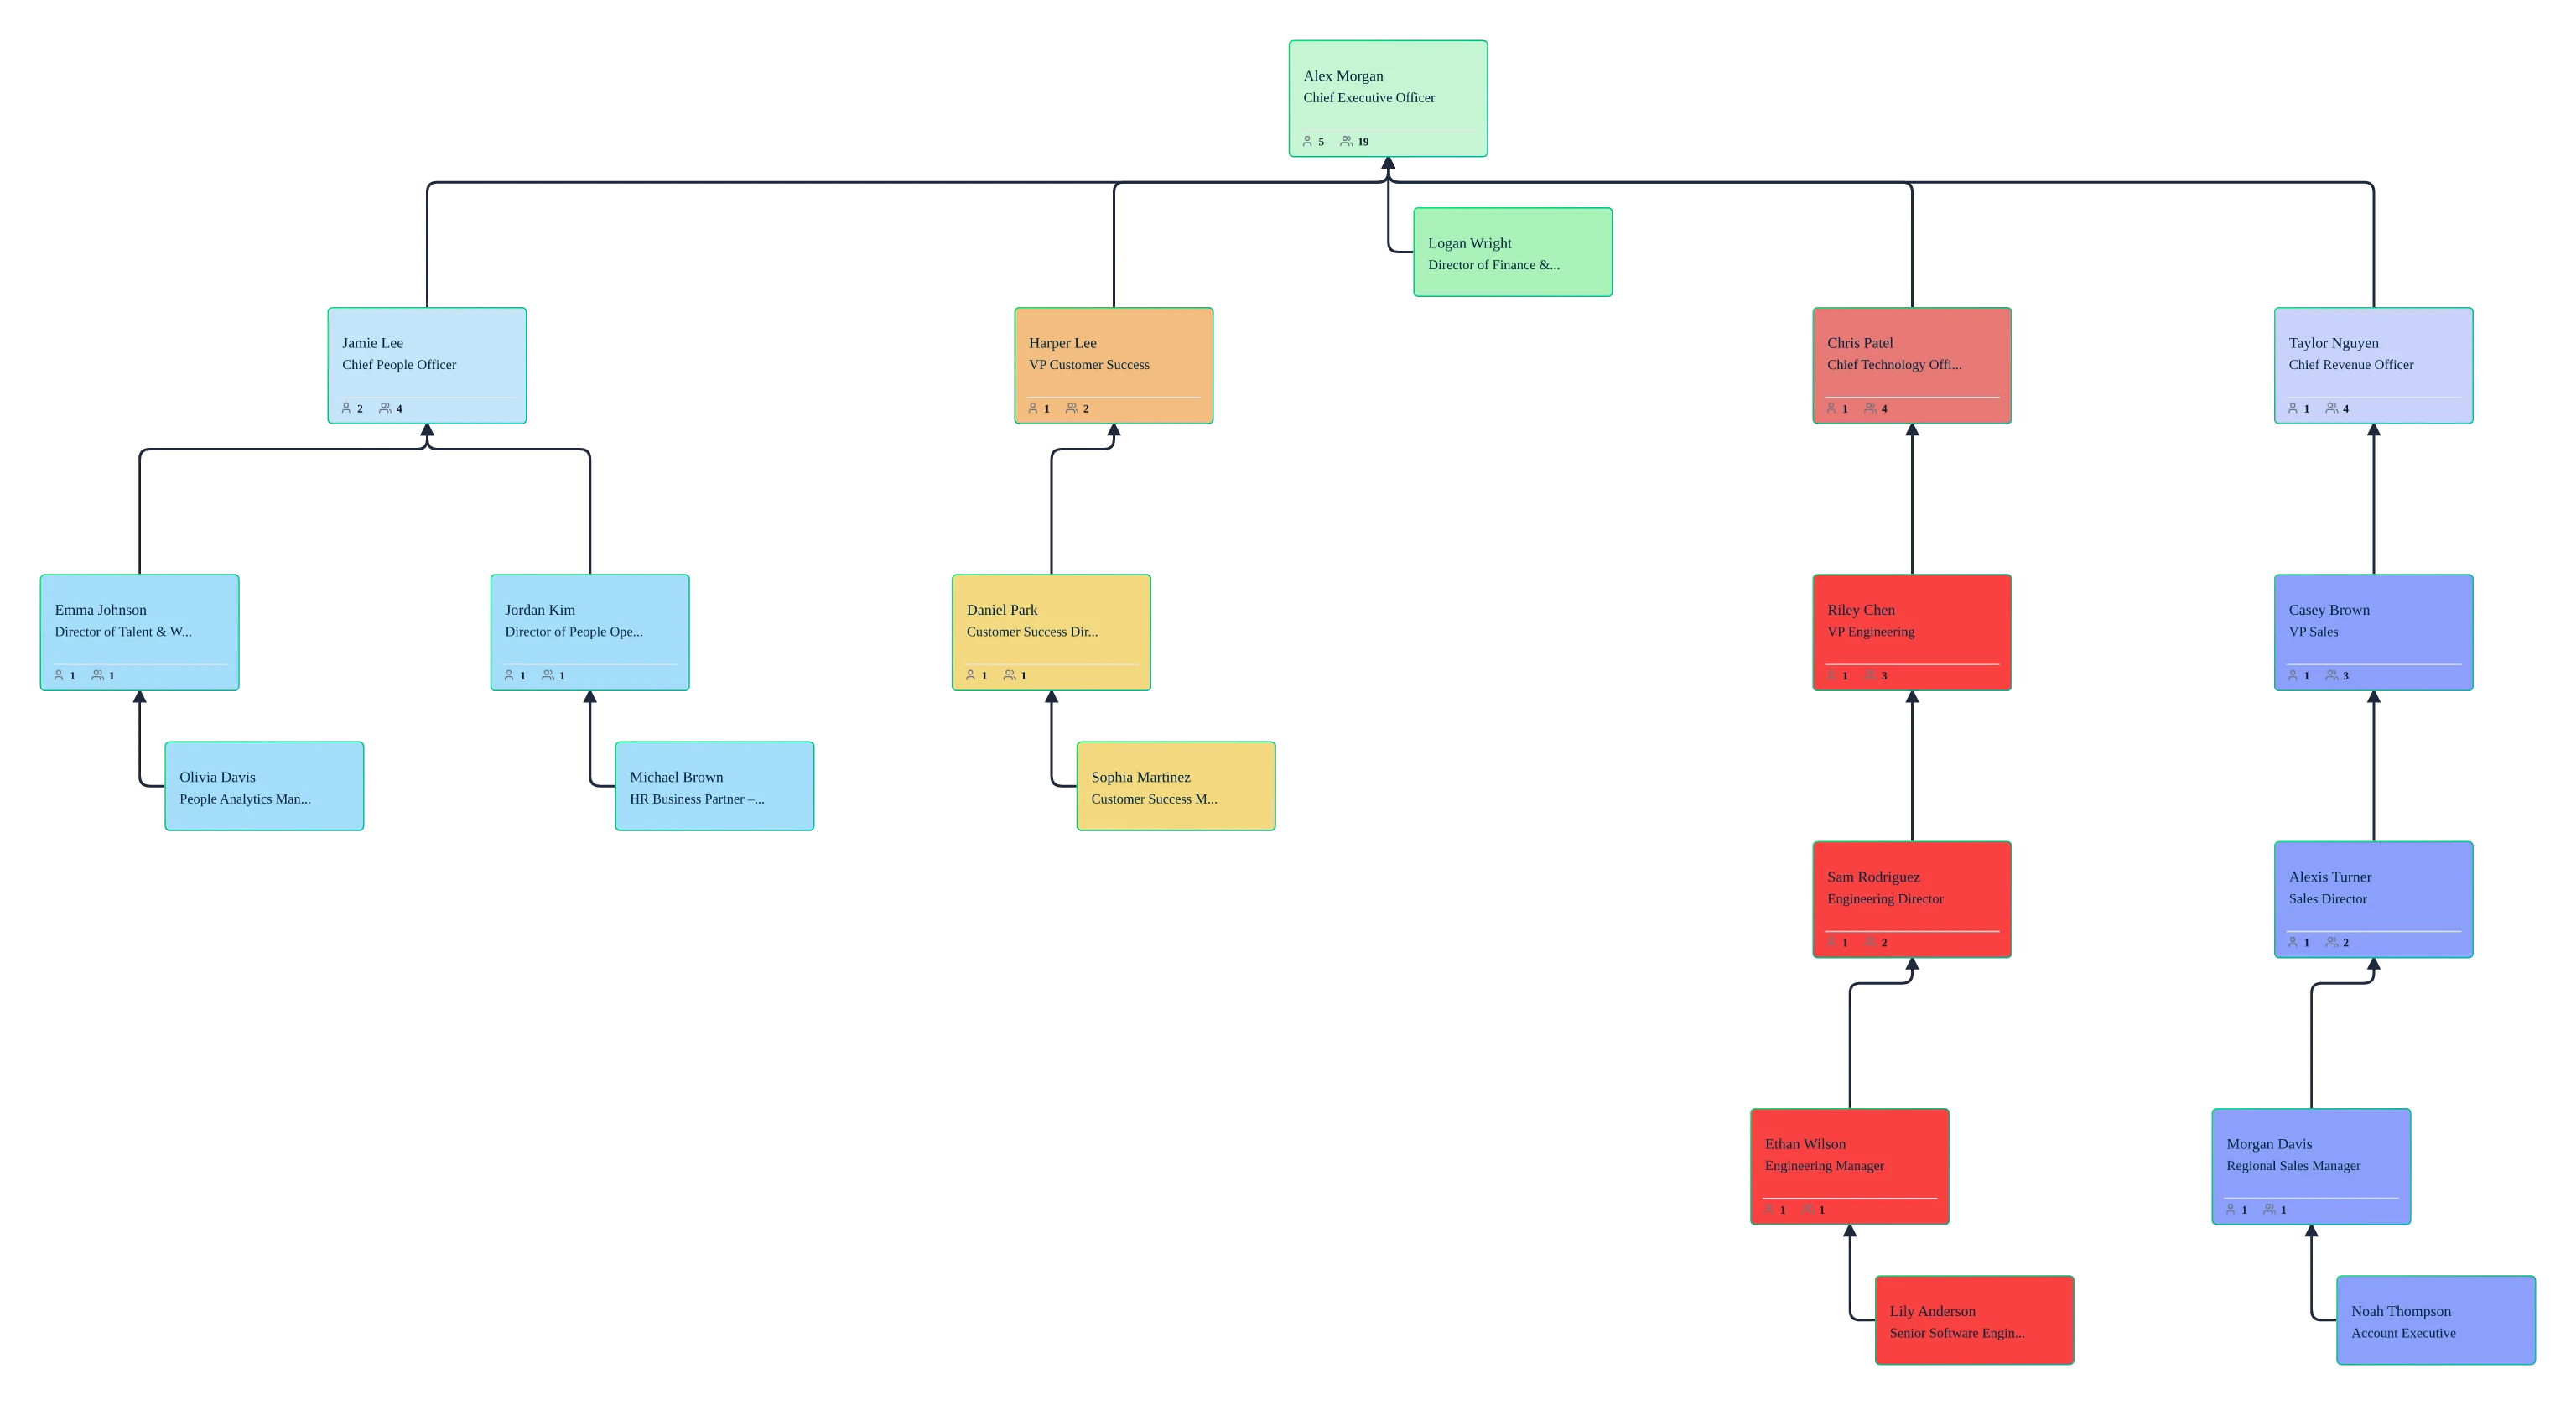
![]() Architect future-ready teams
Architect future-ready teams
Help stakeholders instantly see how new departments, matrix teams, and dotted-line roles will evolve within your future workforce structures.
![]() Model changes without the risk
Model changes without the risk
Test high-stakes scenarios for hiring, attrition, and reorgs in a safe sandbox, using data-backed visuals to compare outcomes before you commit.


 Diagramming Visual Collaboration Org Chart


Why Choose Creately for Workforce Planning Org Charts

AI-Powered Org Intelligence
Ask natural-language questions like 'Which teams have the widest span of control?' and get instant visual answers directly on your org chart.

Smart Import & Data Validation
Import from CSV or Excel with an AI wizard that maps columns automatically. It proactively flags 'orphaned nodes' and missing data before your plan goes live.

Instant Visual Analytics Presets
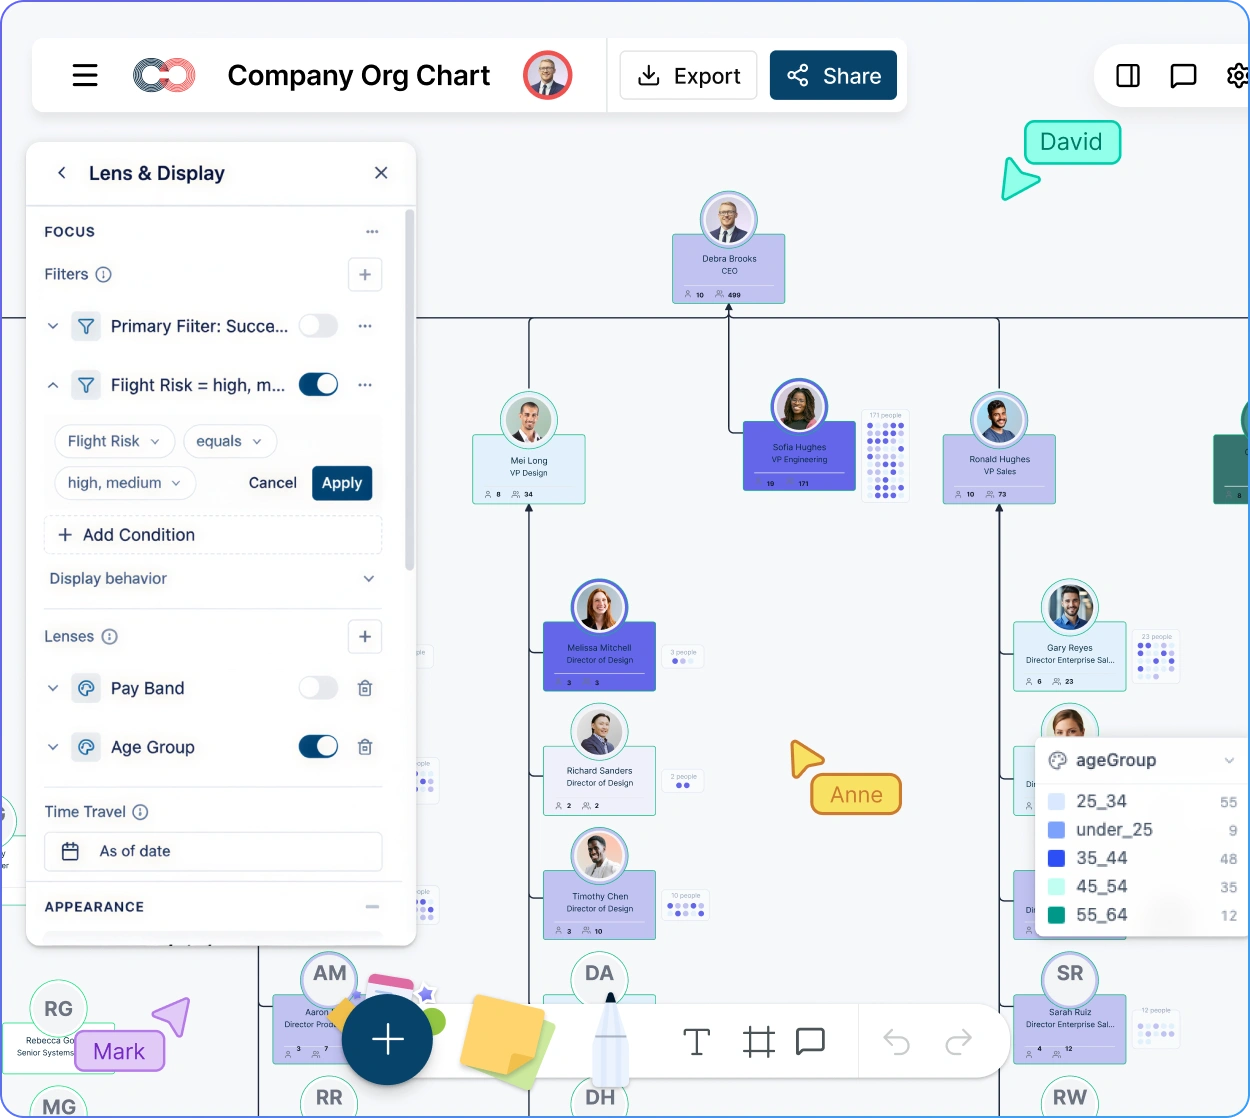
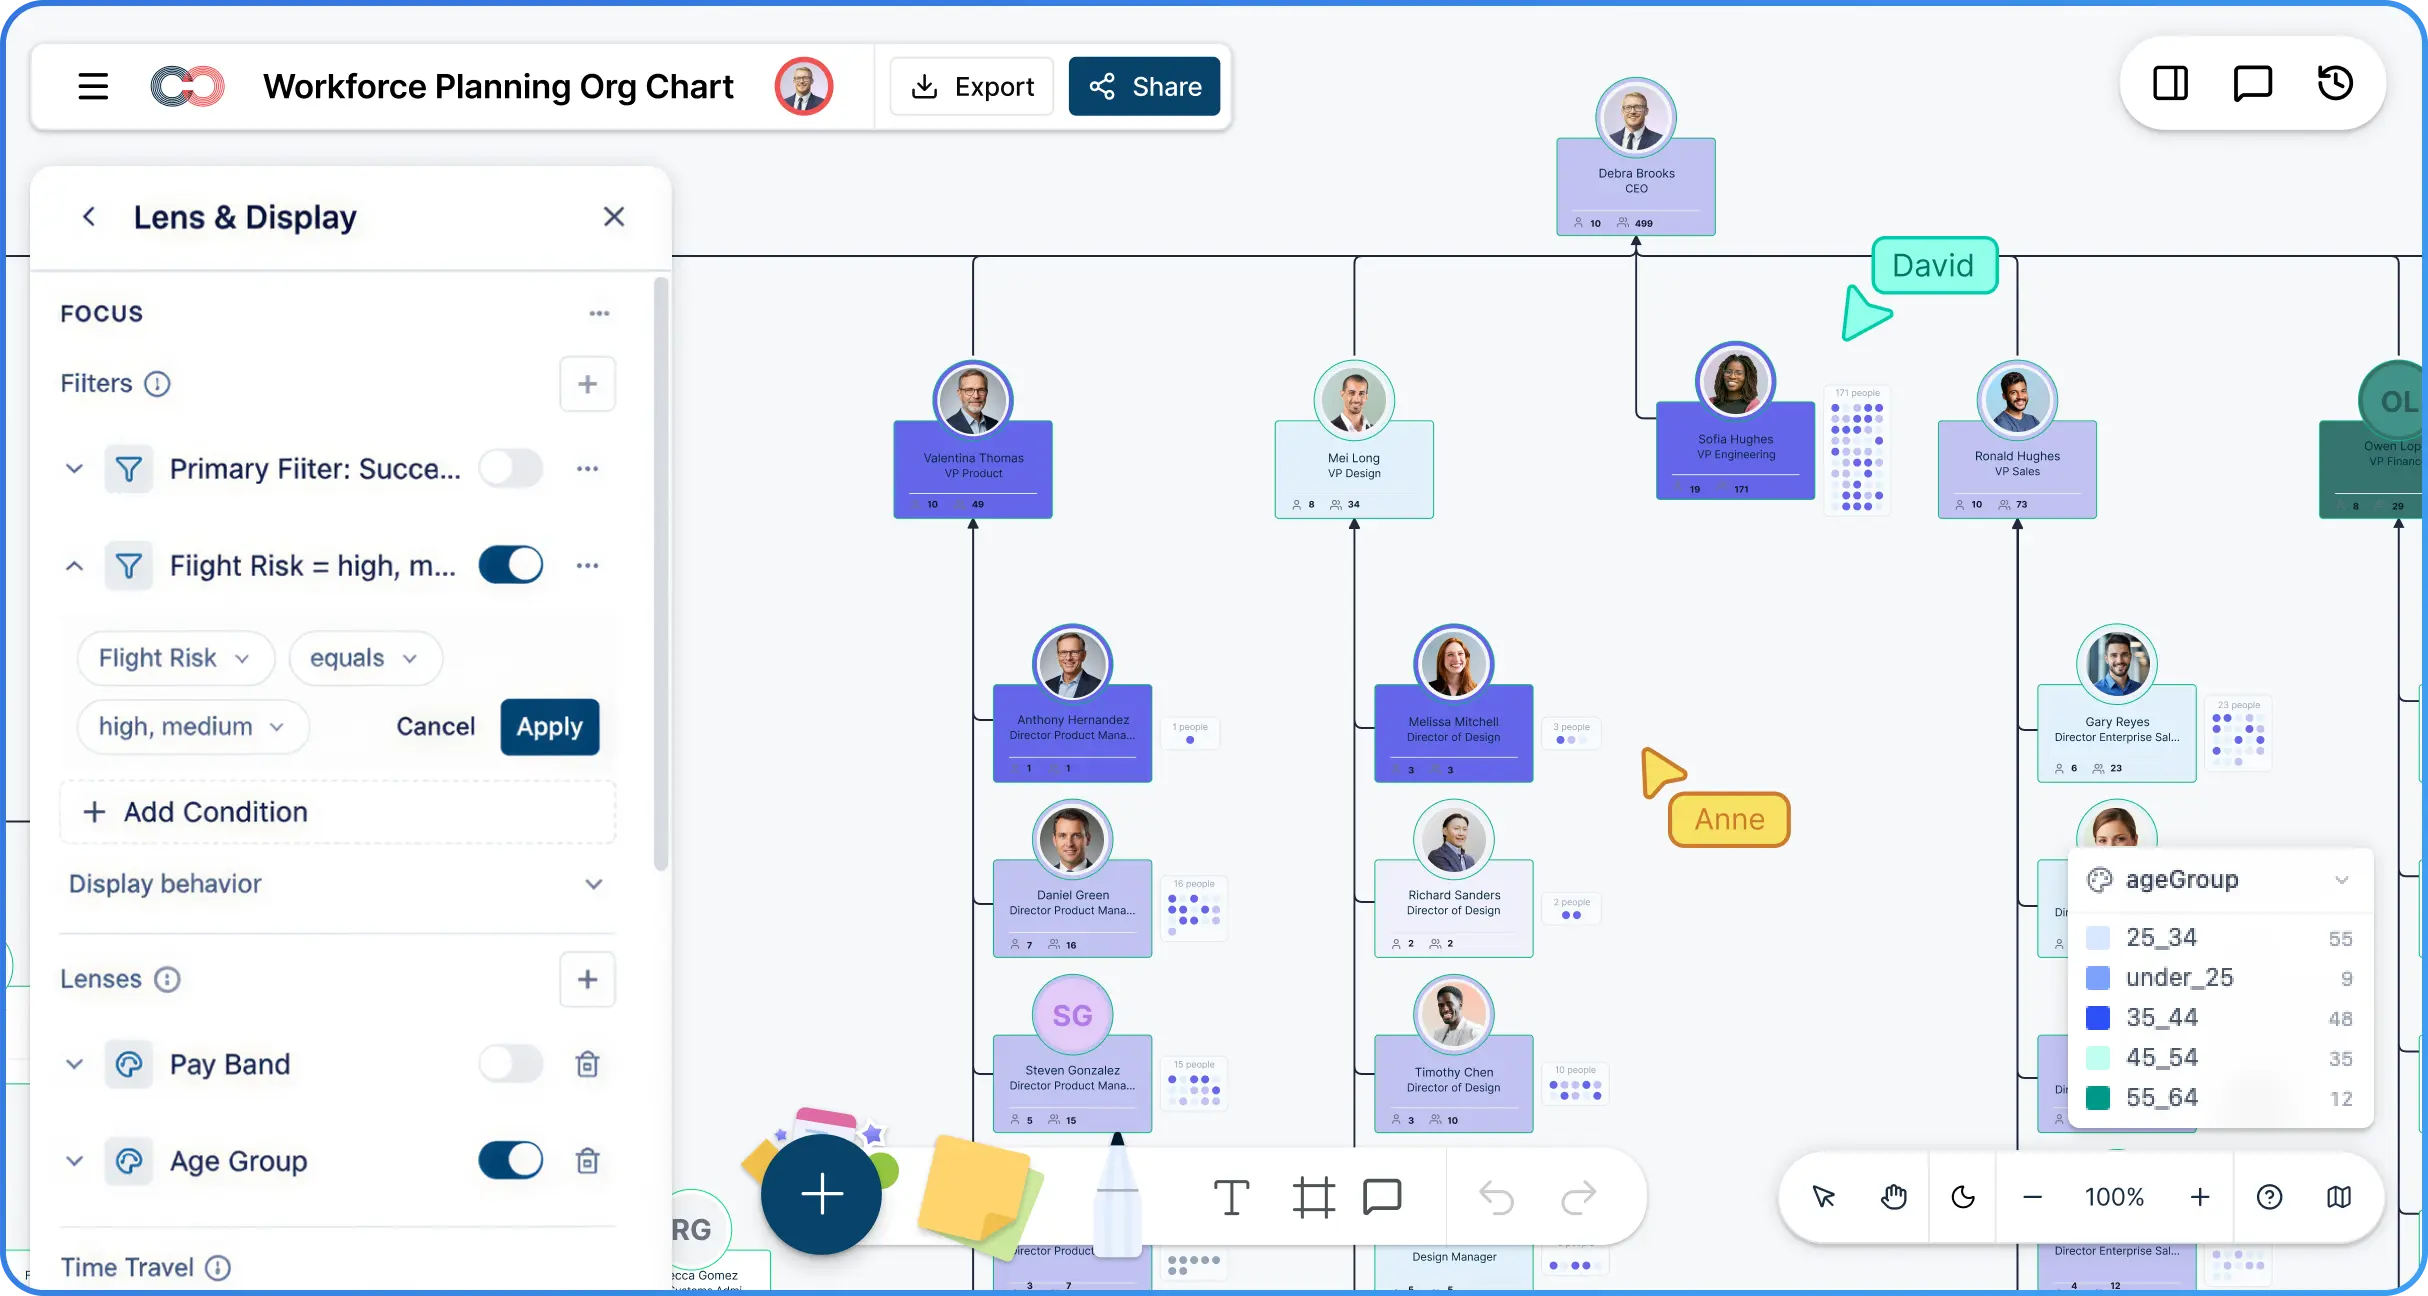
Apply one-click 'lenses' to visualize Span of Control, Tenure, and Flight Risk. Use heatmaps to see how performance and compensation align with your growth.

Secure Scenario Modeling
Create private 'what-if sandboxes' to model reorgs and hiring sprints. Compare different structural versions side-by-side without affecting your current live chart.

Future-State Role Mapping
Add vacant and planned positions directly into your hierarchy. Visualize your hiring roadmap and capacity needs within the context of your existing teams.

Multi-Tier Data Sensitivity
Protect PII and compensation data with a 6-tier security model. Give planners the structural insights they need while keeping sensitive HR details strictly confidential.
Architect Your Workforce Plan with Data-Driven Precision

Accelerate setup with intelligent data mapping. Import your structure directly from CSV, Excel, or Google Sheets. The AI-powered wizard automatically maps your data fields, identifies reporting lines, and flags “orphaned nodes” to ensure your baseline is 100% accurate before you start planning.
Design future-state roles in seconds. Effortlessly add vacant positions and planned headcount to your hierarchy. Use the quick-add interface to build out entire departments or insert individual roles into existing teams to visualize growth trajectories.
Map complex, real-world relationships. Define matrix structures, dotted-line reporting, and cross-functional project teams with 17 distinct relationship types that reflect how your organization actually operates.
Maintain clarity with automated layouts. As you model hiring surges or department mergers, the software’s automatic layout engine keeps your workspace clean and readable. Focus on your headcount strategy instead of manual box-shuffling.

Turn Structural Complexity into Actionable Insight
Diagnose structures with conversational AI. Skip the manual audits. Use the AI assistant to instantly highlight “wide spans of control” or identify “single points of failure” within your org chart to ensure your workforce plan is balanced and resilient.
Apply multi-dimensional data lenses. Gain immediate clarity by toggling “Field Packs” for talent, cost centers, or tenure. Transform your chart into a heatmap to visualize compensation distribution or performance clusters across different business units.
Predictive flight risk & succession mapping. Use visual indicators to identify high-potential employees and roles at risk. This allows you to build proactive hiring roadmaps and internal mobility plans directly within your visual workspace.
Time-travel through org evolution. Toggle between historical, current, and future-state views. Reviewing past growth patterns helps you make more informed decisions about future resource allocation and departmental scaling.
Transform Your Static Data into Strategic Intelligence

Universal data integration. Connect your workforce planning to the ground truth. Import seamlessly from CSV and Excel, or connect with HRIS platforms. Our AI-driven mapping ensures your headcount data and cost centers are perfectly synchronized without manual entry.
Extensive field customization to go beyond names and titles. Manage up to 201 distinct data points—from compensation and performance ratings to specialized skill inventories. Use these “Field Packs” to turn your org chart into a multi-dimensional database for gap analysis and resource planning.
Automated data hygiene. Let AI do the auditing. The software proactively scans your data to surface missing titles, unassigned departments, or “orphaned” roles. This ensures your workforce planning organizational chart is always built on a foundation of clean, validated information.
Dynamic data lenses. Instantly pivot your view based on the task at hand. Toggle between “Talent,” “Compensation,” or “Demographics” lenses to see your organization through different strategic filters, allowing for faster decision-making and more accurate headcount modeling.

Strategic Planning with Enterprise-Grade Protection
6-Tier sensitivity framework to manage high-stakes data like compensation, performance ratings, and PII with total confidence. Our granular permission model ensures that sensitive details are only visible to authorized HR leadership and legal teams.
Create named “what-if” scenarios in a secure environment. Model sensitive reorganizations, merit cycles, or downsizing plans without affecting the live organizational chart or alerting the broader company.
Use field packs, sensitivity levels, and role‑based sharing to ensure users only see the data relevant to their responsibilities. Sensitive fields like compensation and risk indicators are protected by a multi‑tier access model, while inactive field packs and dependent views remain hidden to prevent unnecessary exposure.
The software proactively surfaces missing critical fields or data discrepancies, ensuring your workforce plans are built on a foundation of secure, verified, and high-quality HR information.
Align Your Stakeholders Around a Shared Vision

Bring HR, Finance, and Department heads into a single workspace. Collaborate in real-time to model headcount changes, ensuring everyone is aligned on budget impact and structural shifts from the start.
Auto-generate “sub-diagrams” for specific managers or HR Business Partners. These views lazily hydrate from the parent chart, allowing stakeholders to manage their specific subtree without exposing the entire organization.
Turn your workforce plans into presentation-ready assets. Export high-resolution charts for board meetings or share live, read-only links to keep executive leadership updated on the latest hiring roadmap.
Use comments and mentions to discuss specific role changes or talent gaps directly on the chart. Centralizing feedback within the workspace eliminates long email chains and ensures no strategic detail is lost.
How to Build a Workforce Planning Org Chart with Creately
Sync your data using the AI-powered CSV import wizard.
Layer future-state vacancies directly onto your visual hierarchy.
Architect restructuring plans in a private scenario sandbox.
Run structural diagnostics using one-click visual presets.
Distribute synced department views with 6-tier sensitivity controls.
Jumpstart Your Strategy with Free Workforce Planning Org Chart Templates
Use Cases
Dynamic Headcount Planning
Visualize your entire hiring roadmap by adding planned roles and vacancies directly to your existing structure to see how new hires impact your budget and team balance.
Seamless Organizational Restructuring
Model complex reorgs and departmental shifts in a private sandbox to compare different structural outcomes before committing to any real-world changes.
Automated Span of Control Analysis
Use AI-powered diagnostics to instantly identify overstretched managers and unbalanced teams, allowing you to optimize reporting lines for better operational efficiency.
Strategic Succession Mapping
Identify high-potential talent and critical “single points of failure” within your org chart to build robust internal pipelines and reduce leadership risk.
Real-Time Labor Cost Visualization
Overlay compensation data and cost centers onto your visual hierarchy to understand the financial footprint of your workforce and make data-backed resource decisions.
Cross-Functional Matrix Modeling
Map out dotted-line reporting and project-based structures to see how your people actually collaborate across traditional departmental silos.
FAQs About the Workforce Planning Org Chart Creator
What are Creately’s workforce planning org chart software pricing plans?
- Free Plan — $0/month for basic workforce planning org chart creation and collaboration
- Starter & Team Plans — $8/month or $5/month billed annually
- Business Plan — $149/month or $89/month billed annually
Annual billing helps you save more while unlocking advanced collaboration, workspace management, and enhanced workforce planning org chart features. You can compare all available plans and features on the Creately Pricing Page.
How can you create workforce planning org charts faster?
Are there templates for different workforce planning org chart use cases?
Can teams collaborate on workforce planning org charts?
Can I add notes, data, and files?
Can I share, present, or export workforce planning org charts?


Model high-stakes hiring and restructuring scenarios with confidence—and keep your structural plans perfectly aligned as your business scales.
 Instant replies
 Org chart guidance
 Real human support