Manager load is hard to spot in spreadsheets - Visualize reporting lines and quickly identify managers with too many or too few direct reports.
Org design questions take too long to answer - Use AI to explore teams, surface structural issues, and get answers faster.
Reorg decisions feel risky without a clear before-and-after - Test changes in scenarios first, compare options visually, and update the live org only when ready.
CERTIFIED
Span of Control Analysis Tool
Analyze Span of Control and Org Structure More Clearly
Turn complex reporting structures, overloaded managers, and unclear team design into a visual org chart you can actually analyze. With Creately’s Span of Control Software, you can map reporting lines, identify where spans are too wide or too narrow, explore structural changes, and keep one shared view of your organization as it evolves.
![]() Manager load is hard to spot in spreadsheets
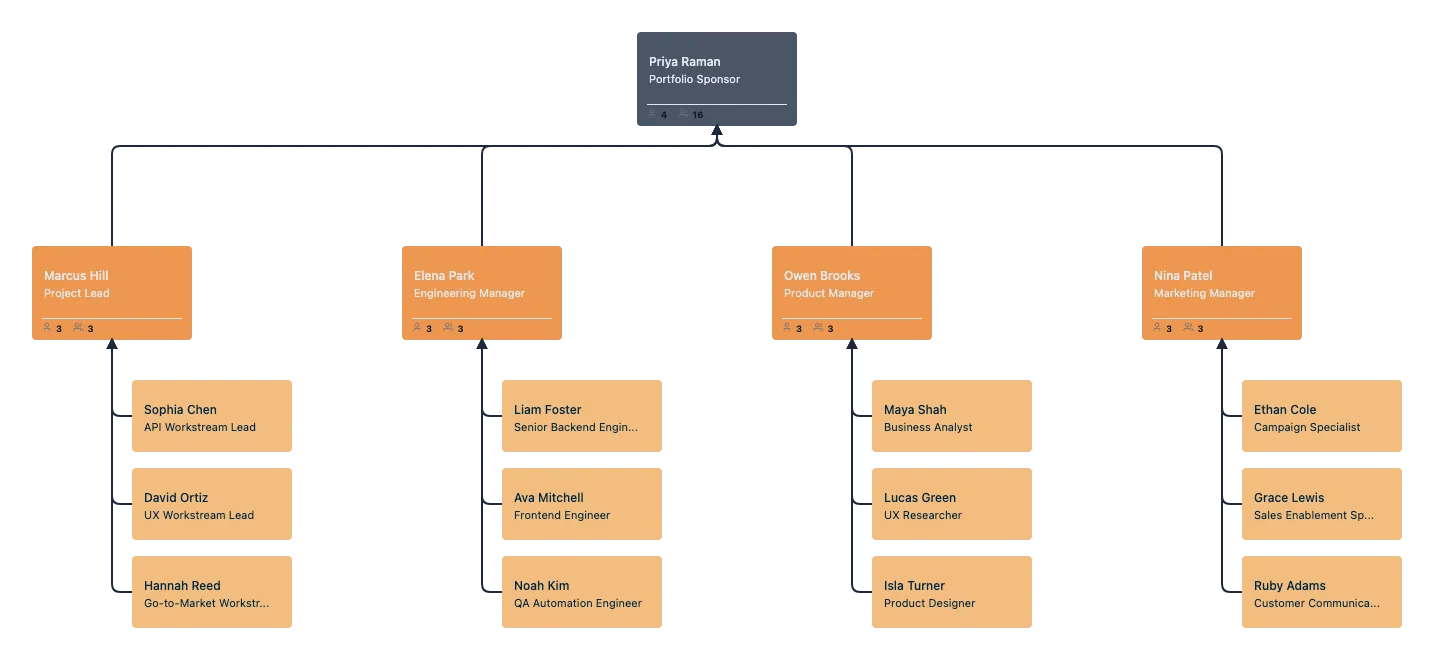
Manager load is hard to spot in spreadsheets
Visualize reporting lines and quickly identify managers with too many or too few direct reports.
![]() Org design questions take too long to answer
Org design questions take too long to answer
Use AI to explore teams, surface structural issues, and get answers faster.
![]() Reorg decisions feel risky without a clear before-and-after
Reorg decisions feel risky without a clear before-and-after
Test changes in scenarios first, compare options visually, and update the live org only when ready.


 Diagramming Visual Collaboration Org Chart


Why Choose Creately for Span of Control Analysis

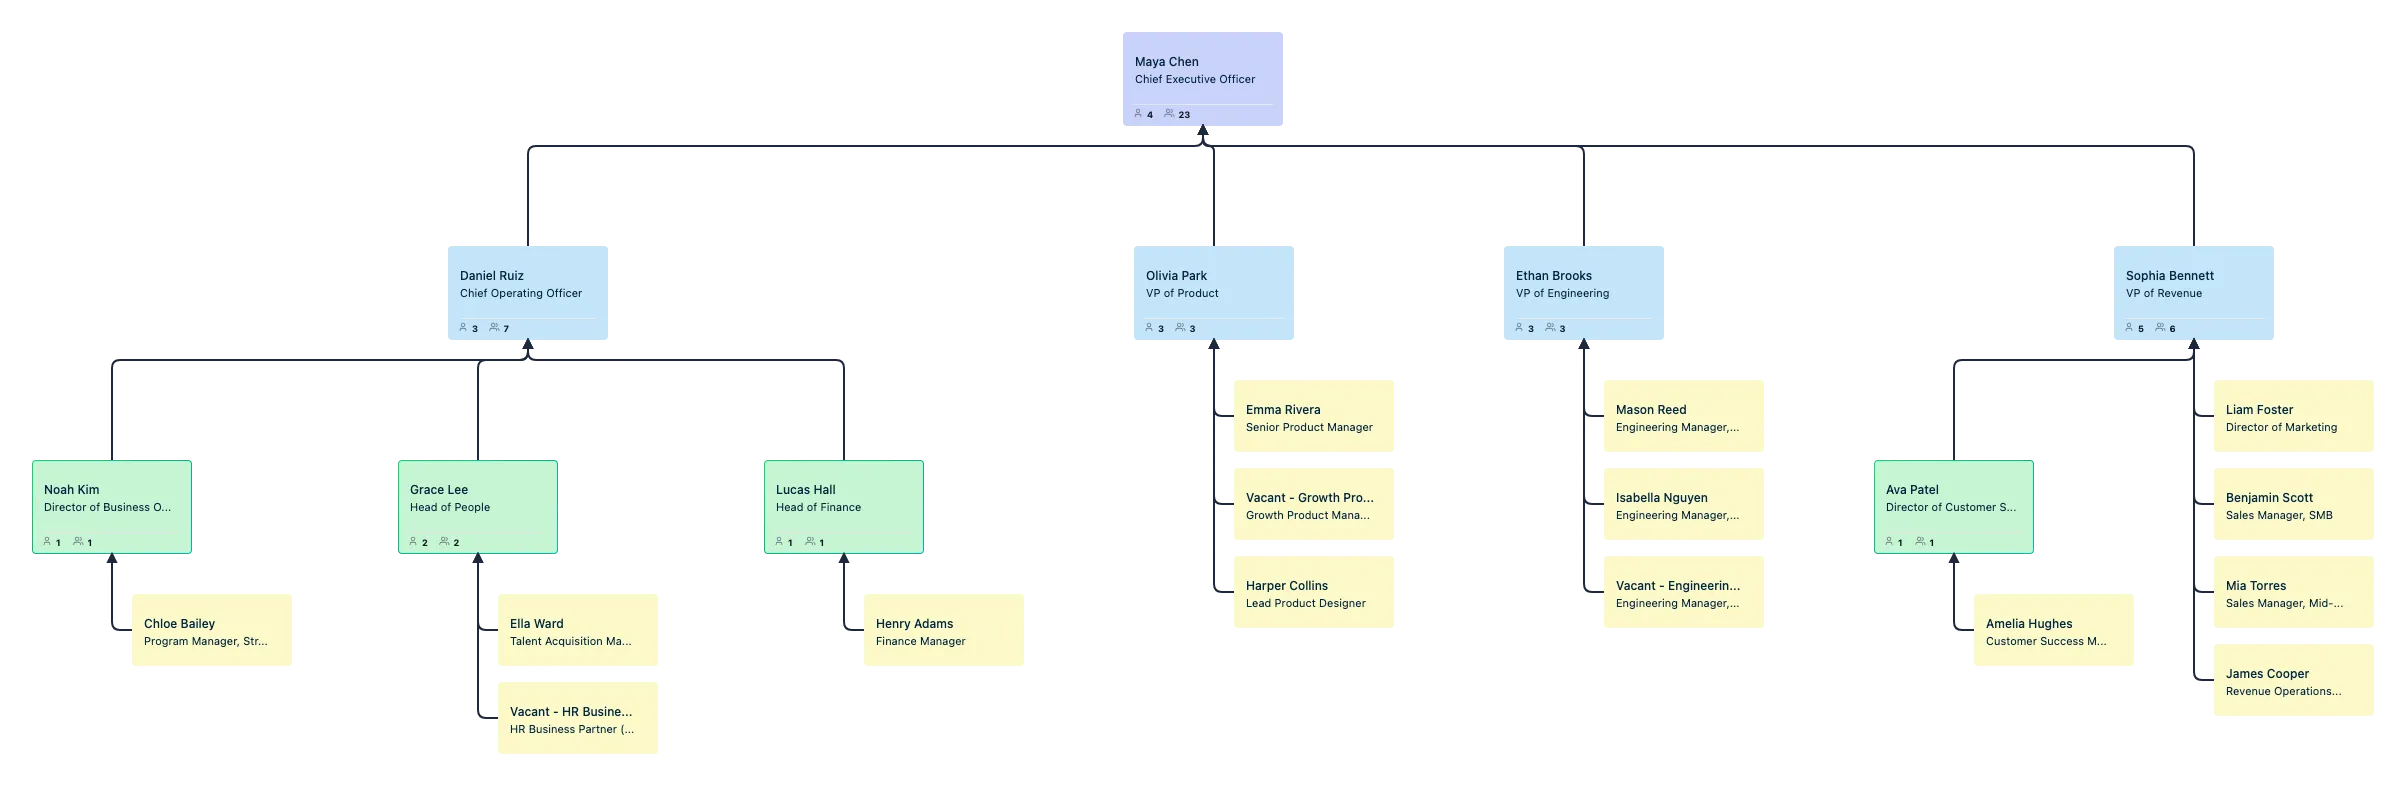
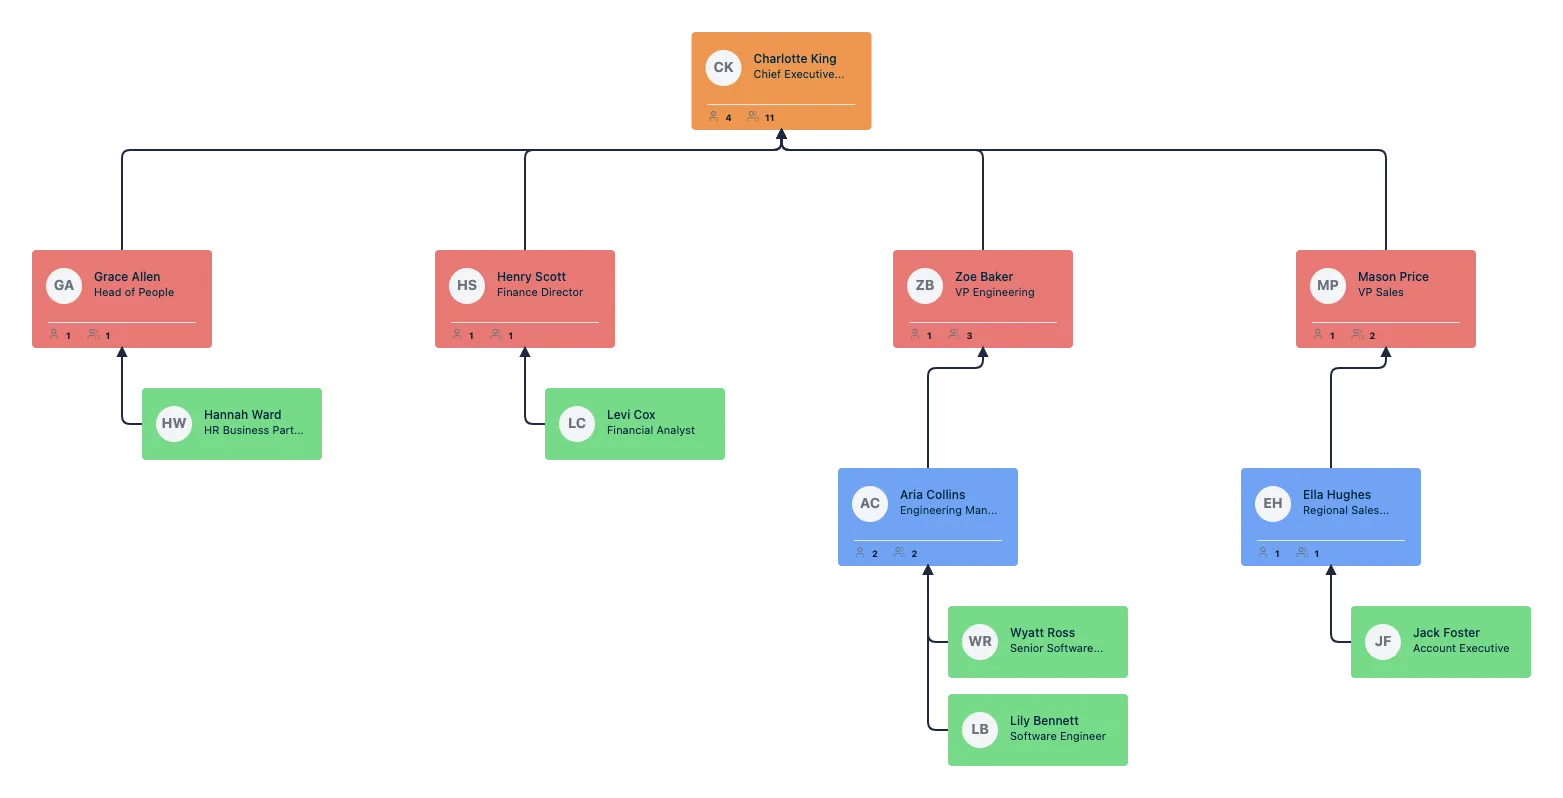
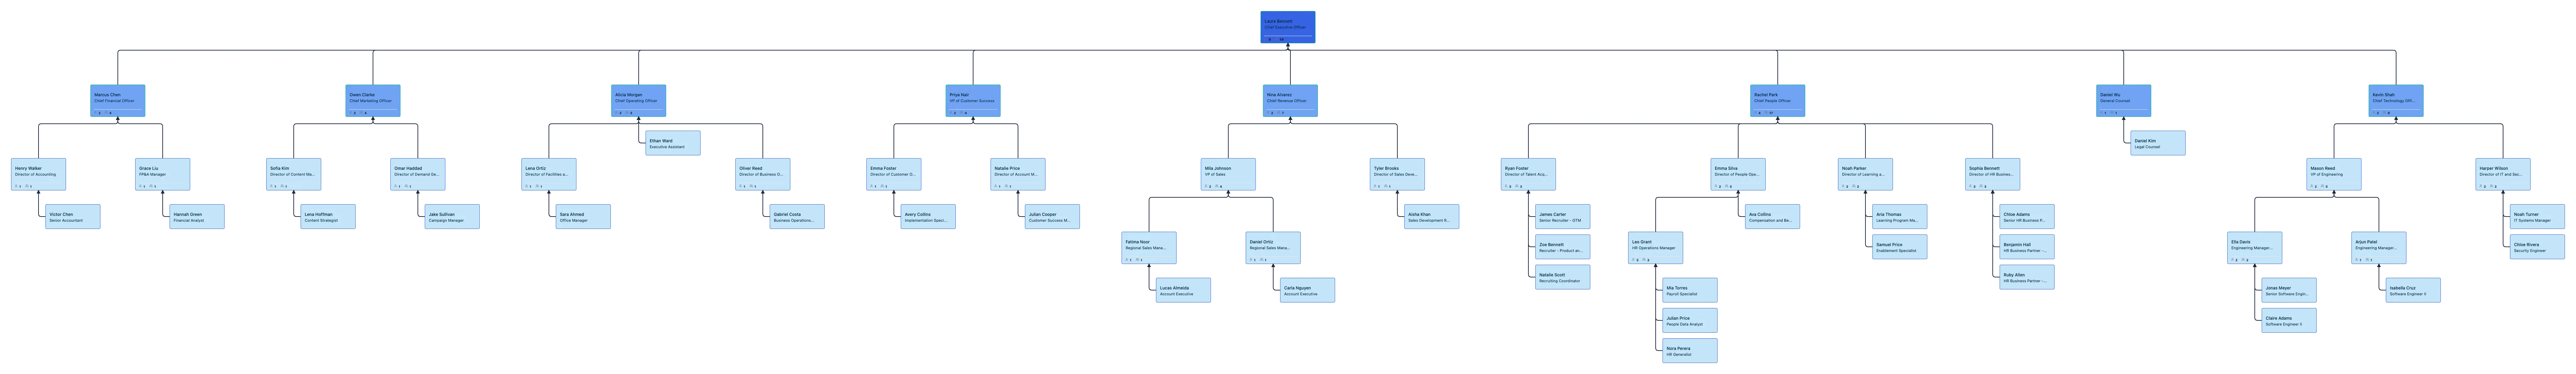
See span issues on a live org chart
Import employee data and instantly turn reporting lines into a clear visual hierarchy.

Spot overloaded managers faster
Ask AI who has the widest spans and surface manager load issues in seconds.

Compare team structure more clearly
Filter and focus by department to see where spans are too wide, too narrow, or uneven.

Test better structures before rollout
Model manager moves, layer reductions, and reorg options without touching the live org.

Keep your org data usable over time
Update roles, reporting lines, and fields easily as the organization changes.

Share insights with the right level of access
Give each stakeholder the visibility they need with role-based permissions and controlled sharing.
Build Better Span Analysis From a Live Org Chart

Turn employee data into a usable org chart faster with CSV import and auto-mapping for common HR fields.
Catch structural issues before they create confusion with validation for missing IDs, unknown managers, and reporting cycles.
Generate a clean reporting hierarchy automatically with auto-layout instead of arranging every role manually.
Keep the org chart easy to maintain with inline editing, quick-create controls, and custom fields that carry through from import.
Start with real data or generate a sample org structure with AI when you want to test ideas first.

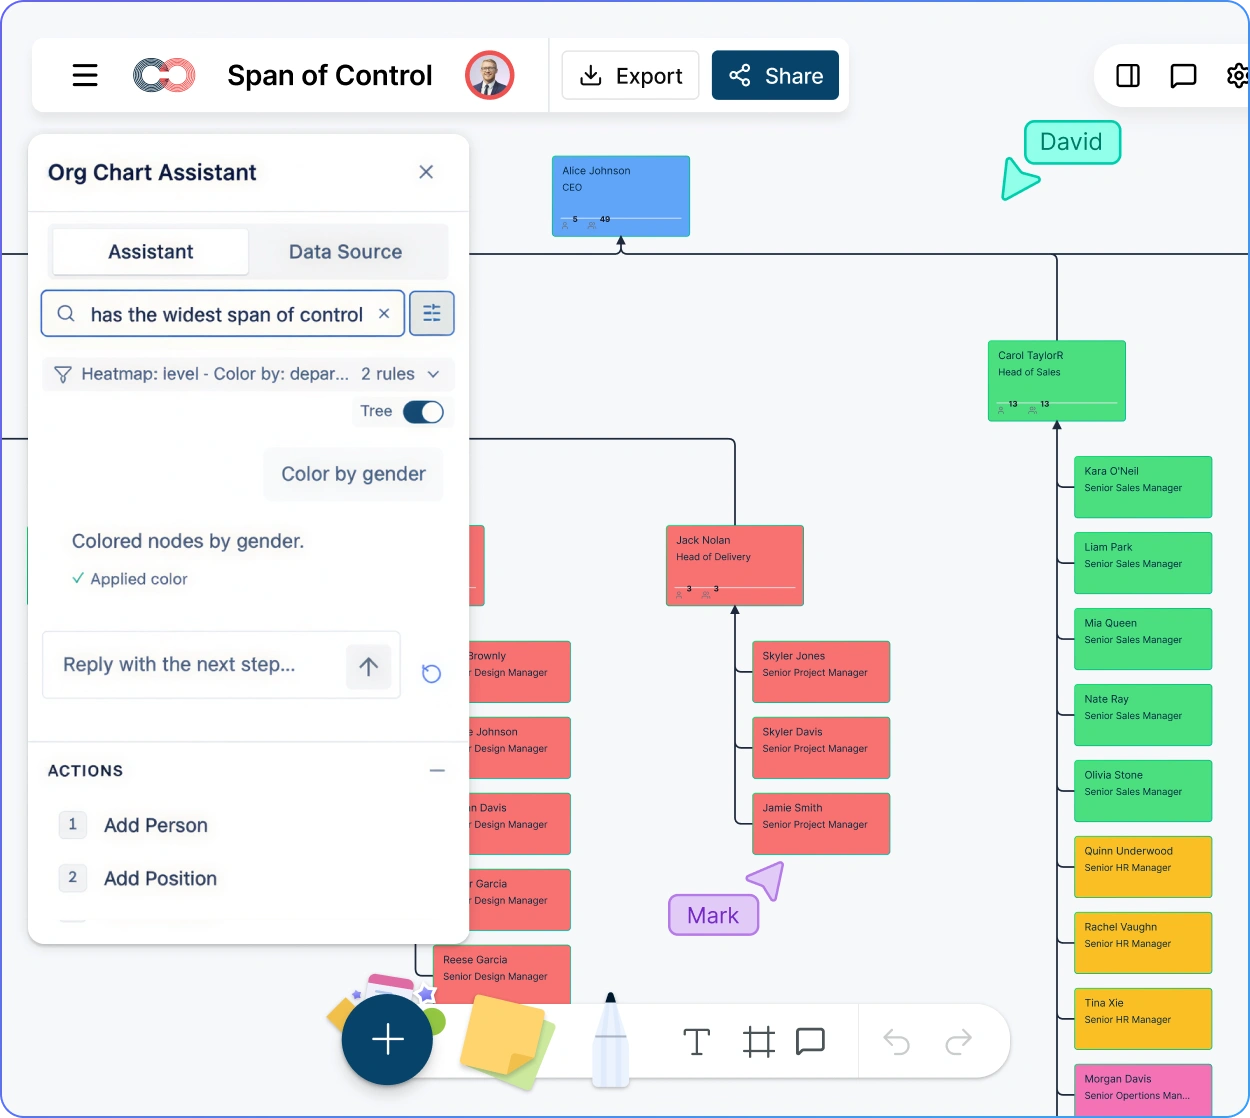
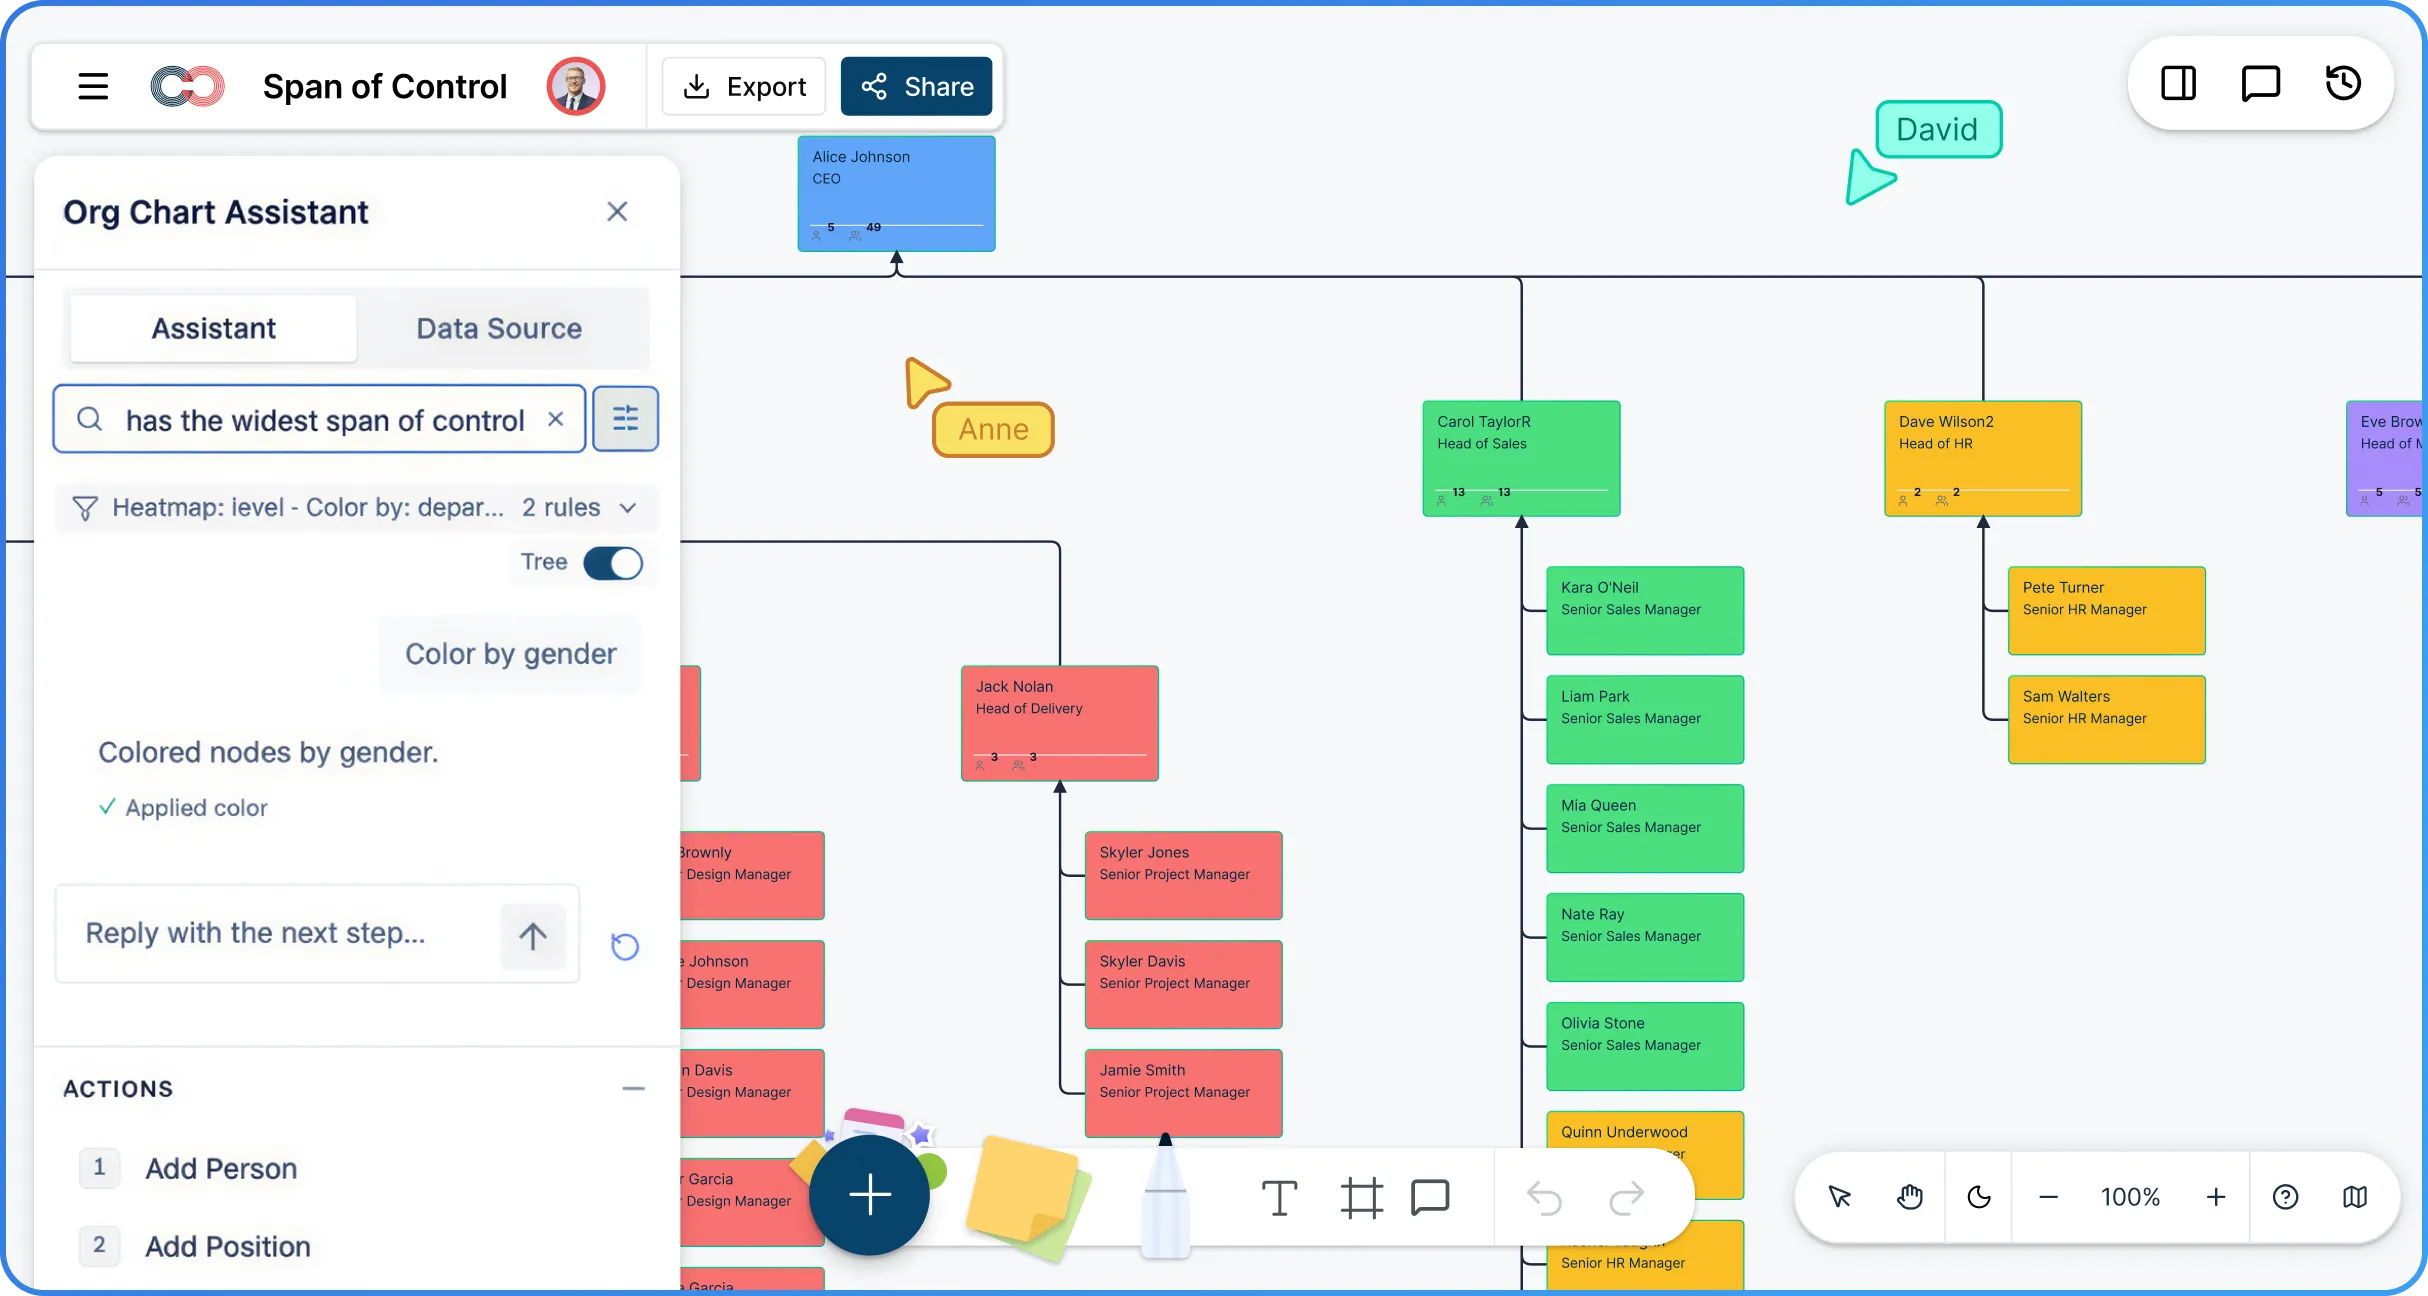
See Span of Control Problems More Clearly
Find span issues faster by asking AI who has the widest span of control or where reporting layers may be too deep.
Surface structural problems automatically with AI insights that flag managers with unusually high direct-report counts.
Focus on the teams that matter with collapsible branches and focus view for one department, leader, or subtree.
Compare teams more clearly with filters, color overlays, and heatmaps by department, location, tenure, worker type, or custom fields.
Switch between full and compact views depending on whether you need detail or a clearer view of the overall org shape.
Model Better Structures Before You Commit

Explore flatter or more balanced structures safely with scenario planning that leaves live org data untouched.
Compare reorg options side by side so leadership can review tradeoffs more clearly.
Track manager moves, layer reductions, additions, and removals with scenario-based change tracking.
Use AI to create and review structural changes in a scenario first instead of editing the live org directly.
Bring clearer before-and-after views into org design conversations instead of relying only on spreadsheets or slides.

Keep Everyone Working From the Same Shared Org View
Review org structure together in real time with shared editing, live cursors, and comments.
Let HR, leadership, and department heads work from the same org chart instead of separate versions.
Control who can edit or review with Viewer, Editor, Moderator, and Owner permissions.
Share read-only views for executive reviews, board discussions, and planning conversations without creating extra copies.
Protect Sensitive Workforce Data While You Analyze

Keep sensitive workforce data visible only to the right people with field-level access tied to role and sensitivity tier.
Share org charts without exposing confidential data because shared links still respect permissions.
Give HR and leadership deeper visibility while limiting broader access to only what each user needs.
Protect org planning workflows with controlled sharing, role-based permissions, and privacy-aware collaboration.
How to Analyze Span of Control with Creately
Import your employee data into the span of control software or start from a template
Generate a clean reporting hierarchy automatically
Ask AI to identify span and layer issues
Filter and focus on the teams that matter
Model changes and share the best structure
Free Ready-to-Use Span of Control Analysis Org Chart Templates
Use Cases
Reorg Planning
Model reporting changes, manager moves, and layer reductions before rollout so leadership can compare options with more confidence.
Span of Control Reviews
Spot managers with overloaded or underloaded teams faster and identify where reporting structures need to be rebalanced.
Layer Reduction Initiatives
Find where the org has become too tall and test flatter structures that reduce complexity and improve decision speed.
Department Structure Reviews
Compare team width and hierarchy depth across departments to see where spans are too wide, too narrow, or inconsistent.
Headcount and Growth Planning
See how hiring plans and team growth will affect manager load so you can scale the structure more intentionally.
Leadership and Board Reviews
Share a clear, visual view of org structure and proposed changes for planning conversations, executive reviews, and board discussions.
FAQs About the Span of Control Analysis Software
What are Creately’s span of control analysis tool pricing plans?
- Free Plan — $0/month for basic span of control analysis creation and collaboration
- Starter & Team Plans — $8/month or $5/month billed annually
- Business Plan — $149/month or $89/month billed annually
Annual billing helps you save more while unlocking advanced collaboration, workspace management, and enhanced span of control analysis features. You can compare all available plans and features on the Creately Pricing Page.
How can you create span of control analyses faster?
Are there templates for different span of control analysis use cases?
Can teams collaborate on span of control analyses?
Can I add notes, data, and files?
Can I share, present, or export span of control analyses?