Project Team Org Chart Tool
Keep Project Team Structures Clear and Current
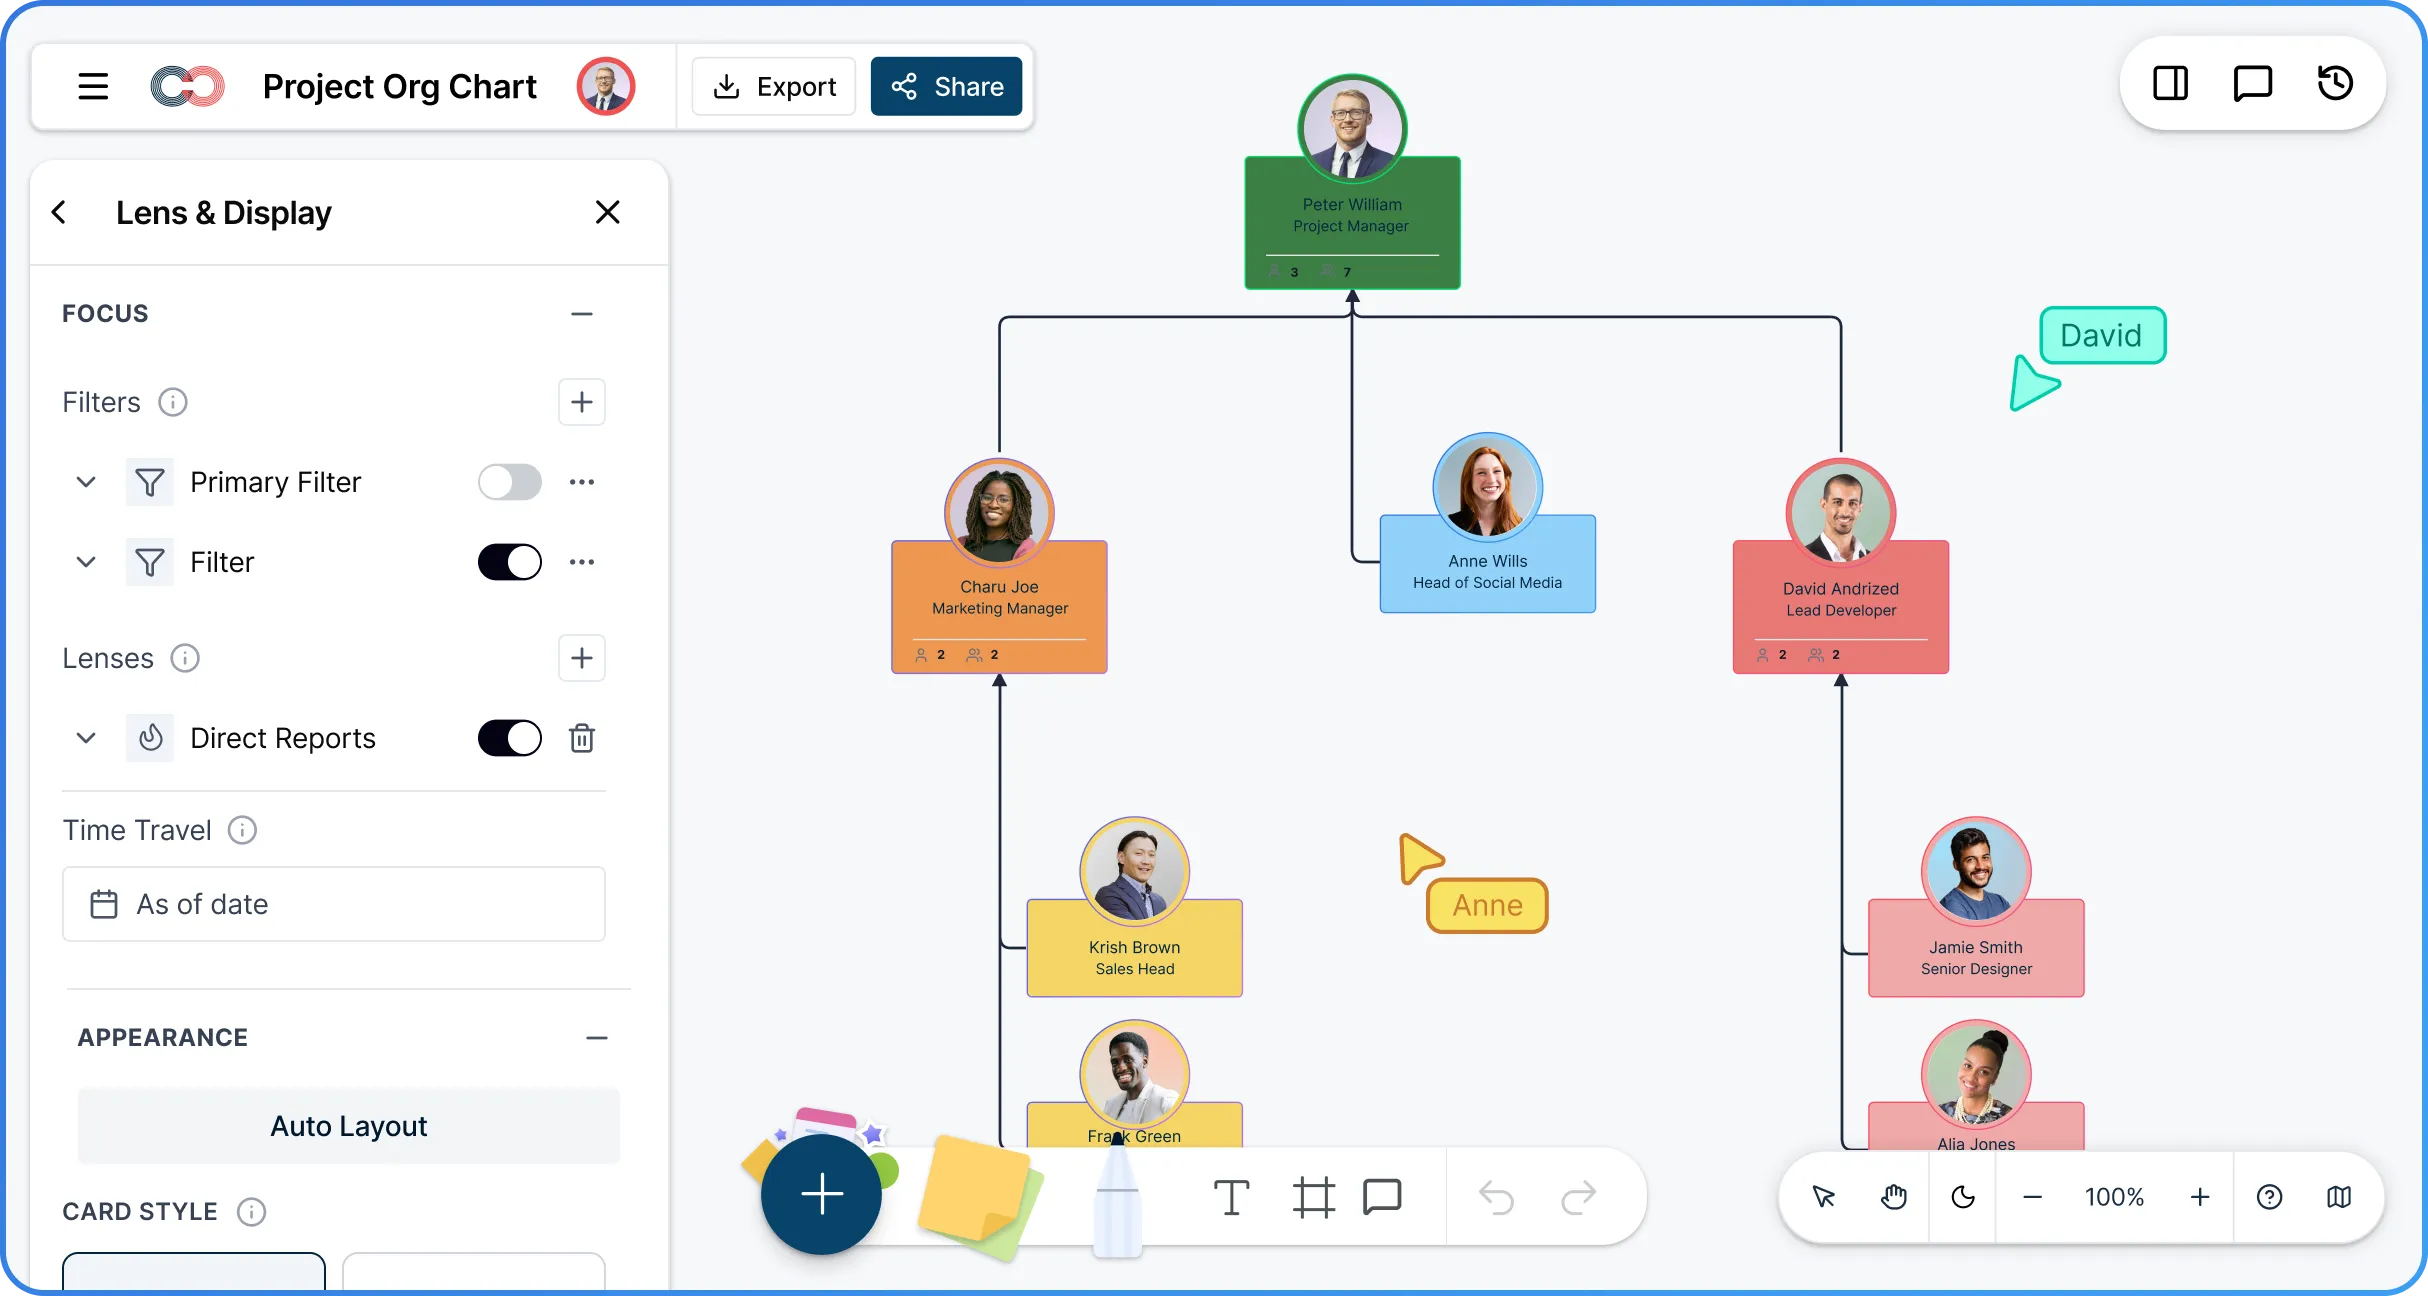
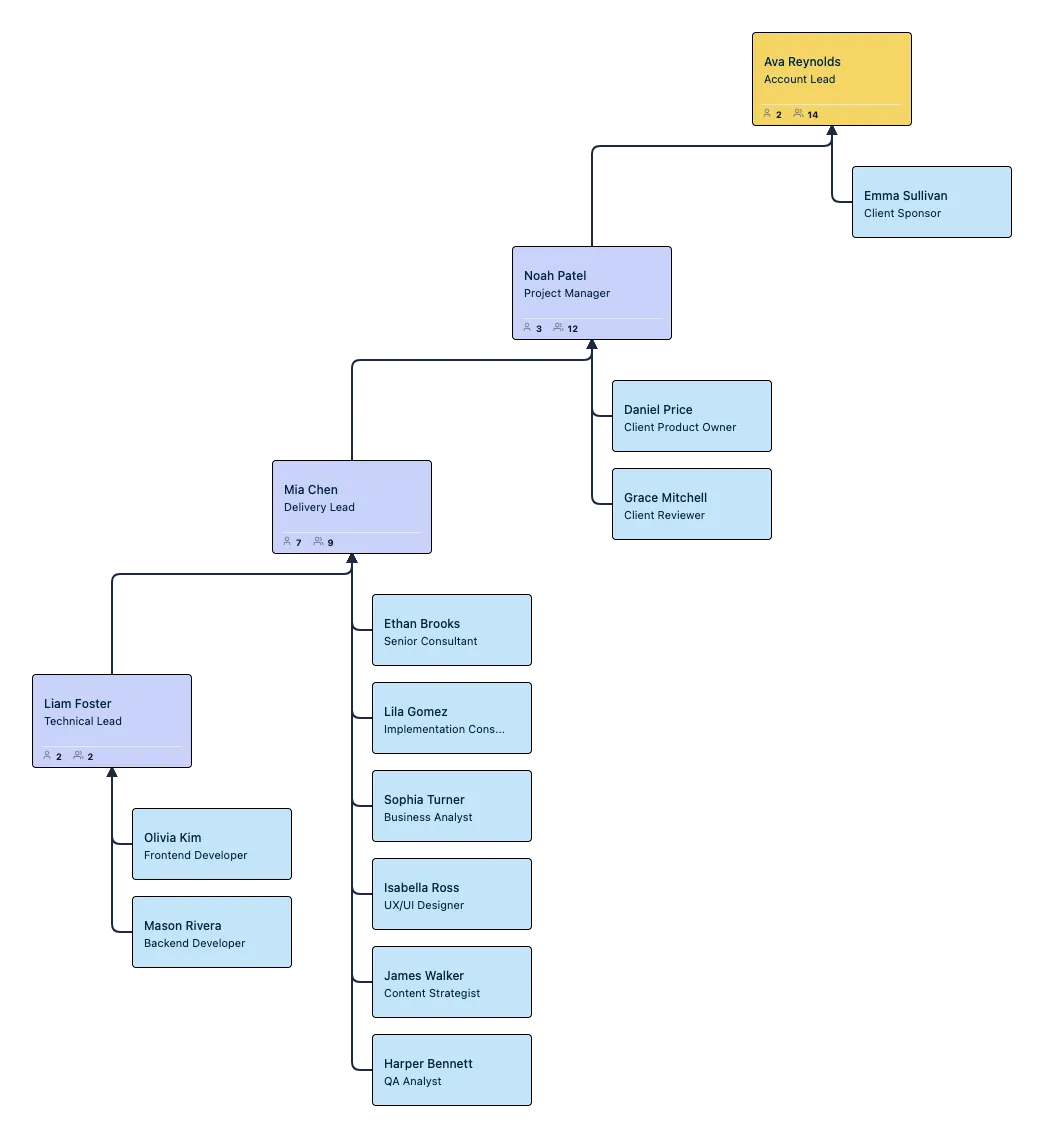
Map project leads, cross-functional workstreams, reporting lines, and assigned team members in one shared workspace. Import team data from a spreadsheet, build org charts from scratch, assign people to projects, and update the structure as teams shift.
![]() Team data is spread across spreadsheets and docs
Team data is spread across spreadsheets and docs
Import CSV data, auto-map common columns, and generate the org chart faster.
![]() Cross-functional reporting is hard to explain
Cross-functional reporting is hard to explain
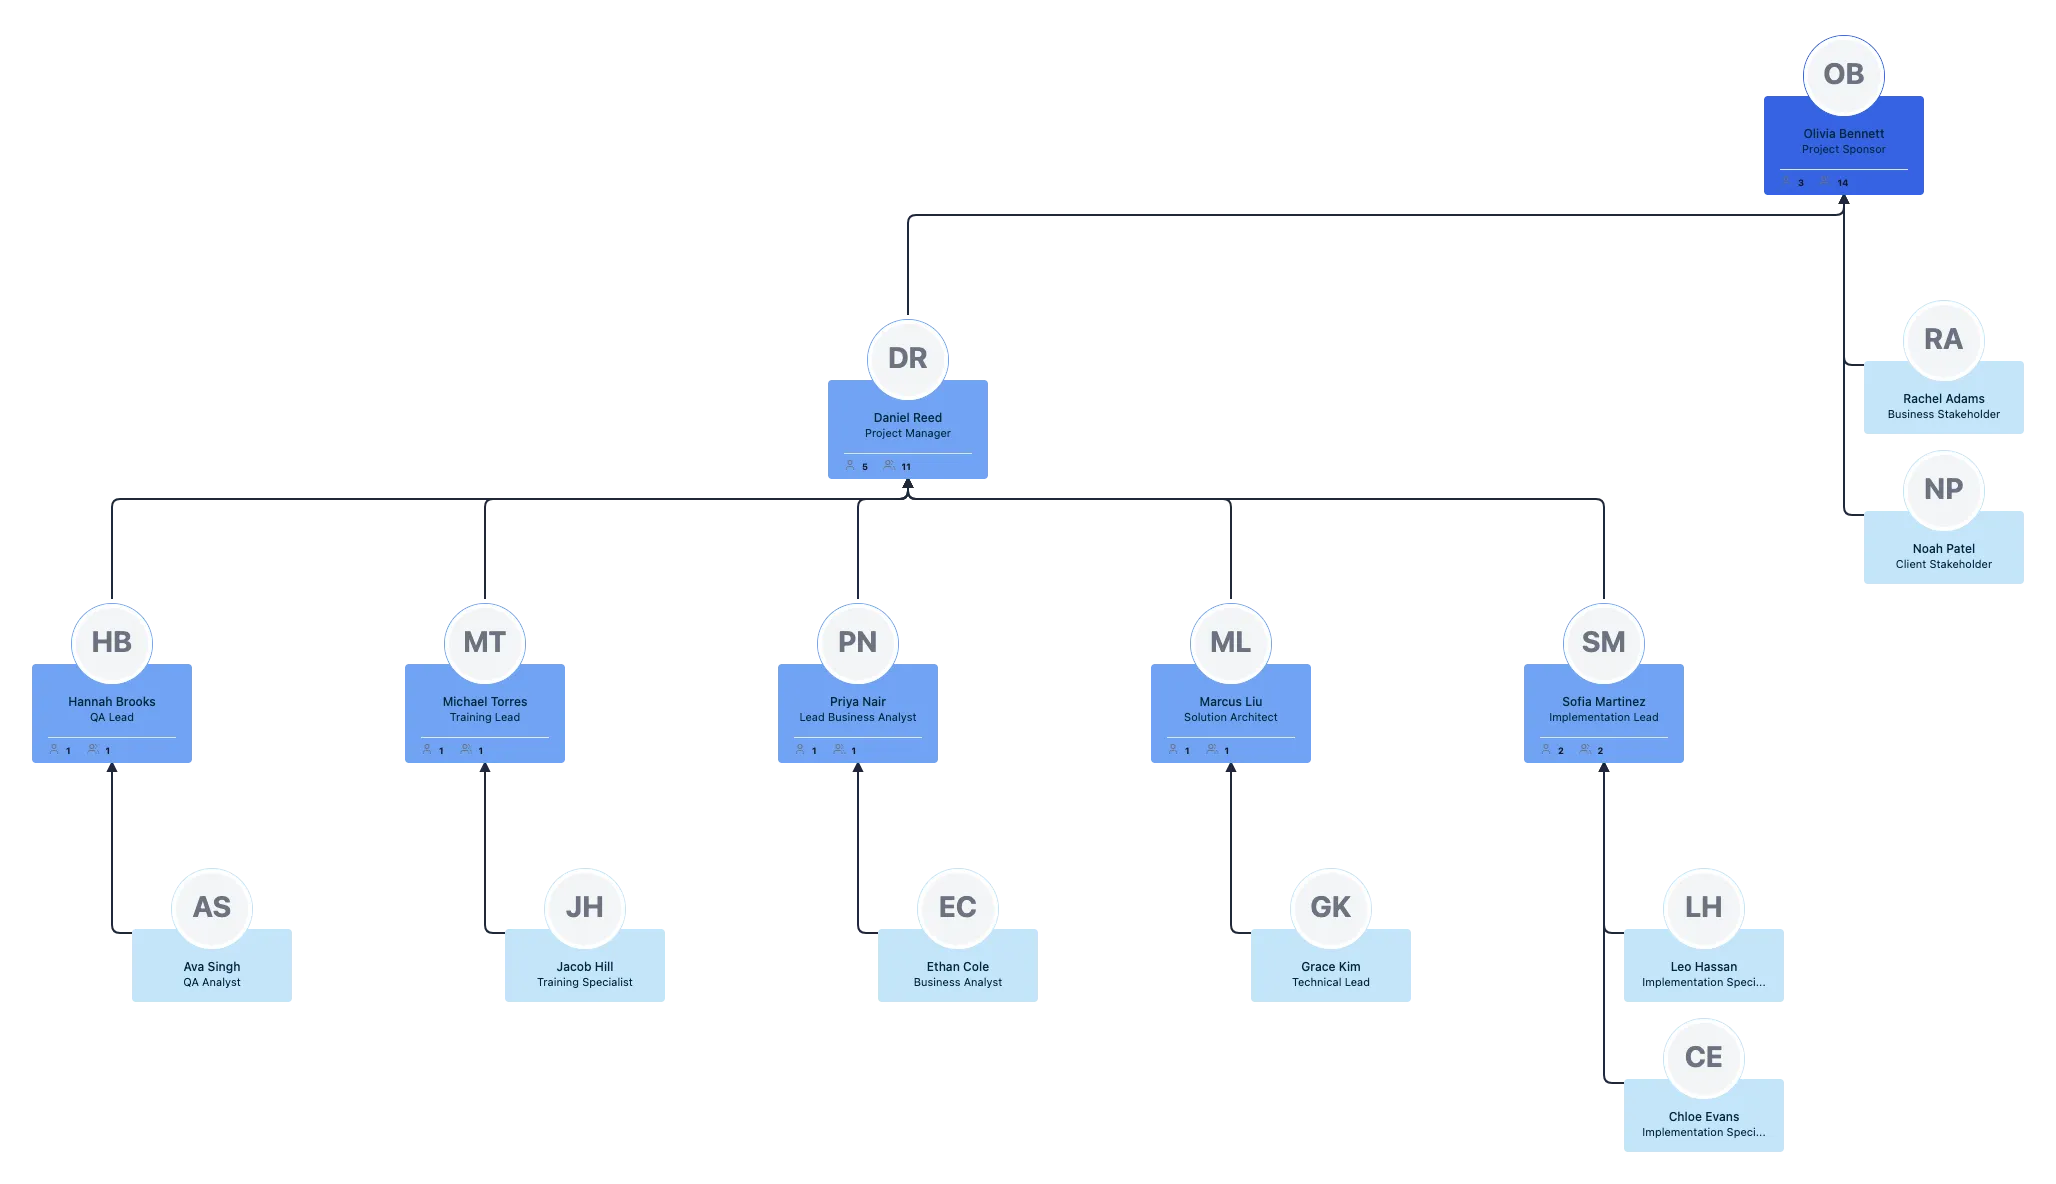
Show direct, dotted-line, and matrix relationships clearly in one visual structure.
![]() Static org charts go out of date quickly
Static org charts go out of date quickly
Edit roles inline, auto-save updates, and keep project staffing current without redrawing everything.


 Diagramming Visual Collaboration Org Chart


Why Use Creately’s Project Team Org Chart Software

Built for Cross-Functional Project Teams
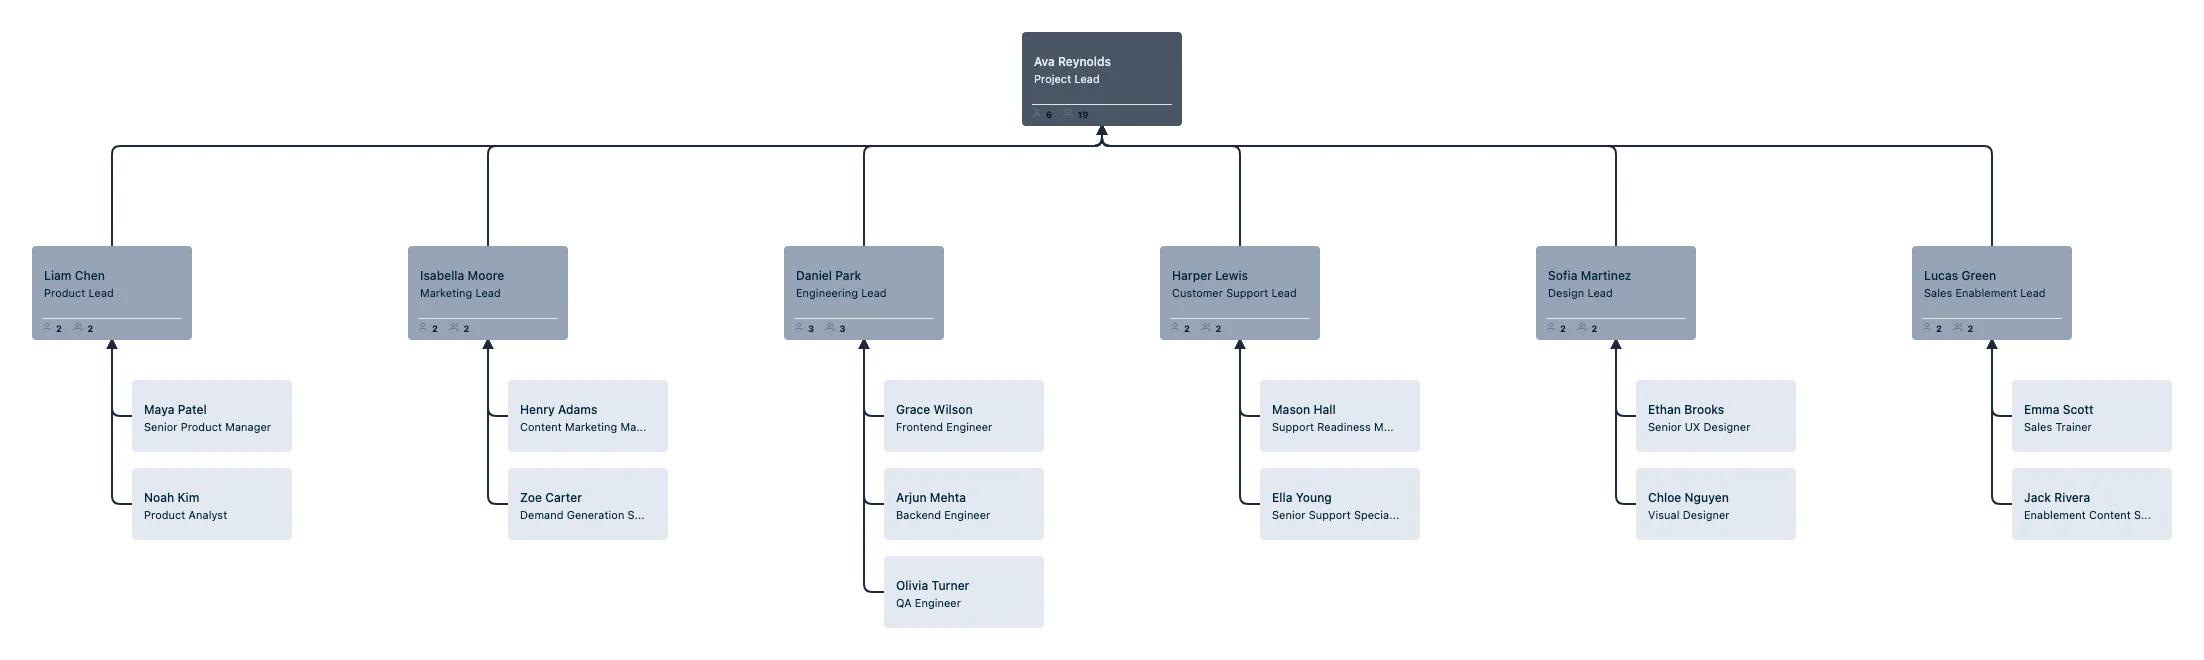
Map project leads, workstreams, contributors, and support roles in one connected organizational chart.

Keep Project Team Structures Easy to Update
Edit roles inline and update reporting lines without rebuilding the chart.

Show Matrix and Project Relationships Clearly
Use direct, dotted-line, and matrix relationships to reflect how teams actually work.

Explore the Org With AI
Ask questions in plain language, highlight teams, isolate subtrees, and surface insights faster.

Model Team Changes Before You Commit
Use scenarios to test staffing moves, reporting changes, and new structures without affecting the live chart.

Collaborate on the Same Org Chart in Real Time
Co-edit with teammates, leave comments, and manage access with role-based permissions.
Turn Project Team Data Into an Org Chart You Can Keep Current

Build your project team org chart faster from existing team data with CSV import and smart column mapping.
Catch structure issues before they create confusion with validation for missing IDs, unknown managers, reporting cycles, and empty rows.
Start with a clean hierarchy instead of arranging every card manually with automatic org chart generation and auto-layout.
Keep the project team organizational chart accurate as project teams change by editing names and titles directly on the chart with inline editing.
Add new roles and reporting lines quickly with blue connection dots, quick-create actions, and support for custom fields.

Show Cross-Functional Teams and Matrix Reporting Clearly
Map project teams beyond hierarchy with support for project entities, team entities, and cross-functional structures on the same canvas.
Show direct, dotted-line, and matrix relationships clearly so the chart reflects how the team actually works.
Keep permanent teams, pods, and squads visible alongside short-term project staffing in one shared workspace.
Separate people from positions when needed so the structure stays visible even when a role changes or becomes vacant.
Explore the Org Faster and Plan Team Changes Confidenently

Ask questions in plain language to find people, trace reporting lines, and explore the org faster with AI.
Highlight teams, apply filters, and use color or heatmaps to spot patterns across the org more easily.
Focus on the part of the org that matters by isolating departments, subtrees, or workstreams without visual clutter.
Model reporting changes, staffing moves, and new team structures before committing with scenario planning.
Compare multiple structure options side by side and keep the live org chart unchanged until you are ready.

Keep Everyone Working from the Same Up-to-Date Org Chart
Work on the same org chart together with real-time co-editing, live presence, and threaded comments.
Control who can view or edit the org chart with role-based permissions for viewers, editors, moderators, and owners.
Switch between full and compact card views depending on whether you need detail or a high-level team view.
Collapse branches to focus discussions on one team, workstream, or project area at a time.
Share or export the org chart in PNG, SVG, PDF, or CSV for presentations, documentation, and structured reuse.
How to Create a Project Team Org Chart
Import your team data or start with a blank canvas.
Generate the org chart with auto-mapped roles and reporting lines.
Add project entities, team entities, and cross-functional relationships.
Customize cards, roles, and views to fit the project structure.
Share, collaborate, and keep the org chart updated over time.
Use Cases
Coordinate Cross-Functional Product Launches
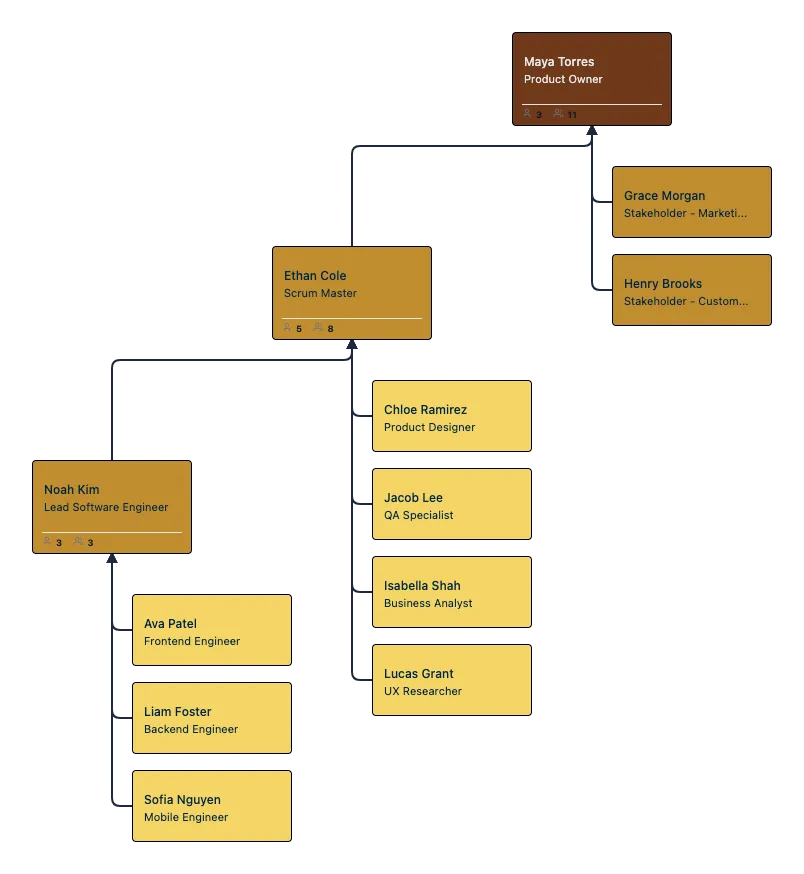
Bring product, design, engineering, marketing, sales enablement, and support into one org chart so everyone can see how the launch team connects and who owns each part of the rollout.
Structure Cross-Functional Project Teams Clearly
Map people from different functions in one org chart so it is easier to show who leads the work, how teams connect, and where responsibilities sit across the project.
Model Matrix Reporting Clearly
Show who people report to formally and how they contribute across workstreams or delivery teams with distinct dotted-line and matrix relationships.
Keep Project Team Structures Current During Delivery
Update names, roles, reporting lines, and assignments in real time as the project evolves, without redrawing the org chart or managing multiple versions.
Explore Skills and Team Fit More Easily
Use skills fields, searchable profiles, and role profiles to find people with the right experience for a project team or cross-functional initiative.
Compare Team Structures Before Making Changes
Create scenarios to test staffing moves, new reporting lines, or different team structures before applying updates to the live org chart.
FAQs About the Project Team Org Chart Creator
Can I build a project team org chart without importing data?
Can I use custom fields in a project team org chart?
Can I create project teams and permanent teams in the same workspace?
Can multiple people edit the same project team org chart?
Can I undo changes if I make a mistake?


Find practical guides and support articles for mapping project roles, cross-functional teams, reporting lines, and project assignments more clearly.
 Quick Answers
 Project Team Org Chart Guides
 Practical Support Articles