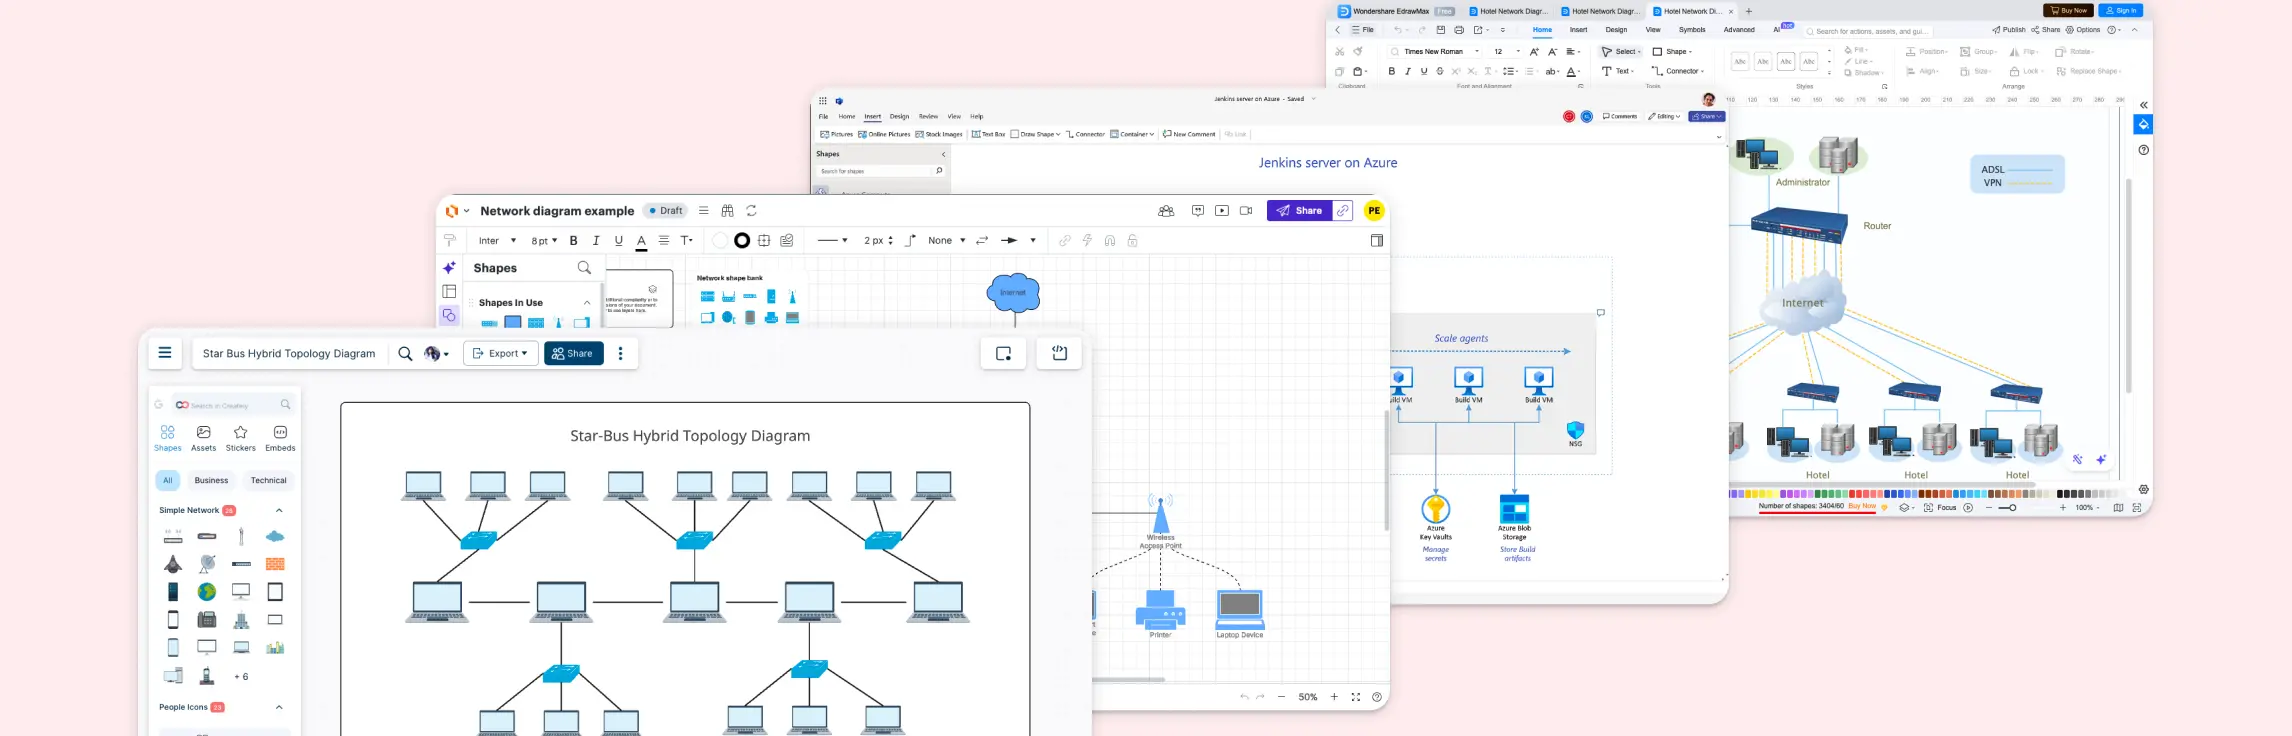
Ever stared at a diagram full of tangled notes trying to make sense of your network setup? The right network diagram software can turn that chaos into clarity. In this guide, we’ll walk you through the best network diagram software, so you can pick the solution that brings structure, speed, and visual clarity to your workflow.
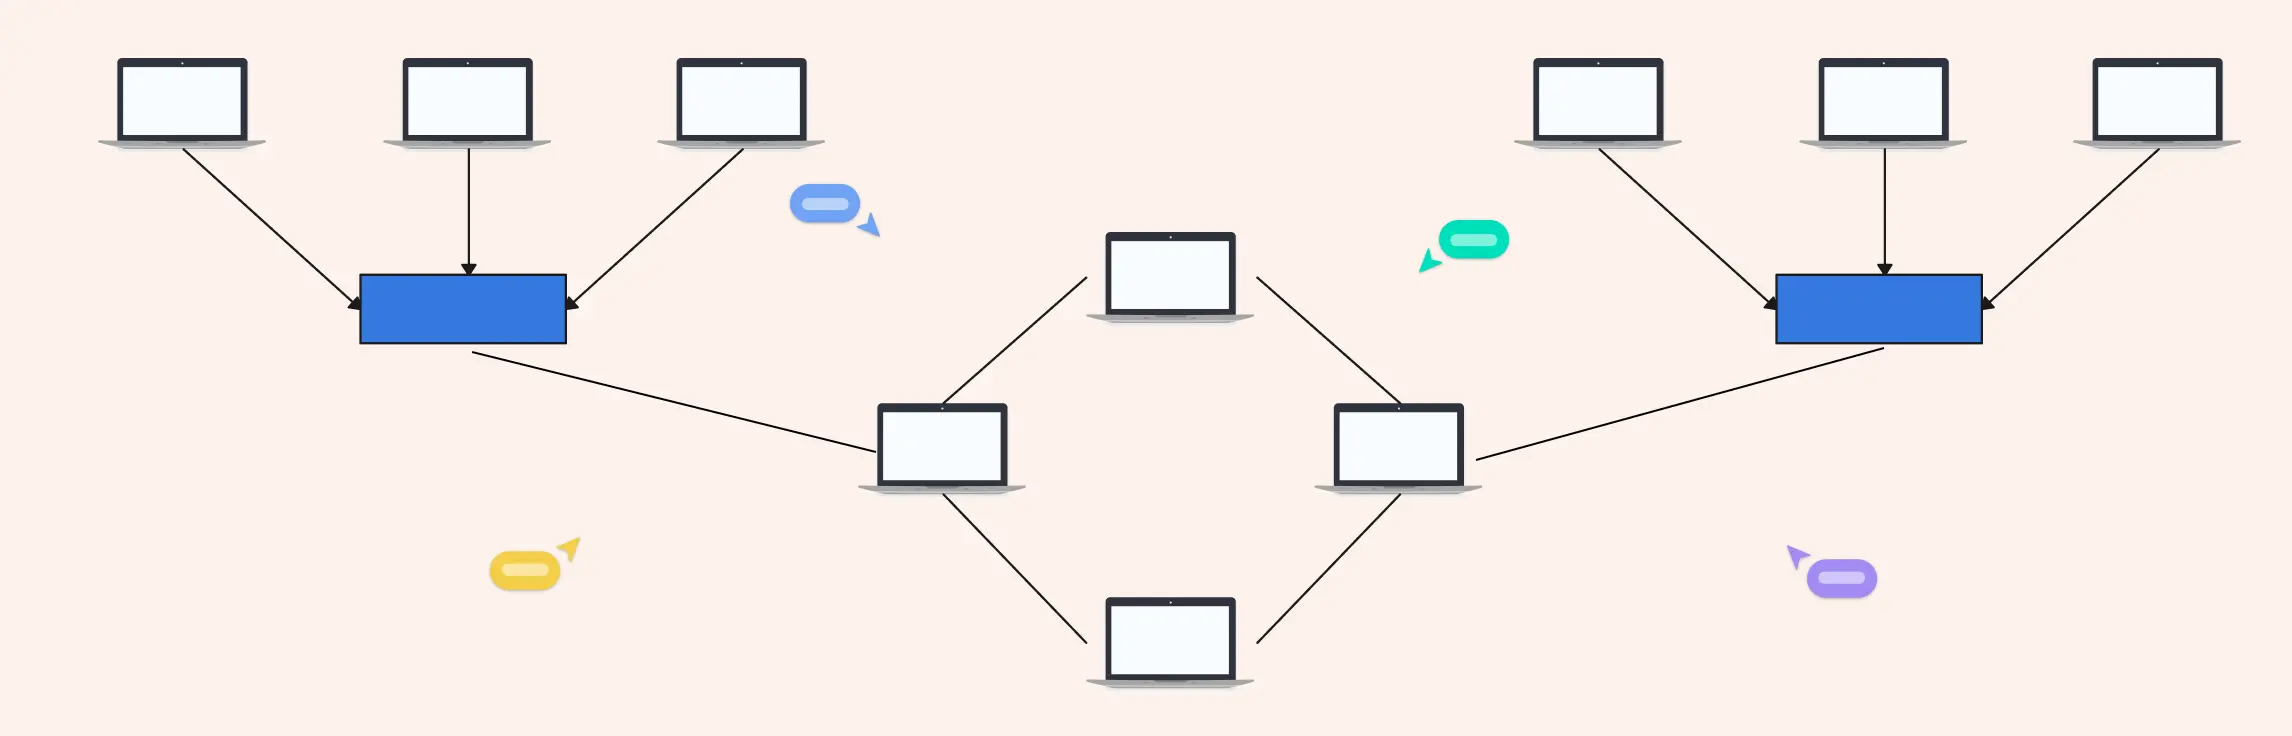
Ever stared at a tangle of cables or a messy network diagram and thought, “There has to be a better way”? That’s where the extended star topology comes in: a structured, scalable network design that keeps communication smooth, devices organized, and troubleshooting a breeze.
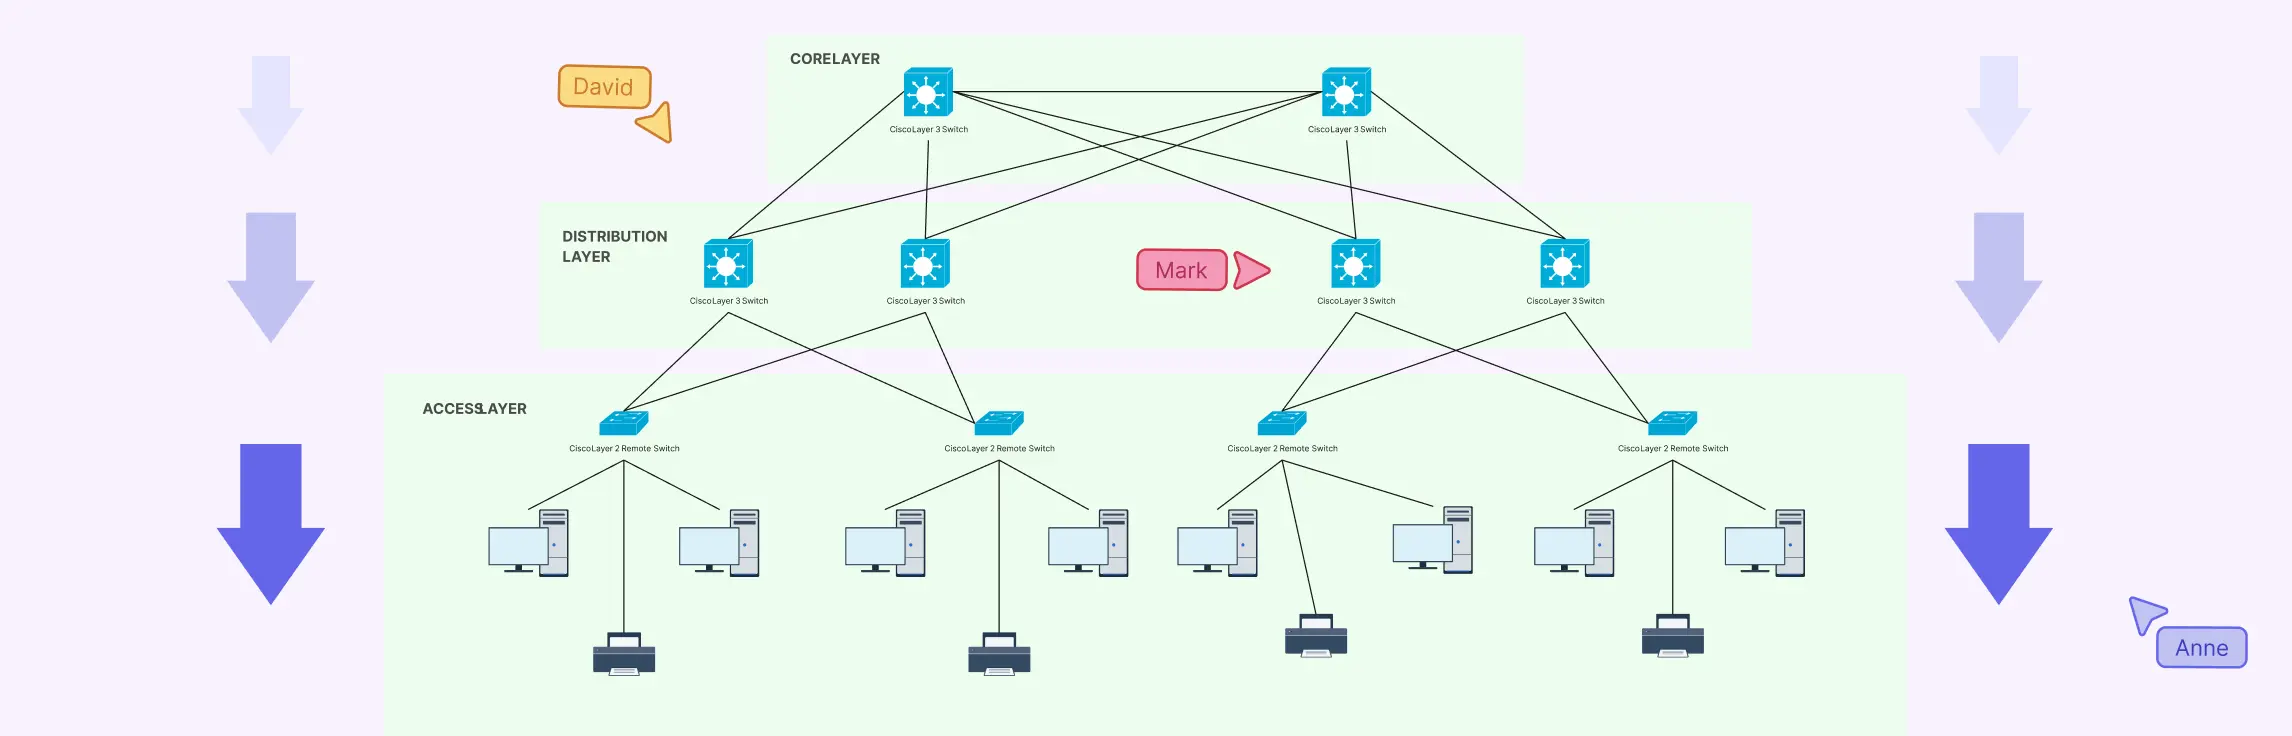
Designing a network can feel like trying to untangle a massive ball of wires, confusing, frustrating, and time-consuming. That’s where a hierarchical network topology comes in. In this guide, we’ll break down what a hierarchical topology is, explore its core layers, show real-world examples, and weigh its advantages and disadvantages.
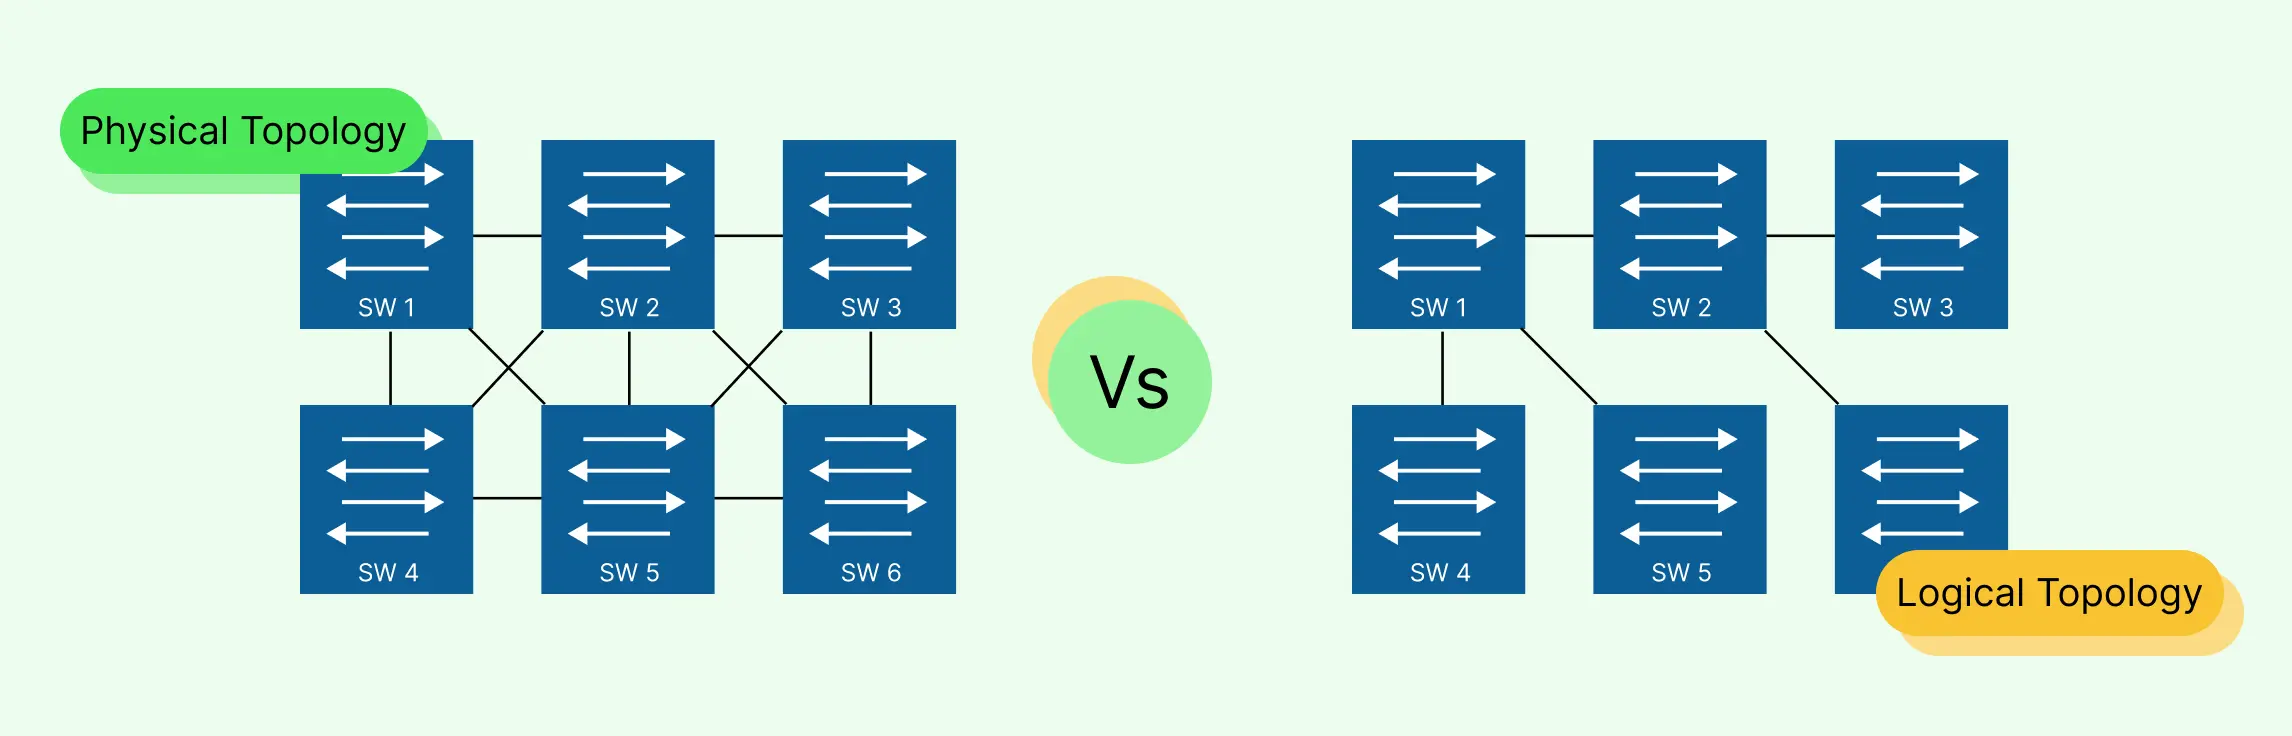
Designing and managing a network can quickly become overwhelming, cables everywhere, unclear data paths, and confusing layouts can leave even experienced IT teams frustrated. That’s why understanding the difference between logical topology vs physical topology is essential. In this guide, we’ll break down physical and logical topologies, explain how they differ, and show you how to create clear, accurate diagrams that save time, reduce errors, and make collaboration effortless. Plus, you’ll discover ready-to-use templates that let you map networks visually without the stress of starting from scratch.
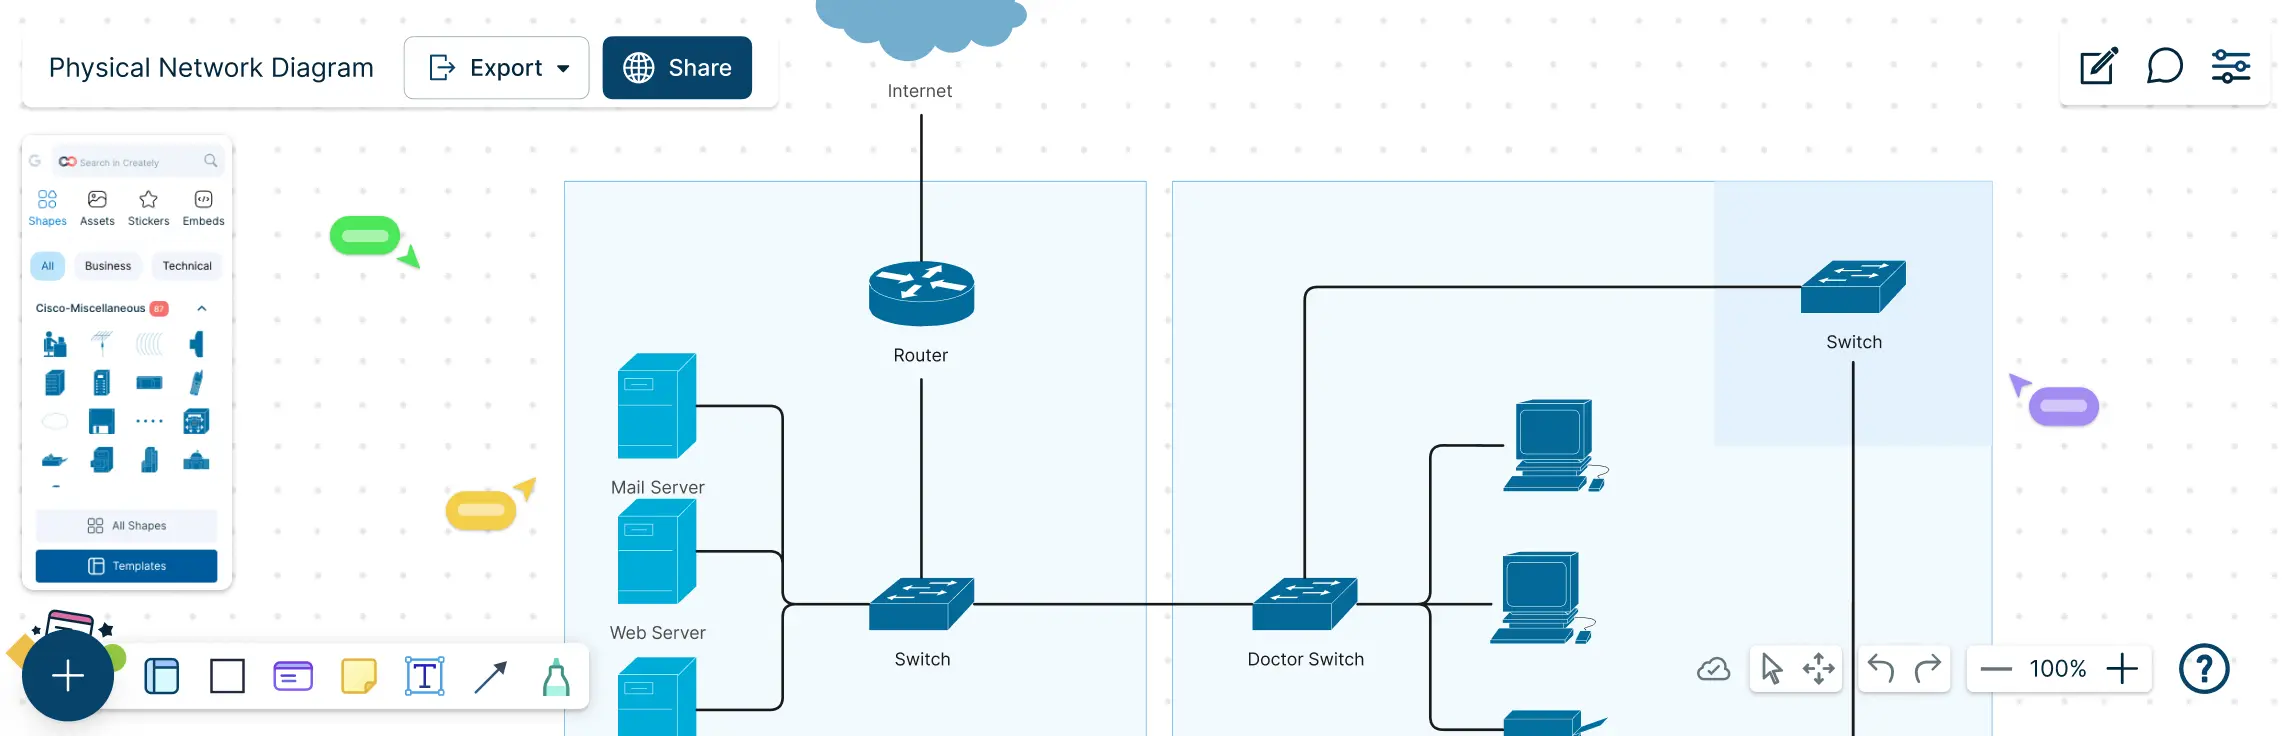
Managing a network without a clear map can feel like navigating a maze blindfolded. Cables tangled, devices misplaced, and troubleshooting taking hours instead of minutes. That’s where a physical network diagram comes in. This guide will show you exactly what a physical network diagram is, why it matters, and how to create one step by step. You’ll also learn about its key components, common topologies, best practices, and ready-to-use templates that make diagramming fast, accurate, and visually intuitive.
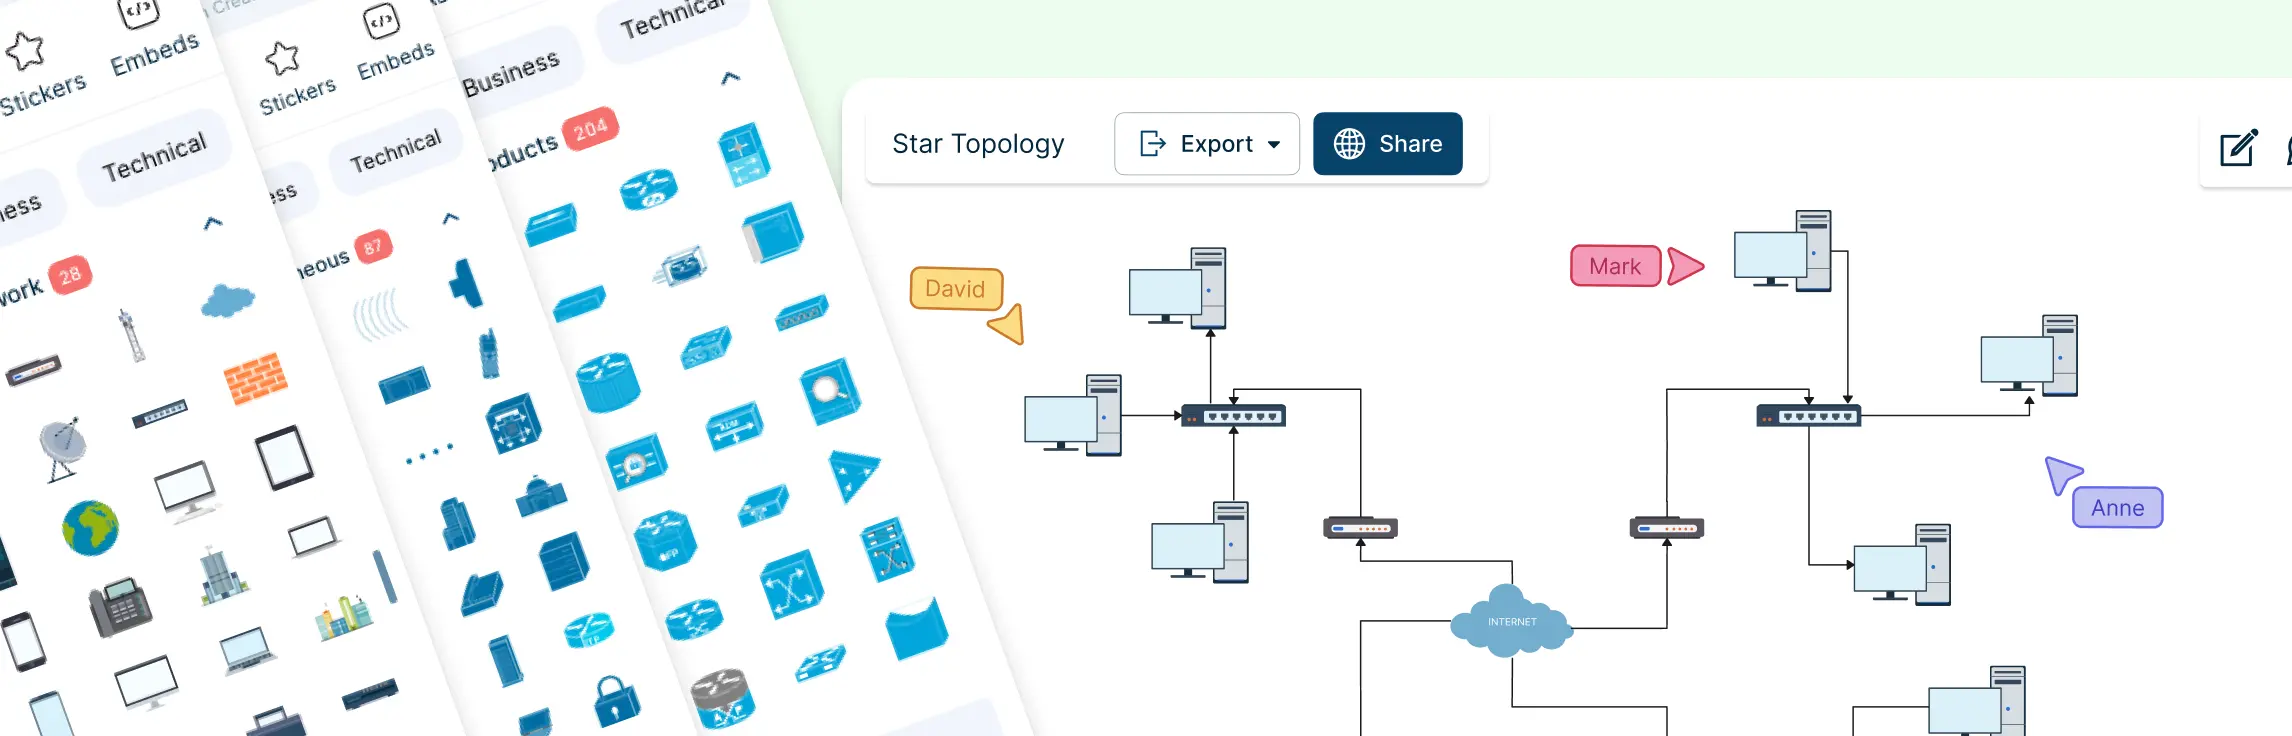
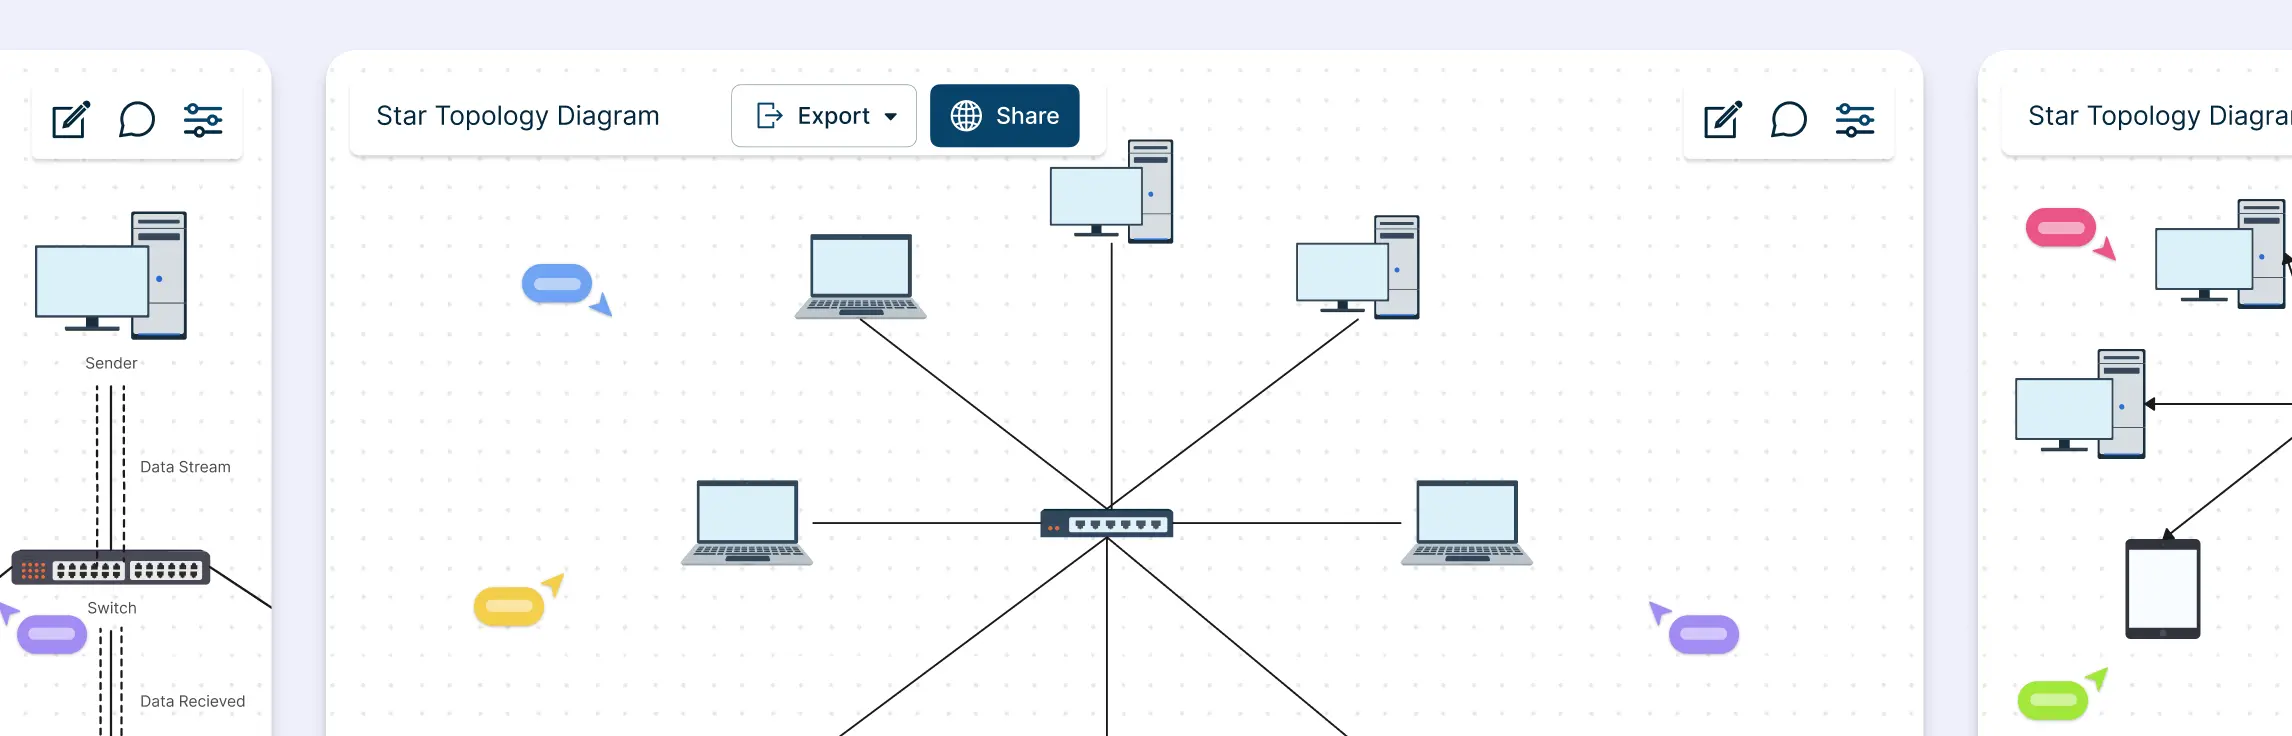
Network topology can feel unnecessarily complex, especially when you’re juggling performance issues, scaling needs, and team alignment at the same time. This guide breaks down star and ring topology in a simple, practical way, without the jargon overload. You’ll learn how each topology works, see real-world examples, understand the difference between star and ring topology, and explore how a star–ring hybrid topology combines the best of both worlds.
Managing a network that spans multiple departments, locations, or devices can feel like juggling puzzle pieces in the dark. That’s where a hybrid topology diagram comes in. By visually mapping how different network topologies connect and work together, you can turn chaos into clarity. This guide will walk you through what hybrid topology diagrams are, explore the types and examples, highlight advantages and disadvantages, provide a step-by-step creation process, and share best practices to make your diagrams clear, scalable, and actionable.
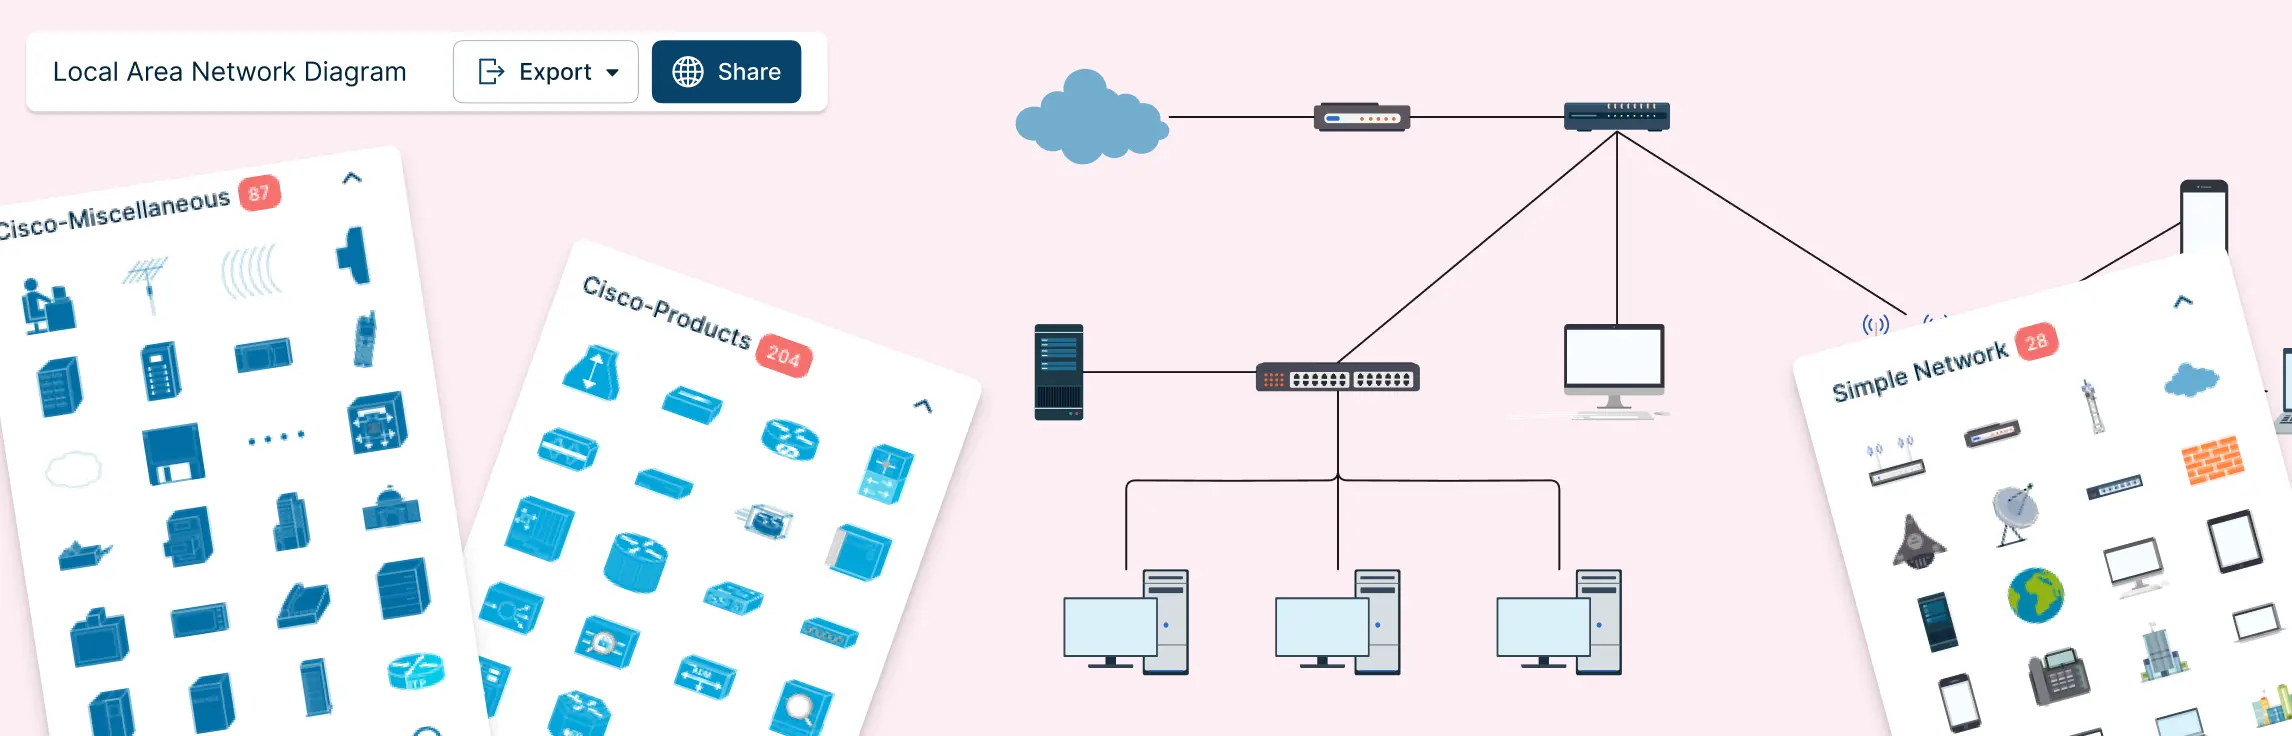
If you’ve ever tried to understand a network setup by staring at a jumble of cables, spreadsheets, or half-erased whiteboard sketches, you know the frustration. Devices are connected, something breaks, and suddenly no one knows what connects to what—or why. That’s exactly where a local area network diagram makes all the difference.
Ever stared at a tangled web of network devices, cables, and subnets and thought, “How does any of this actually work?” Managing a network without a clear visual plan can be frustrating, time-consuming, and prone to costly errors. That’s why a logical network diagram is a game-changer. In this guide, we’ll cover what a logical network diagram is, how it differs from a physical network diagram, why it’s useful, and how to create one, including ready-to-use templates and best practices to streamline your workflow.
Project plans can fall apart fast when task dependencies aren’t clear. That’s where project network diagrams come in. They help you visualize how work flows, spot bottlenecks early, and keep timelines realistic as projects grow in complexity.
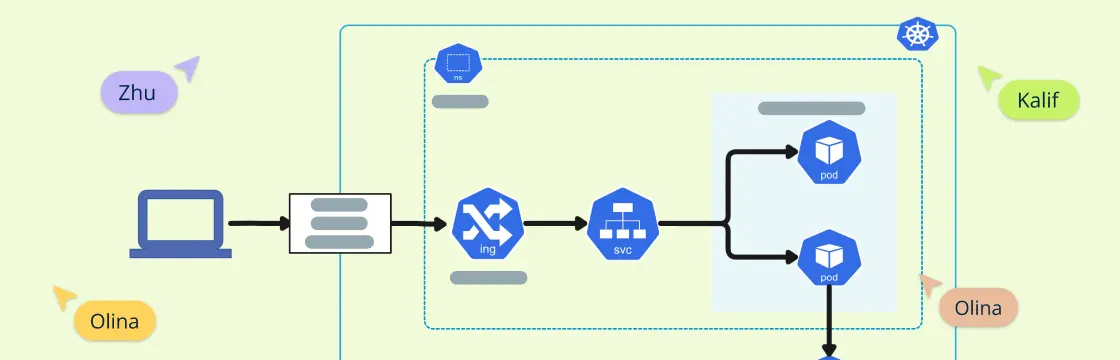
Kubernetes has rapidly become a cornerstone in modern DevOps, enabling seamless automation of deployment, scaling, and management of containerized applications. Understanding its architecture is crucial for optimizing these processes. A Kubernetes architecture diagram serves as a visual representation of the intricate components and their interactions within the Kubernetes ecosystem. These diagrams are indispensable tools for DevOps engineers, cloud architects, and IT professionals looking to design, implement, and manage Kubernetes clusters effectively.
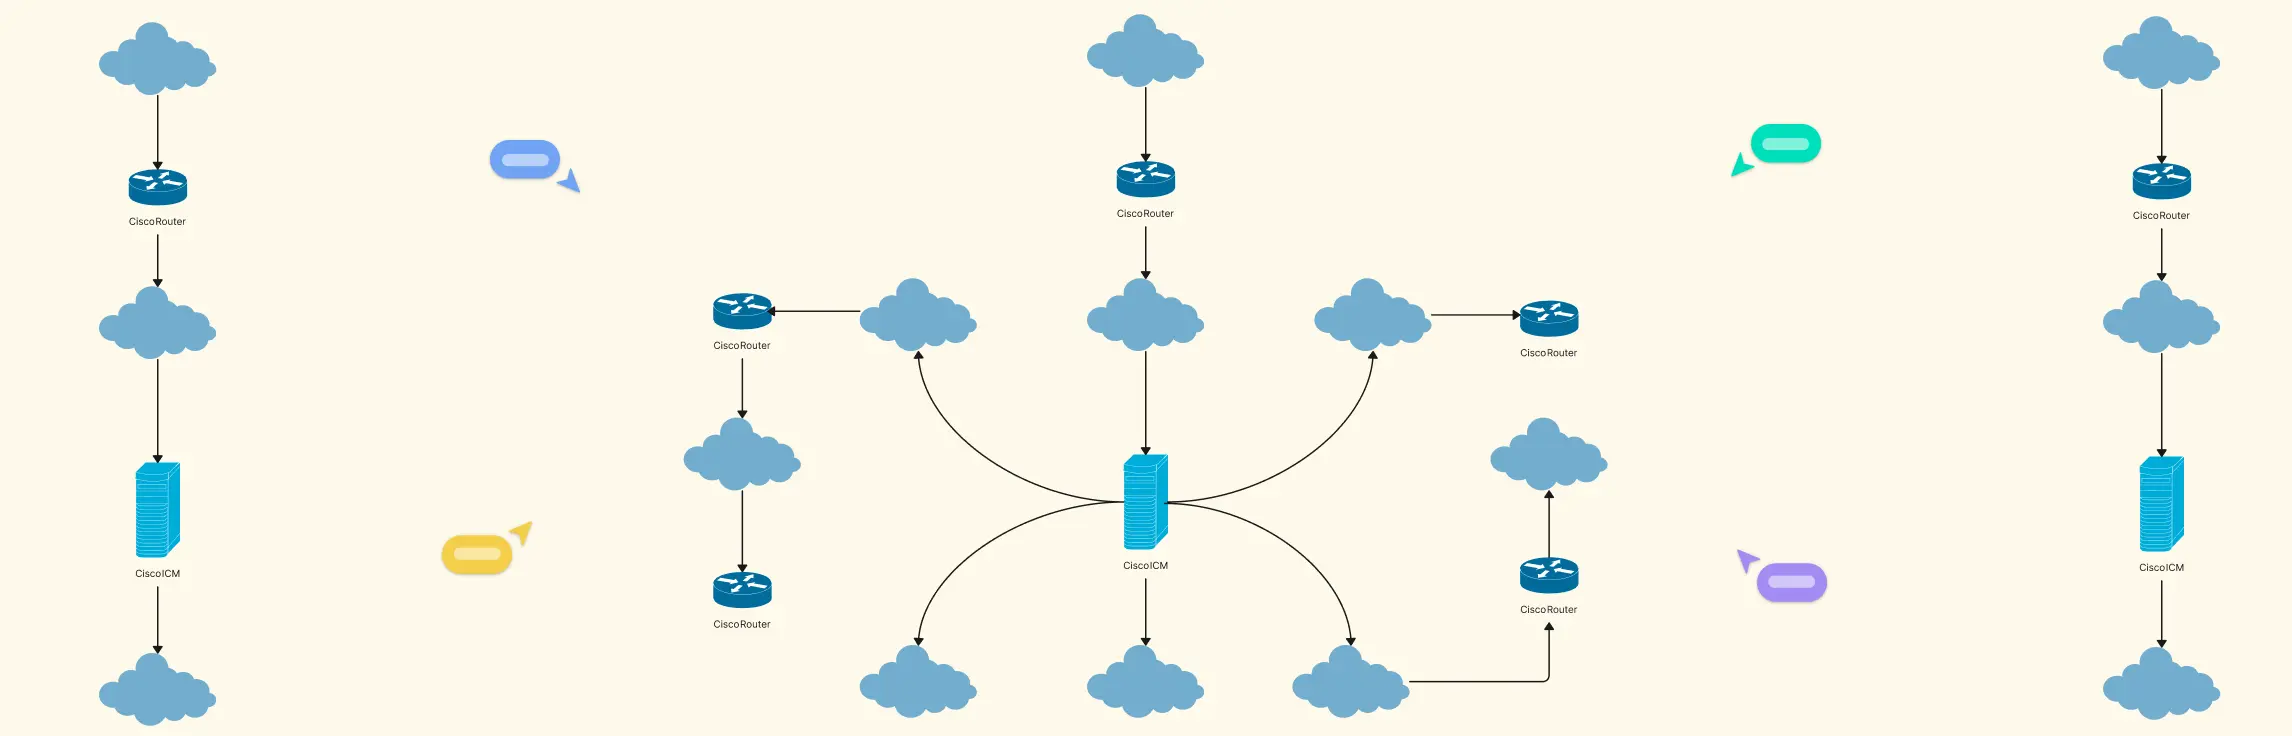
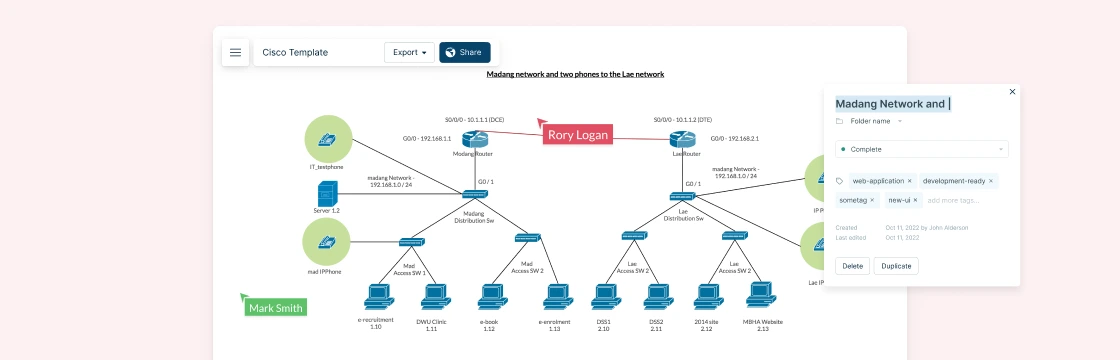
Cisco network topology diagrams play a critical role in how modern networks are designed, managed, and explained. For network engineers and IT teams working with Cisco environments, a clear visual layout of devices and connections makes it easier to plan architectures, communicate designs, and troubleshoot issues faster. In this guide, you’ll learn how to approach Cisco network topology diagrams with confidence and create visuals that are practical, accurate, and easy to understand.