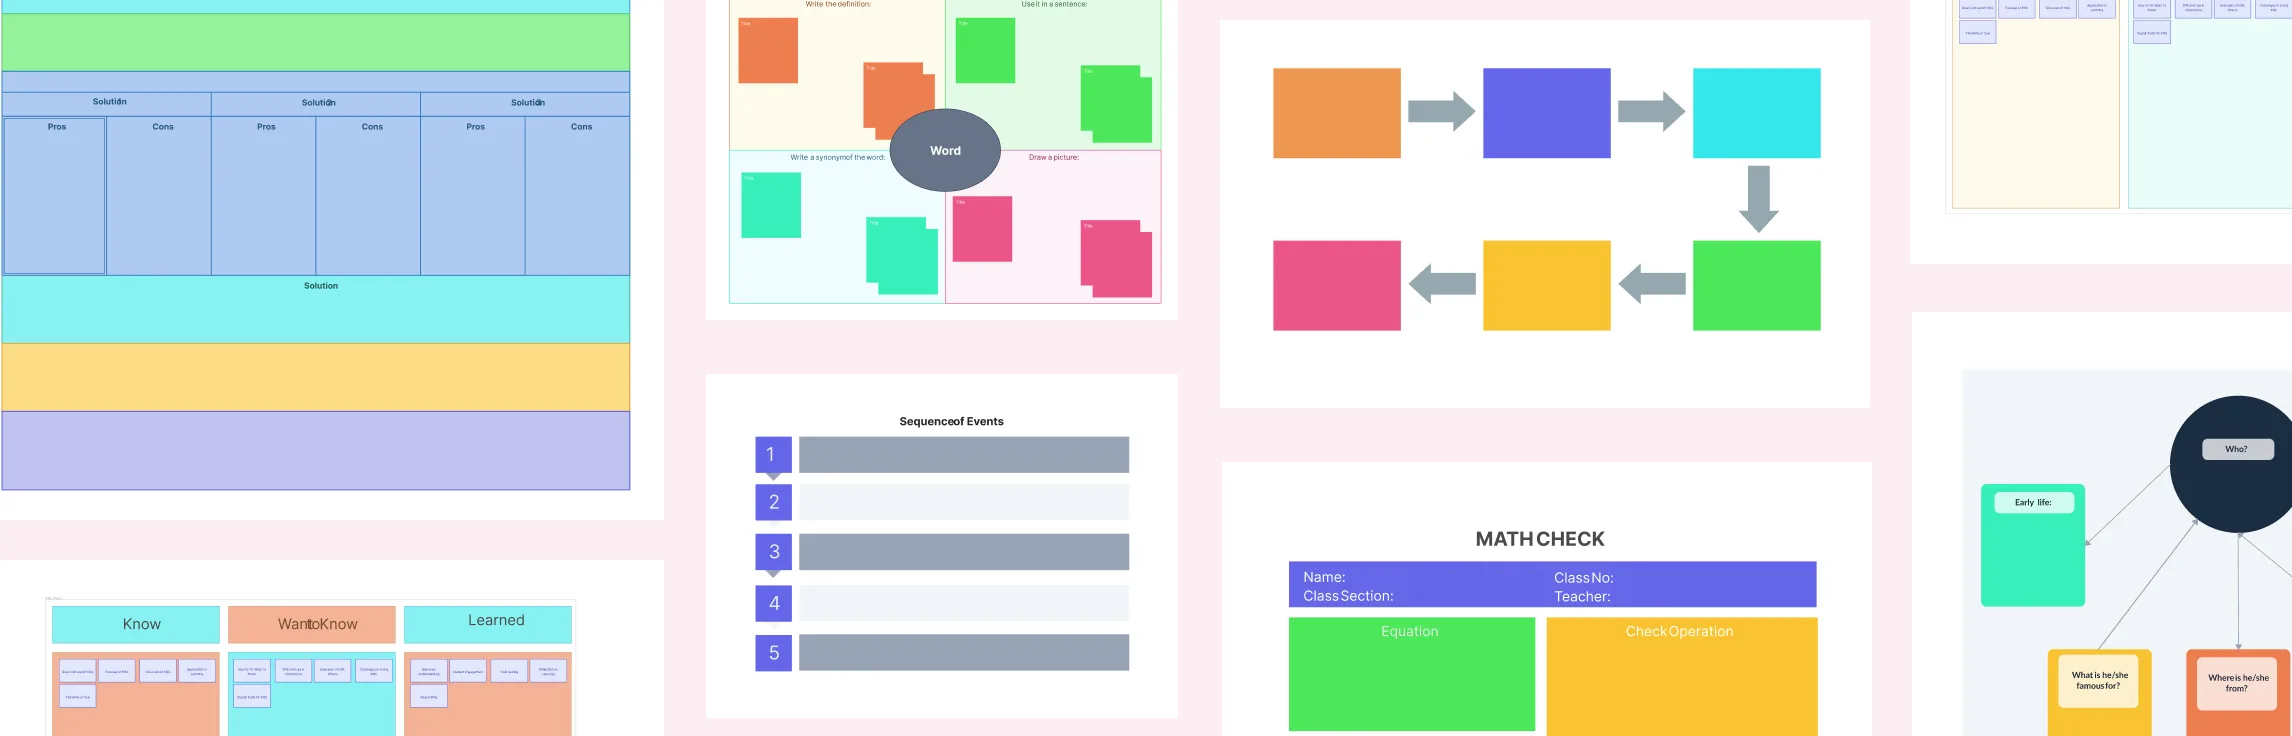
Writing doesn’t usually fail because you lack ideas, it stalls because those ideas feel scattered and hard to organize. Graphic organizers for writing help bridge that gap by giving your thoughts a clear visual structure you can build on. Whether you’re brainstorming an essay, summarizing a dense article, or planning a research paper, graphic organizers make it easier to see connections, shape your arguments, and move forward with confidence instead of staring at a blank page.
Graphic organizers for math help students break down problems, compare concepts, organize data, and see relationships visually. For teachers, they are also useful classroom resources for lesson planning, small-group work, guided practice, homework support, and math intervention.
The definition of the graphic organizer is: visual representation of information that helps organize and structure ideas, data, or concepts for easier understanding, analysis, and communication. It uses diagrams, charts, maps, or other visual layouts to break down complex topics, highlight relationships, and simplify learning or problem-solving.
Designing an inclusive curriculum that addresses the diverse learning needs of students is a key challenge for modern educators. Every student has a unique way of processing information, whether they respond better to visual aids, auditory input, hands-on activities, or independent learning. The traditional one-size-fits-all approach to education often fails to engage all learners effectively.
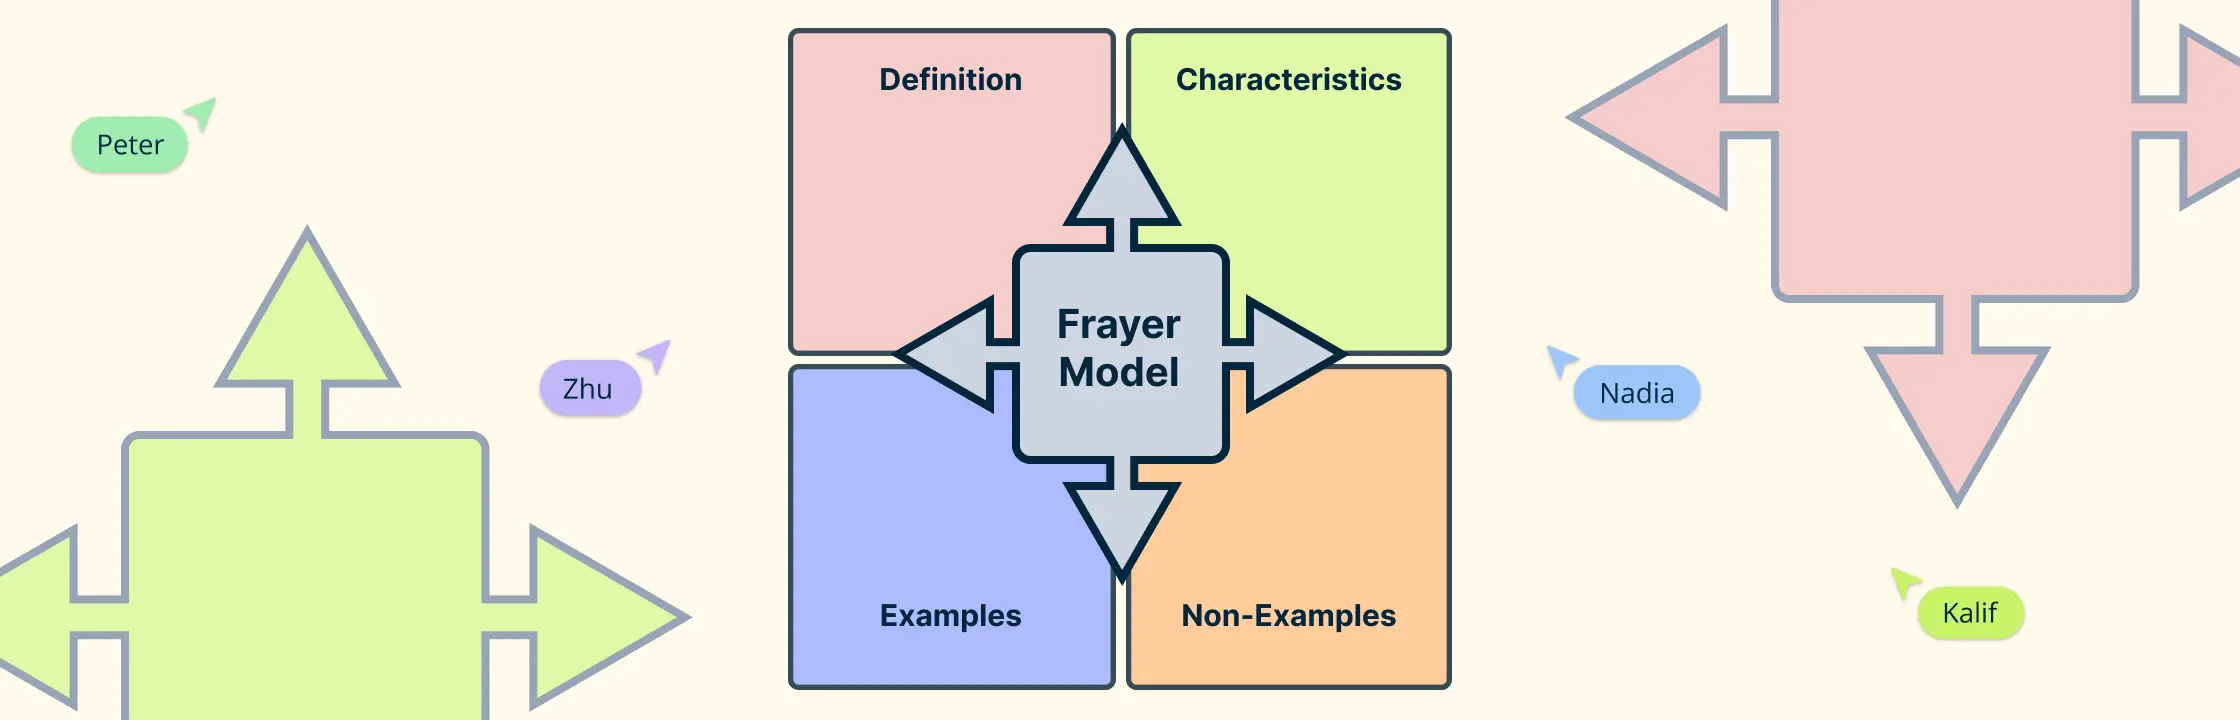
In the ever-evolving landscape of education, finding effective strategies to teach remains a persistent challenge. If you’ve ever witnessed students struggle to grasp new terms or retain complex concepts, you’re not alone. Fortunately, there’s a powerful tool at our disposal that can transform how we approach vocabulary instruction: the Frayer Model.
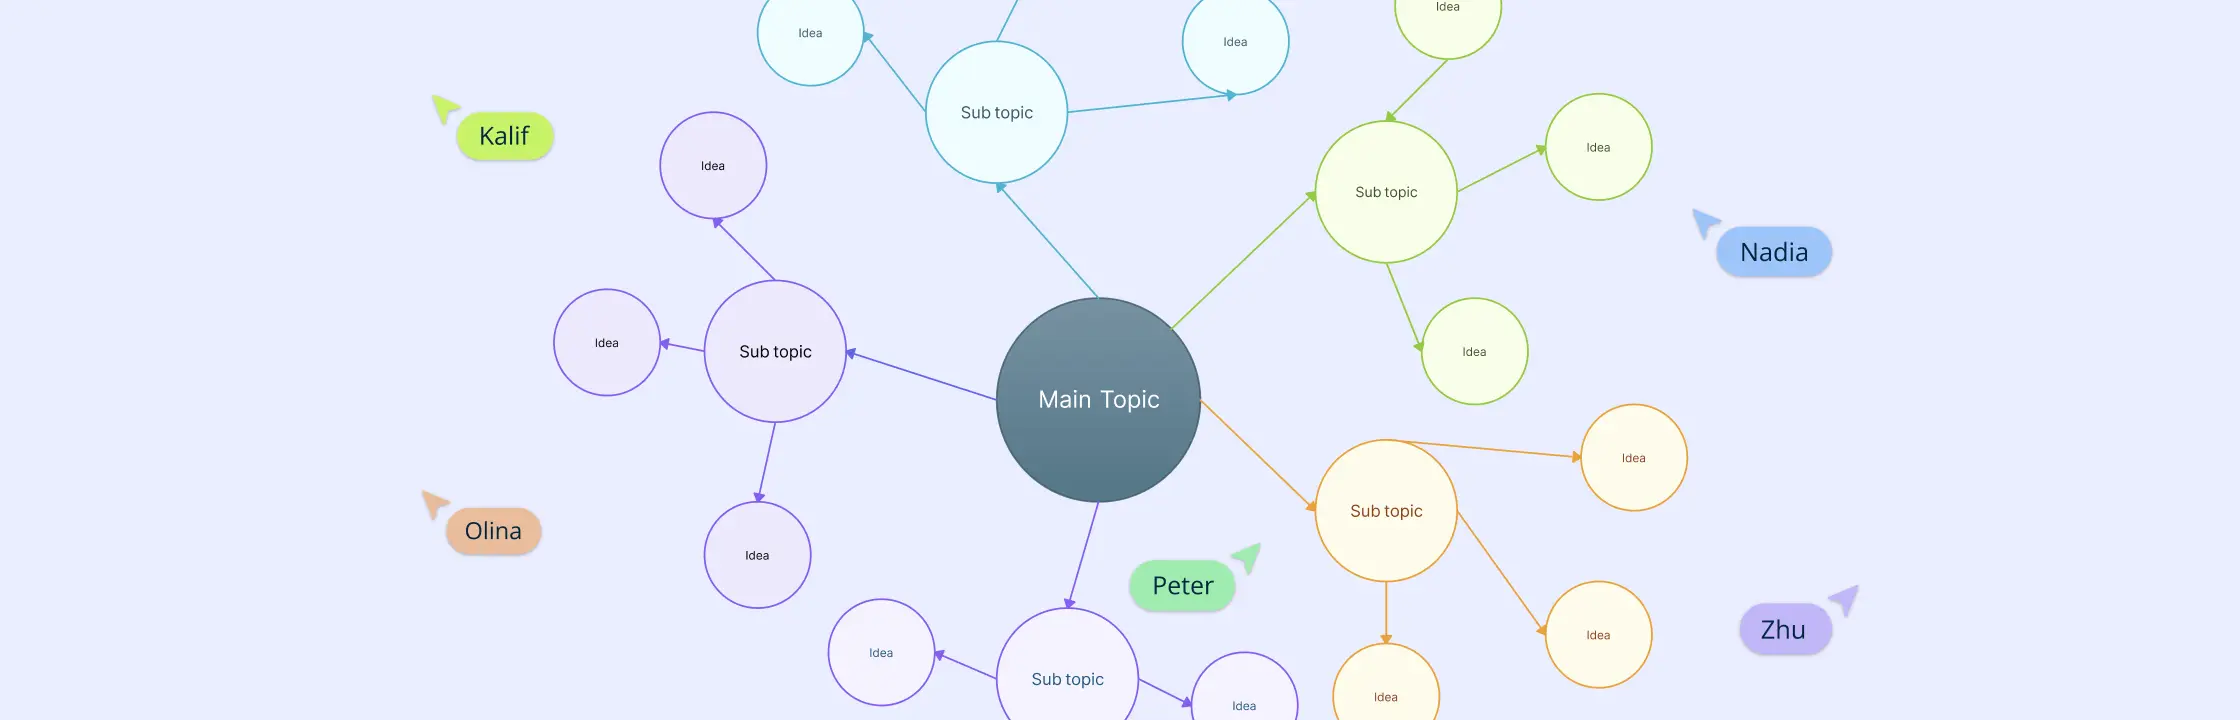
Ever felt like your brain is a jumbled mess of ideas, all fighting for attention? You’re not alone! Whether you’re planning a project, studying for an exam, or just trying to organize your thoughts, it can sometimes feel like you’re trying to untangle a giant knot of Christmas lights. That’s where cluster diagrams come to the rescue!