What is a Pedigree Chart?
A pedigree chart is a visual representation that maps the inheritance of traits or genetic conditions through generations within a family. It employs standardized symbols and lines to depict individuals and their biological relationships, making it an essential tool in genetics for tracking the occurrence and appearance of specific phenotypes.
What Does a Pedigree Chart Represent?
Pedigree charts essentially represents a family’s genealogy, highlighting the occurrence and inheritance of specific traits or genetic conditions across generations. Pedigree charts are effective tools to analyze patterns of inheritance.


Primary Components of a Pedigree Chart
Symbols: The standard symbols used include squares for males, circles for females, shaded symbols for affected individuals, and half-shaded symbols for carriers. Understanding these pedigree chart symbols is crucial for accurate interpretation.
Genders and Relationships: Males are represented by squares and females by circles. Marriage is indicated by a horizontal line connecting a male and female symbol, while vertical lines descend from the couple to their offspring, arranged from oldest to youngest.
Generations: Labeled to indicate different generations within the family.
Trait and Conditions: Different shading patterns represent various genetic conditions. For instance, a solid symbol might indicate an individual affected by a specific disorder, while a half-shaded symbol denotes a carrier.
Pedigree Chart vs. Genogram
Here are the key differences between pedigree charts and genograms.
| Feature | Pedigree Chart | Genogram |
| Main Focus | Genetic Inheritance | Social relationships and behavioral patterns |
| Symbols | Standardized (squares, circles) | Varied (lines, shapes, annotations) |
| Use Case | Genetic research | Healthcare and psychotherapy |
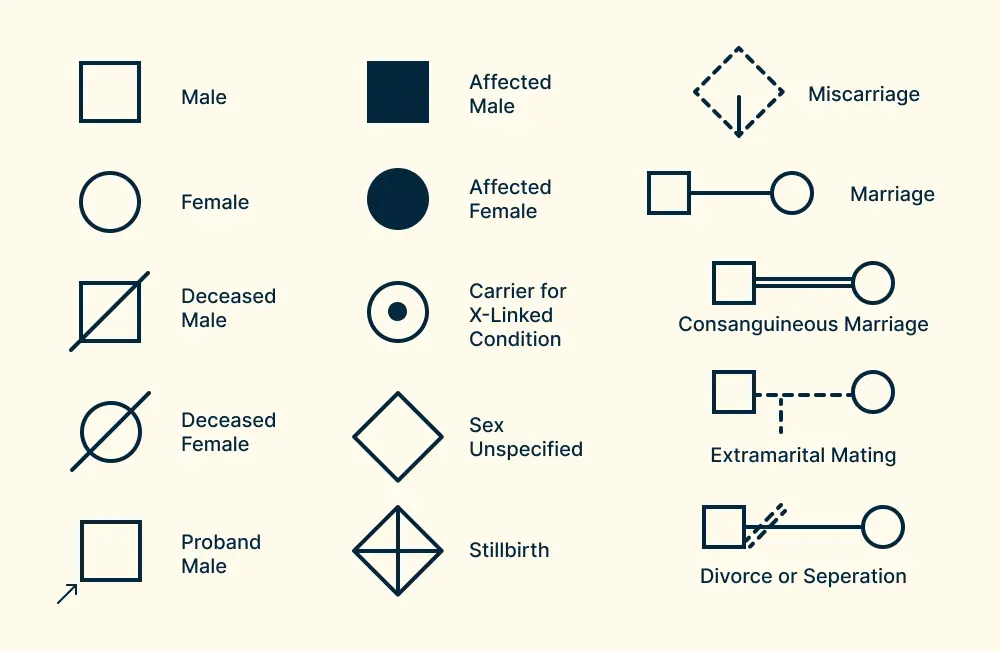
Pedigree Chart Symbols
Pedigree charts use precise symbols to denote different family members, their relationships, and health conditions.
| Standard Symbols | Genders, Relationships, and Conditions |
|---|---|
| Circles represent females; squares represent males. | Double horizontal lines indicate consanguineous relationships (e.g., between cousins). |
| Horizontal lines between symbols indicate marriages or partnerships (male typically on the left). | Adopted individuals are shown with brackets around their symbols. Dashed lines indicate adopted into the family, solid lines for adopted out. |
| Vertical lines from partnerships represent offspring. A horizontal sibling line above connects children from oldest to youngest. | Pregnancies: Use a diamond for unknown gender, a circle or square for known gender, and a triangle for pregnancies not carried to term. |
| Shading shows medical conditions: solid = affected, half-shaded = carrier. Use quadrants or cross-hatching if multiple disorders are present. | Add the individual’s current age or age at death below the symbol, along with the cause of death if available. |
| Arrows at the lower left corner of a symbol mark the proband (the person the pedigree chart is initiated from). |
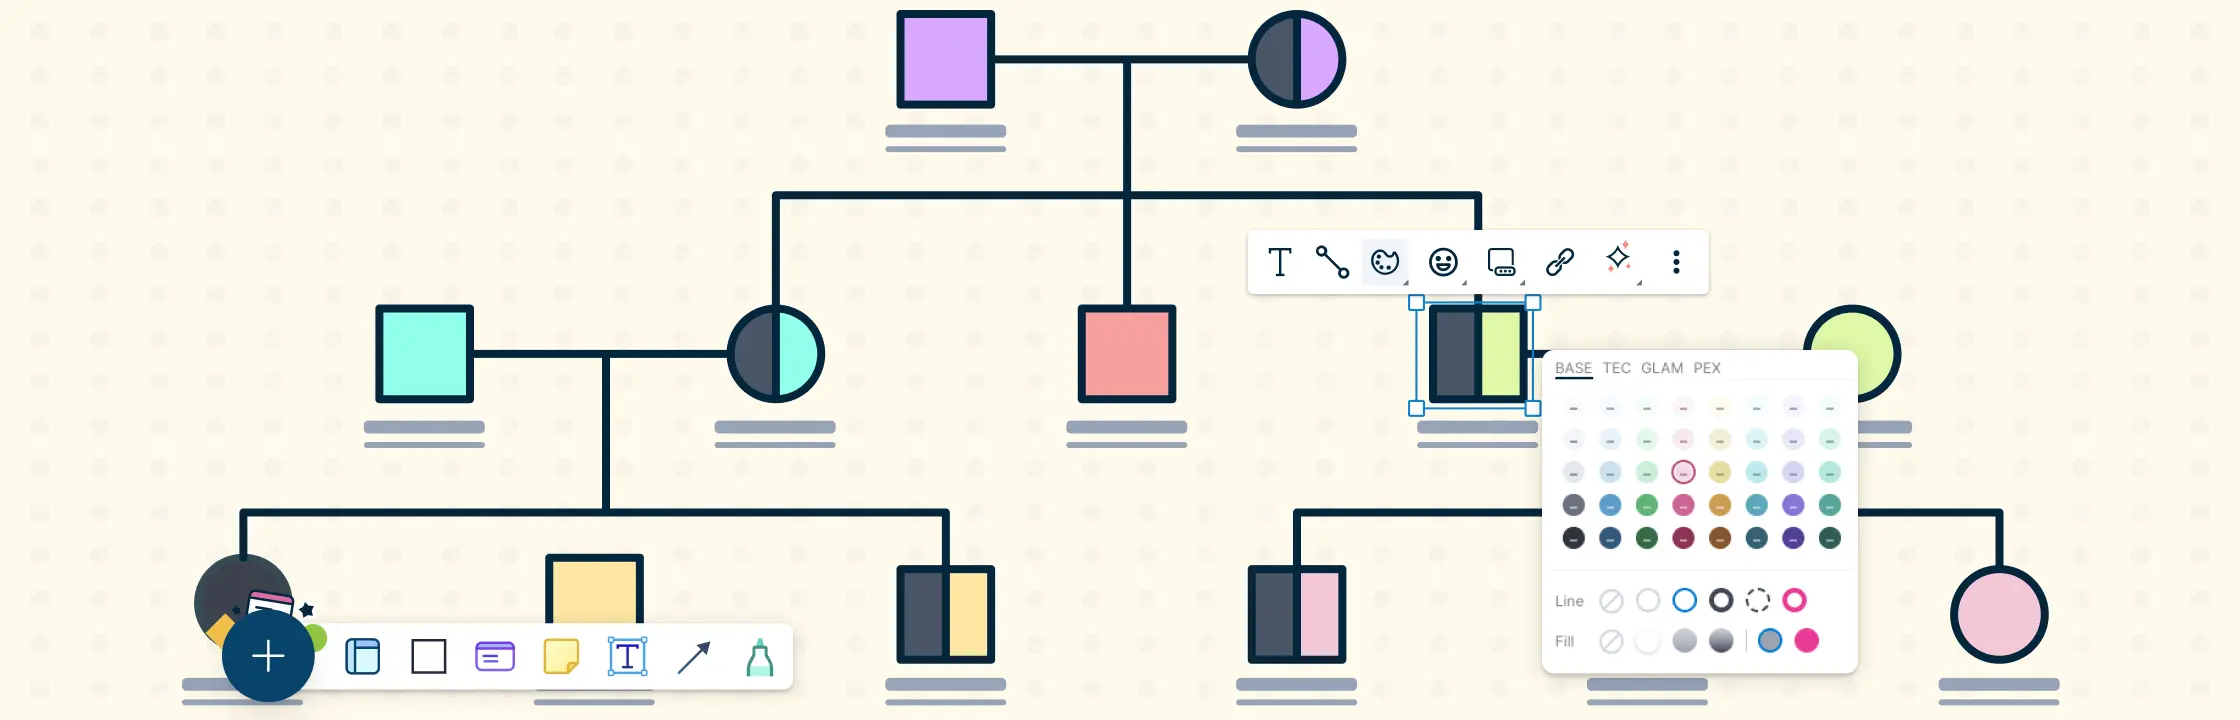
How to Create a Pedigree Chart
Step 1. Gather Information
Start by collecting relevant data for all family members, including names, genders, birth dates, and relationships. Utilize tools like interviews, family records, and genetic reports for comprehensive information.
Step 2. Select a Template
Using customizable pedigree chart templates can streamline the process. Creately offers an extensive library of templates that can be easily customized to fit your specific needs.
Step 3. Plot Individuals and Relationships
Start by drawing the proband (the person of interest) in the center. Use standardized symbols such as squares for males and circles for females. Draw horizontal lines to represent marriages and vertical lines for offspring.
Step 4. Add Details
Include essential information such as age, affected status, and any specific conditions. Symbols and shading can indicate various genetic disorders and conditions.
Step 5. Review and Refine
Verify the accuracy of the data and relationships depicted in the chart. Collaboration tools such as Creately allow multiple users to make real-time updates, ensuring the chart is accurate and up-to-date.
How to Explain a Pedigree Chart
Techniques for Interpretation
Reading a pedigree chart requires a thorough understanding of its symbols and structure. Begin by identifying the standard symbols used to represent individuals and relationships. Analyzing whether these symbols are shaded, half-shaded, or clear will reveal important details about the individuals’ health statuses and carrier statuses.
Key Patterns in Pedigree Charts
To identify key patterns, you must evaluate if traits are dominant, recessive, autosomal, or sex-linked. Dominant traits will appear in every generation. Recessive traits may skip generations, appearing only if an individual inherits two recessive alleles.
Autosomal Traits: Affect both males and females equally.
Sex-linked Traits: More commonly affect males due to the presence of a single X chromosome.
Common Symbols
Common pedigree chart symbols help interpret complex genetic information. Key symbols include:
- Unshaded Symbols: Unaffected individuals.
- Shaded Symbols: Individuals expressing the trait.
- Half-Shaded Symbols: Carriers of a trait without expressing it, commonly seen in autosomal recessive conditions.
Pedigree Chart Examples
To further illustrate the utility of pedigree charts, let’s consider some real-world scenarios.
Case Study of Hemophilia: An X-linked recessive disorder showing primarily in males with female carriers, highlighting the importance of pedigree charts in genetic counseling.
Cystic Fibrosis Inheritance: An autosomal recessive disorder with pedigree charts displaying carrier parents and affected offspring, crucial for understanding risk calculations in genetic inheritance.
Types of Pedigree Charts for Genetic Disorders
Y-linked Disorders
Y-linked disorders are genetic conditions associated with the Y chromosome, primarily affecting males. These disorders can include conditions like male infertility and some forms of hearing impairment. Y-linked disorders are passed from father to son, making their inheritance straightforward to track on a pedigree chart.

Mitochondrial Disorders
Mitochondrial disorders are caused by mutations in the DNA of mitochondria, the energy-producing organelles within cells. These disorders often affect energy-hungry organs like the brain, muscles, and heart. Unlike other genetic disorders, mitochondrial conditions are inherited maternally, as children receive their mitochondria exclusively from their mother. Pedigree charts reflect this unique inheritance pattern, highlighting affected individuals in maternal lines.

Autosomal Recessive Disorders
Autosomal recessive disorders require two copies of the mutated gene to express the condition. Common examples include cystic fibrosis and sickle cell anemia. These disorders can skip generations if both parents are carriers. Pedigree charts display this by showing affected individuals typically only when both parents carry the recessive allele.

Autosomal Dominant Disorders
Autosomal dominant disorders are caused by mutations in genes on the autosomes and require only one copy of the mutated gene to express the disease. Huntington’s disease and Marfan syndrome are examples. In pedigree charts, these disorders do not skip generations, and affected individuals have at least one affected parent.

X-linked Recessive Disorders
X-linked recessive disorders are caused by mutations in genes on the X chromosome. These disorders, including hemophilia and Duchenne muscular dystrophy, primarily affect males, as they have only one X chromosome. Female carriers can pass the mutation to their sons, who will express the disorder. Pedigree charts use specific symbols to denote carriers and affected individuals.

X-linked Dominant Disorders
X-linked dominant disorders are also related to genes on the X chromosome but require only one copy of the mutated gene to express the condition. Examples include Rett syndrome and some forms of osteoporosis. Both males and females can be affected, but males often exhibit more severe symptoms. Pedigree charts for these disorders reflect both affected parents and children.

Pedigree Chart Examples
To further illustrate the utility of pedigree charts, let’s consider some real-world scenarios.
Case Study of Hemophilia: An X-linked recessive disorder showing primarily in males with female carriers, highlighting the importance of pedigree charts in genetic counseling.
Cystic Fibrosis Inheritance: An autosomal recessive disorder with pedigree charts displaying carrier parents and affected offspring, crucial for understanding risk calculations in genetic inheritance.