This guide walks you through everything you need to know about peer-to-peer (P2P) network diagrams, from what they are and how they work, to the key elements that make them effective. You’ll explore the main P2P architectures, see real-world diagram examples like BitTorrent, WebRTC, and Gnutella, learn how to draw your own P2P network diagram step by step, and compare peer-to-peer layouts with traditional client–server networks.
What is a Peer to Peer Network Diagram?
A peer-to-peer (P2P) network diagram is a visual representation of how devices (called peers) connect and share resources directly with each other without relying on a central server. It typically shows the peers involved, their connections, and the resources being shared, making P2P systems easier to understand, explain, and troubleshoot.
For more on other types of network diagrams and their uses, read our network diagram guide.
Key Elements in a Peer to Peer Network Architecture Diagram
Peer nodes - Devices acting as both clients and servers (PCs, laptops, mobiles, edge devices).
Peer labels - Node IDs, hostnames, IPs, roles (seeder/leecher, supernode), or location/site.
Connections/links - Lines showing peer-to-peer communication paths (often many-to-many).
Network boundary - LAN, site, VPC, or “P2P overlay” boundary to clarify what the diagram represents.
Shared resources - Icons/labels for what’s shared (files, storage, compute, media streams, bandwidth).
Data flow arrows - Direction of transfer (upload/download), swarming/chunk flow, or replication paths.
Security indicators - Encryption (TLS), authentication, trust/reputation, or access permissions.
Internet + edge devices (if relevant) - ISP/Internet cloud, NAT/router icons, firewalls.
Read network diagram symbols to learn more about the specific symbols used to represent these elements in a network diagram.
Peer to Peer Network Diagram Examples
While peer-to-peer networks are commonly classified into three main architectural types—unstructured, structured, and hybrid, the examples below show how these architectures appear in real-world systems and use cases.
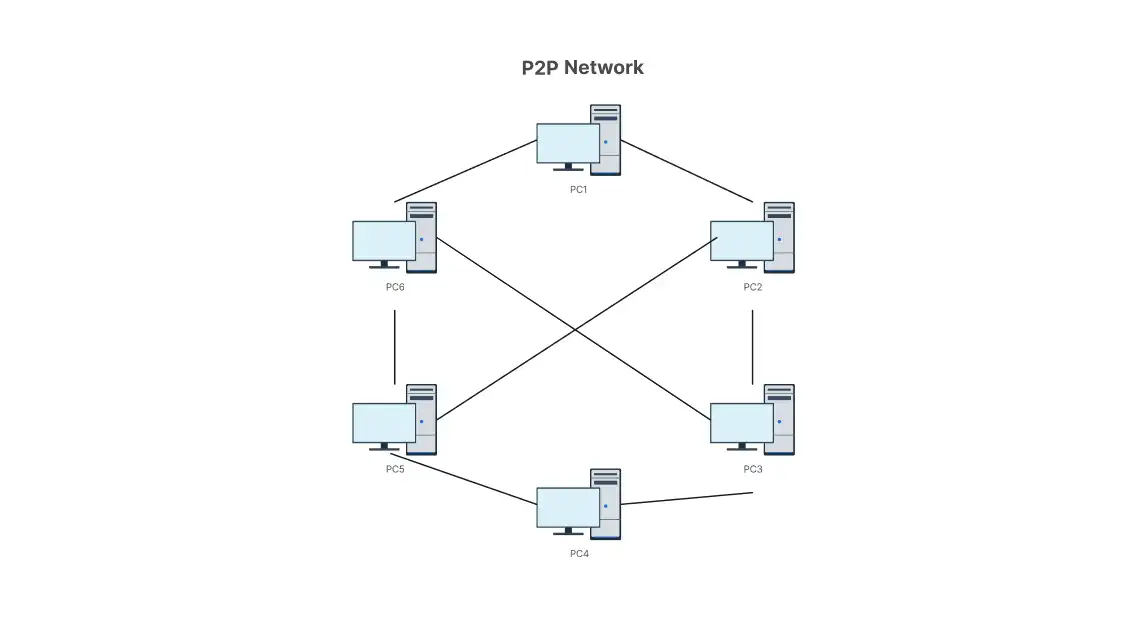
Basic Peer-to-Peer Network Scenario (General P2P)
This example shows a conceptual peer-to-peer network where multiple peers connect directly to one another to share resources. Each node can both request and provide data, demonstrating the core idea of P2P systems, distributed participation without a central server. This type of diagram is commonly used to explain the fundamentals of peer-to-peer networking rather than a specific protocol.


Swarming P2P BitTorrent Example
This diagram illustrates a swarming peer-to-peer architecture, where a client first discovers peers using a tracker or a distributed hash table (DHT). Files are split into small pieces and downloaded from multiple peers simultaneously, while the client also uploads pieces to others. This parallel sharing model improves download speed and reduces dependence on any single source.

Peer-to-Peer WebRTC Example
This example shows how two peers establish a direct, real-time connection using WebRTC. Signaling is used to exchange connection details, STUN helps discover public addresses, TURN provides a relay fallback, and ICE selects the best available connection path.

Unstructured P2P Gnutella Example (Random Peer Links)
This diagram represents an unstructured peer-to-peer network, where each peer connects to a small number of randomly chosen neighbors, forming a loose mesh. Resource discovery typically relies on query propagation across neighboring peers. While simple to implement, this approach can generate significant network traffic as the system scales.

Structured P2P (DHT-based) Kademlia Example
This example illustrates a structured peer-to-peer overlay network built on a distributed hash table (DHT). Each peer is assigned an identifier, and content is located through key-based routing rather than broadcast searches. Queries follow efficient, hop-by-hop paths, allowing the network to scale while keeping lookup costs predictable.

Hybrid P2P (Supernode Architecture) Skype Example
This diagram shows a hybrid peer-to-peer network where regular peers connect to higher-capacity nodes known as supernodes. Supernodes assist with peer discovery and routing and are interconnected to form an upper-level overlay network. This design reduces random flooding and improves discovery efficiency, while still allowing direct peer-to-peer communication for data exchange.

How to Draw a Peer to Peer Network Diagram
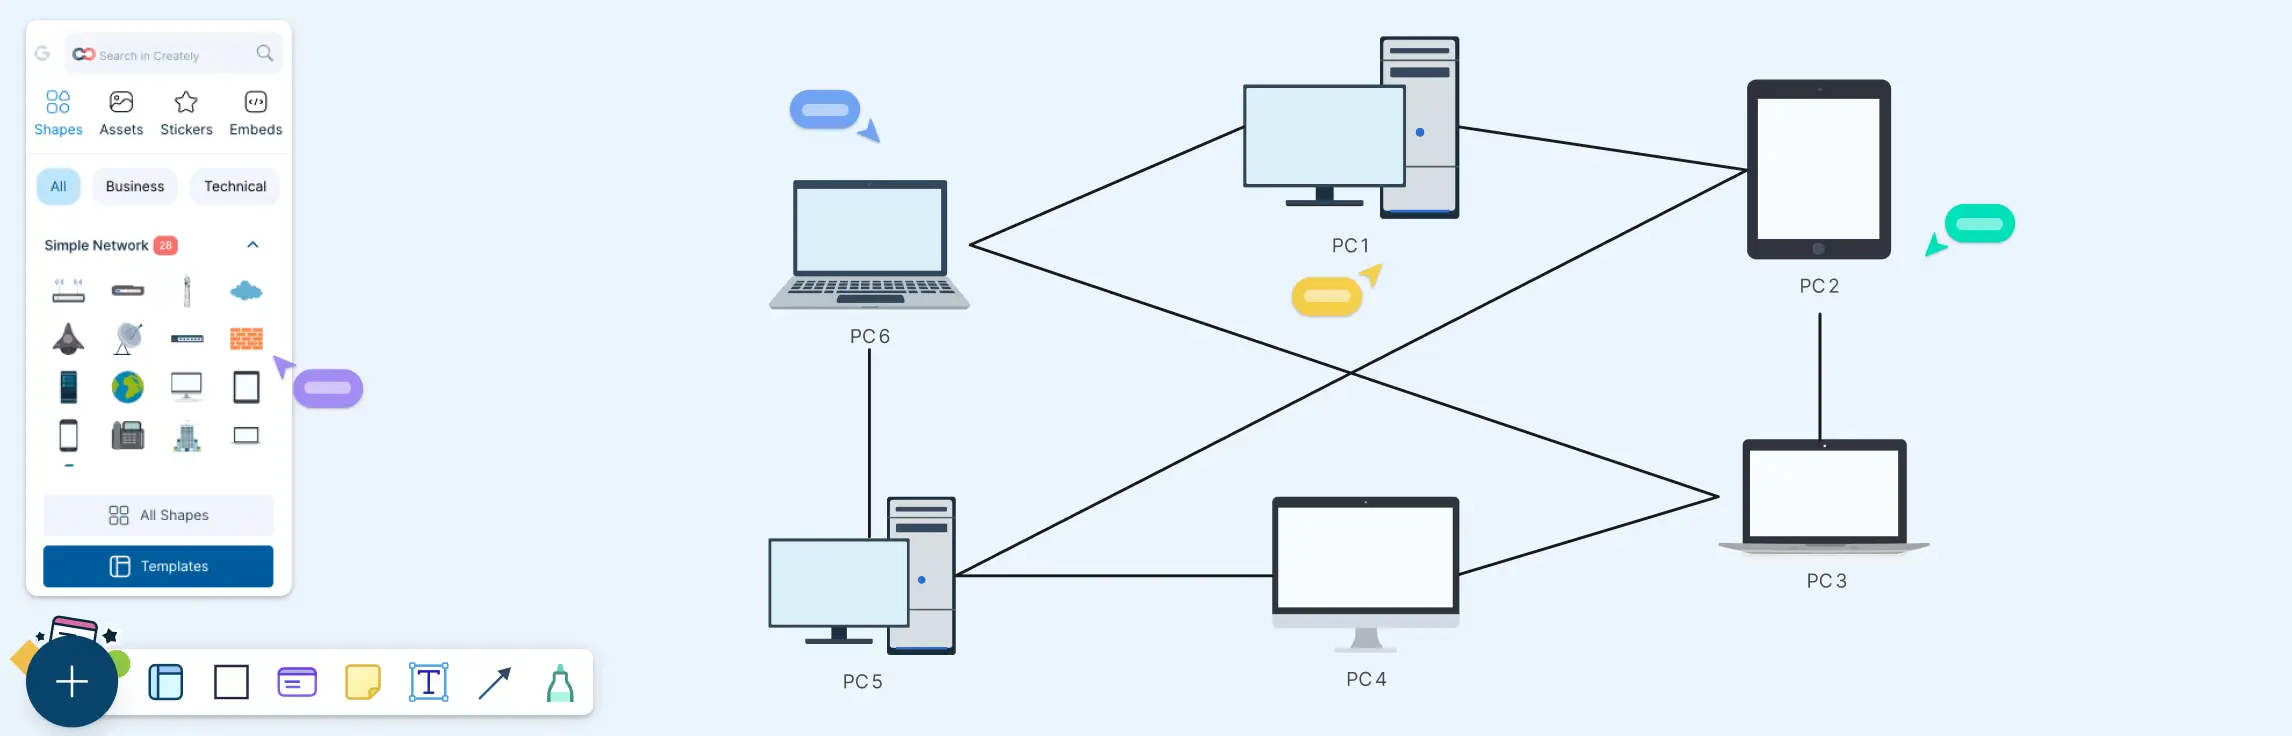
Follow these steps below using Creately’s network diagram software to design a clear, easy-to-understand peer-to-peer network diagram for documentation, planning, or learning.
Step 1 - Define the scope
Decide what you’re diagramming - a small LAN P2P setup, an internet-scale P2P system, or an application-specific P2P network (file sharing, blockchain, WebRTC).
Step 2 - Add the peer nodes
Draw each device/node as a peer (PCs, mobiles, nodes). Label them with what matters (name/ID/IP, location, role like seeder/leecher/supernode if relevant).
Step 3 - Connect peers with links
Draw the peer-to-peer connections (many-to-many). Use solid lines for active connections and dashed lines for optional/backup connections if helpful.
Step 4 - Show what’s being shared
Add simple labels/icons for shared resources (files, data, compute, bandwidth). If it’s a swarm model, note “chunks/pieces” to indicate distributed transfer.
Step 5 - Add optional supporting components
If your P2P system uses them, include - tracker/bootstrap node, DHT/overlay layer, router/NAT/firewall, relay (TURN) or STUN for connectivity.
Step 6 - Clarify flows and boundaries
Use arrows to show key data flows (upload/download, replication). Add a boundary label like “LAN”, “Internet”, or “P2P overlay” so the viewer knows what the diagram represents.
Step 7 - Finalize for readability
Group peers logically (by site, role, or region), keep labels consistent, and include a small legend for line styles/icons if you use them.
Peer to Peer Network Advantages and Disadvantages
Peer to peer technology enables devices to communicate and share resources directly without relying on a central server, offering flexibility and resilience, but it also introduces challenges in management, security, and performance.
| P2P Network Advantages | P2P Network Disadvantages |
| No central server required, reducing infrastructure cost and setup effort | Harder to manage and control due to the absence of centralized policy enforcement |
| More resilient, as the network can continue even if some peers go offline | Increased security risks related to trust, permissions, and malware exposure |
| Scales with participation, where additional peers increase total bandwidth and storage | Performance can be unpredictable and depends on peer availability and churn |
| Efficient distribution of large files or updates by spreading the load across peers | Data consistency and version control are harder without a central authority |
| Direct resource sharing enables faster exchanges, especially on local networks | Discoverability and connectivity challenges due to NAT, firewalls, or reliance on trackers/DHT |
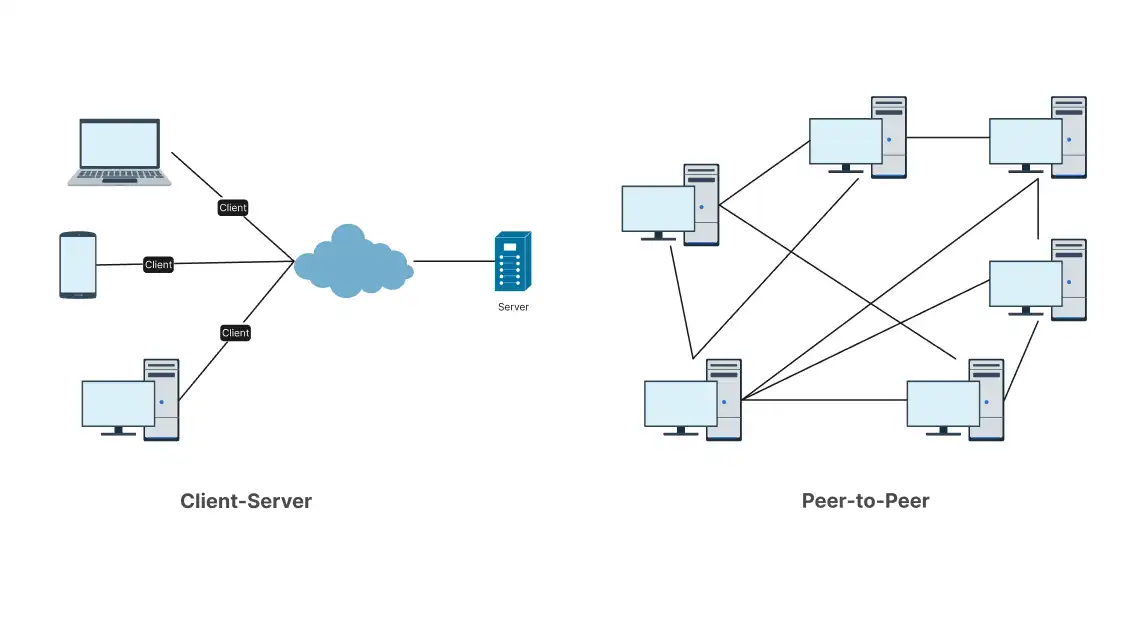
Differences between Client-Server and Peer to Peer Network Diagrams
Client–server network diagrams typically show a centralized setup which is common in LAN environments (office file/app servers), WAN deployments (branch offices connecting to a central data center), and internet applications, while P2P networking diagrams visualize direct, distributed connections between nodes; the comparison below highlights how the two diagram types differ.
| Diagram Feature | Client–Server Network Diagram | Peer-to-Peer Network Diagram |
| Primary visual pattern | Hub-and-spoke (clients around a central server) | Mesh or partial mesh (peers connected to multiple peers) |
| Main nodes shown | Distinct node roles - Server(s) and Clients | Mostly same role nodes - Peers/Nodes (sometimes supernodes) |
| Where connections point | Many client links converge on server(s) | Links spread across nodes (many-to-many) |
| Typical labels | Server hostname/service (DB, API, Auth) + client devices | Node IDs/peer names + shared resource or capability per peer |
| Data flow arrows | Requests/responses typically shown client → server → client | Direct transfers shown peer ↔ peer (often multiple simultaneous flows) |
| Central components | Often includes load balancer, gateway, DNS, database behind server | May include tracker/bootstrap/DHT entry (optional, not always central) |
| Failure/critical nodes shown | Server(s) highlighted as critical; redundancy may be drawn | No single “main” node; resilience implied by multiple peer links |
| Boundary depiction | Clear server zone (data center/VPC) vs client zone (internet/LAN) | Often drawn as an “overlay network” spanning internet/LAN peers |
| Level of detail emphasis | Service architecture (tiers: web/app/db) | Connectivity and sharing behavior (peer discovery, swarming, replication) |
Read wide area network diagram and local area network diagram guides to discover more about how these networks work, their diagrams and applications.
Helpful Resources for Building Network Diagrams
Learn about the different types of network diagrams with examples.
Discover the different types of network topology and their use cases.
Learn about the Home Network Diagram and its applications.
FAQs about Peer to Peer Network Diagrams
Do peer-to-peer network diagrams need to show every peer in the network?
How do peer-to-peer network diagrams handle peers joining or leaving the network?
Can peer-to-peer network diagrams show data flow?
How do peer-to-peer network diagrams represent scalability?
Resources
Eng Keong Lua, et al. “A Survey and Comparison of Peer-To-Peer Overlay Network Schemes.” IEEE Communications Surveys & Tutorials, vol. 7, no. 2, 2005, pp. 72–93, https://doi.org/10.1109/comst.2005.1610546.
Khambatti, Mujtaba, et al. “Structuring Peer-To-Peer Networks Using Interest-Based Communities.” Lecture Notes in Computer Science, 2004, pp. 48–63, https://doi.org/10.1007/978-3-540-24629-9_5.