Projects move faster when everyone understands who is involved, how people work together, and where execution responsibility sits. This guide explains how to create an org chart for project teams, what roles to include, how to show collaboration structure, and how to make the execution layer visible so the team can work with more clarity and less confusion.
What Is an Org Chart for a Project Team
An organizational chart for a project team is a visual representation of the people involved in delivering a specific project and how they are connected. It shows who leads the work, who supports it, and who is responsible for carrying out the day-to-day tasks that move the project forward.
Unlike a general company org chart, a project team organizational chart is built around the team assembled for a specific initiative. It focuses on how the project team functions in practice, making it easier to understand reporting relationships, collaboration paths, and execution responsibilities.
Why Project Teams Need a Dedicated Org Chart
Project teams often bring together people from different departments, specialties, and workstreams. Even when roles are documented, day-to-day collaboration can become unclear once execution begins. A dedicated project team org chart gives everyone a shared view of how the team is structured and how work connects.
Clarifies team roles by showing who leads, who contributes, and who supports each part of the project
Makes collaboration easier to understand across cross-functional teams and shared workstreams
Connects planning to execution by showing not just oversight, but also who is responsible for delivery
Helps new team members onboard faster by giving them quick context on the team and reporting structure
Reduces overlap and confusion by making ownership, handoffs, and decision paths more visible
Steps to Create an Org Chart for Project Teams
Creating a project team org chart in Creately’s org chart software is easier when you build it around how the team actually delivers work. You can start with a spreadsheet or a blank canvas, then map reporting lines, project roles, and team members in one place.
Step 1. Import your team data or start from scratch
Start with the fastest option available.
- Import a spreadsheet if you already have team data
- Start with a blank canvas if you want to build the chart manually
Creately’s CSV import wizard can recognize common columns such as Name, Title, Manager, Department, Employee ID, Hire Date, and Position Title and map them automatically. It also validates the data before import, helping you catch issues like missing IDs, unknown managers, reporting cycles, and empty rows early.
Step 2. Build the reporting structure
Create the main hierarchy first.
Start with the core project roles, then build downward. This usually includes roles such as:
- project sponsor
- project manager
- delivery lead
- business lead
- team leads or workstream leads
Creately’s auto-layout arranges the chart into a clean hierarchy automatically. If you are building it manually, use the blue connection dots on each card to add direct reports quickly without redrawing the chart each time.
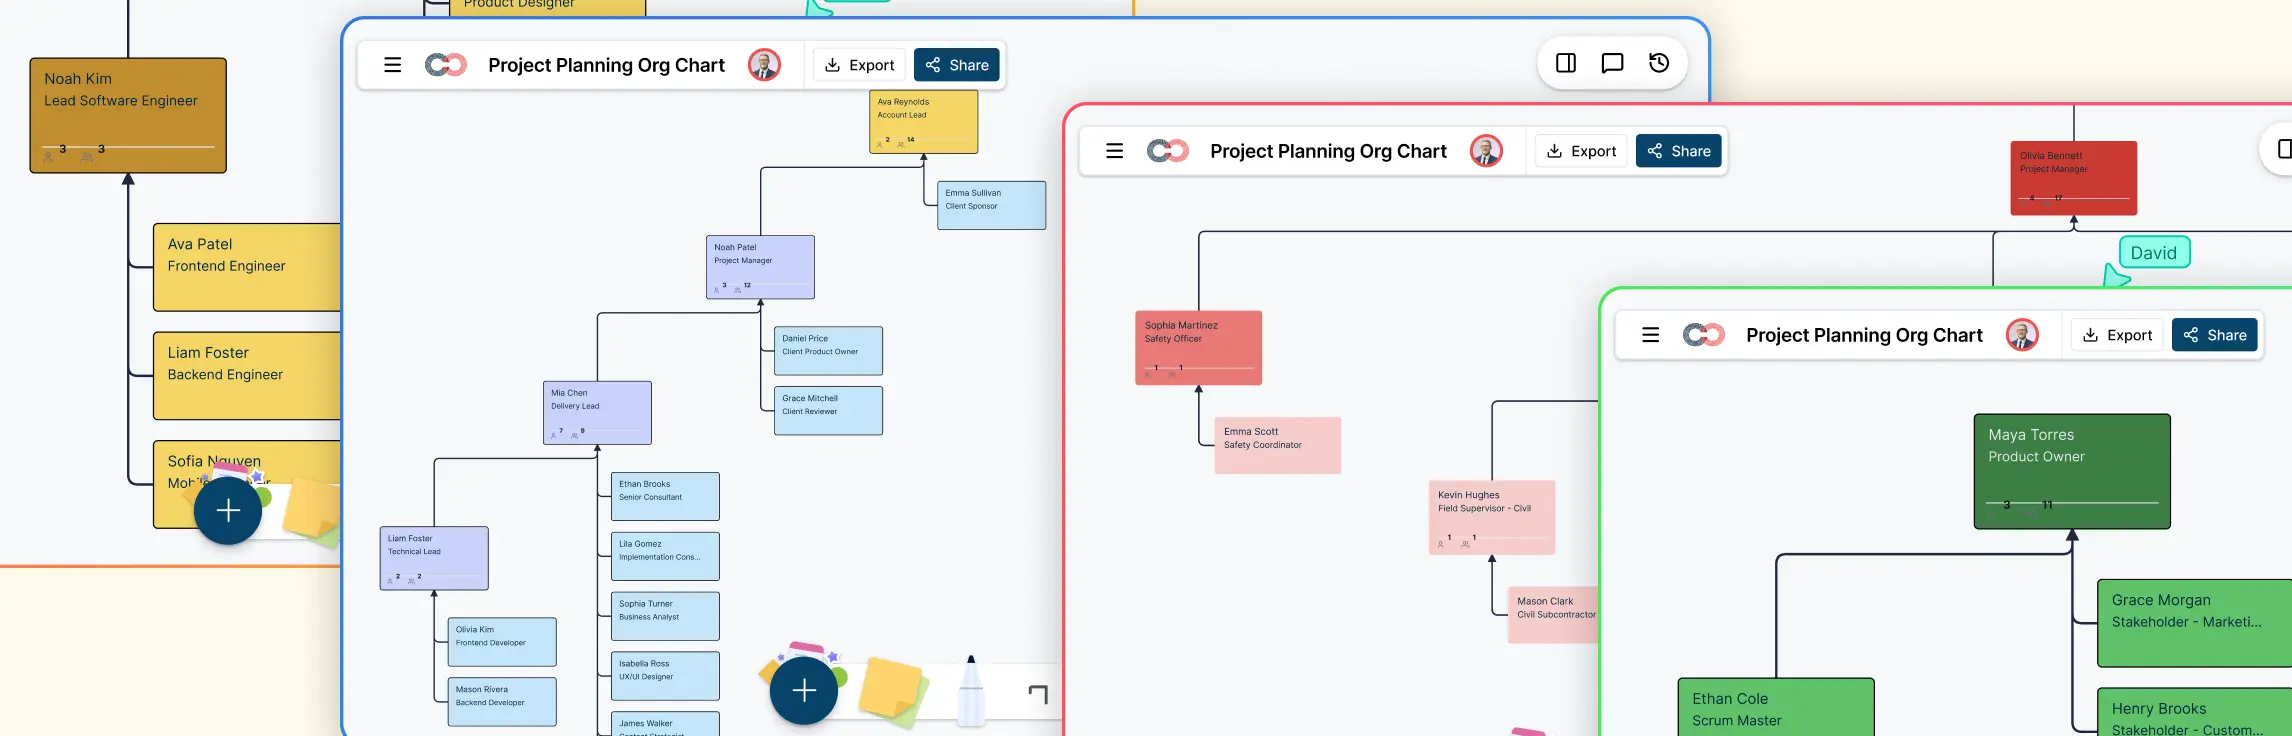
Step 3. Add the leadership, collaboration, and execution layers
Organize the chart into three clear layers.
Leadership layer – project sponsor, project manager, delivery lead, or business lead
Collaboration layer – functional leads, technical leads, workstream owners, or subject matter experts
Execution layer – the people doing the actual project work
This makes the org chart easier to understand because it shows how the team is set up to lead, coordinate, and deliver. In Creately, you can also combine person, team, and project entities when the structure needs to show more than a basic hierarchy.
Step 4. Add project teams and cross-functional members
Show how people come together for the project.
If the project pulls people from different departments, add a project entity or team entity to the canvas and assign members directly from the org chart.
Creately’s Pick Members mode lets you click people anywhere on the chart and add them to the project roster. This is especially useful for cross-functional teams because it shows both:
- where people sit in the organization
- how they are assigned to the project team
Step 5. Show reporting lines and collaboration lines
Make the structure realistic, not just hierarchical.
Use different line styles to show how the team actually works:
- solid lines for direct reporting
- dashed gray lines for dotted-line reporting
- matrix relationships for cross-functional team structures
This helps the org chart reflect both formal accountability and day-to-day collaboration, which is often essential in project teams.
Step 6. Add role details that improve clarity
Make each card more useful.
Once the structure is in place, update each person card with the details that help the team understand responsibilities more clearly. In Creately, you can:
- click a card to edit properties
- double-click for quick inline edits
- keep extra spreadsheet columns as custom properties after import
Useful details to add may include:
- workstream
- responsibility area
- team lead
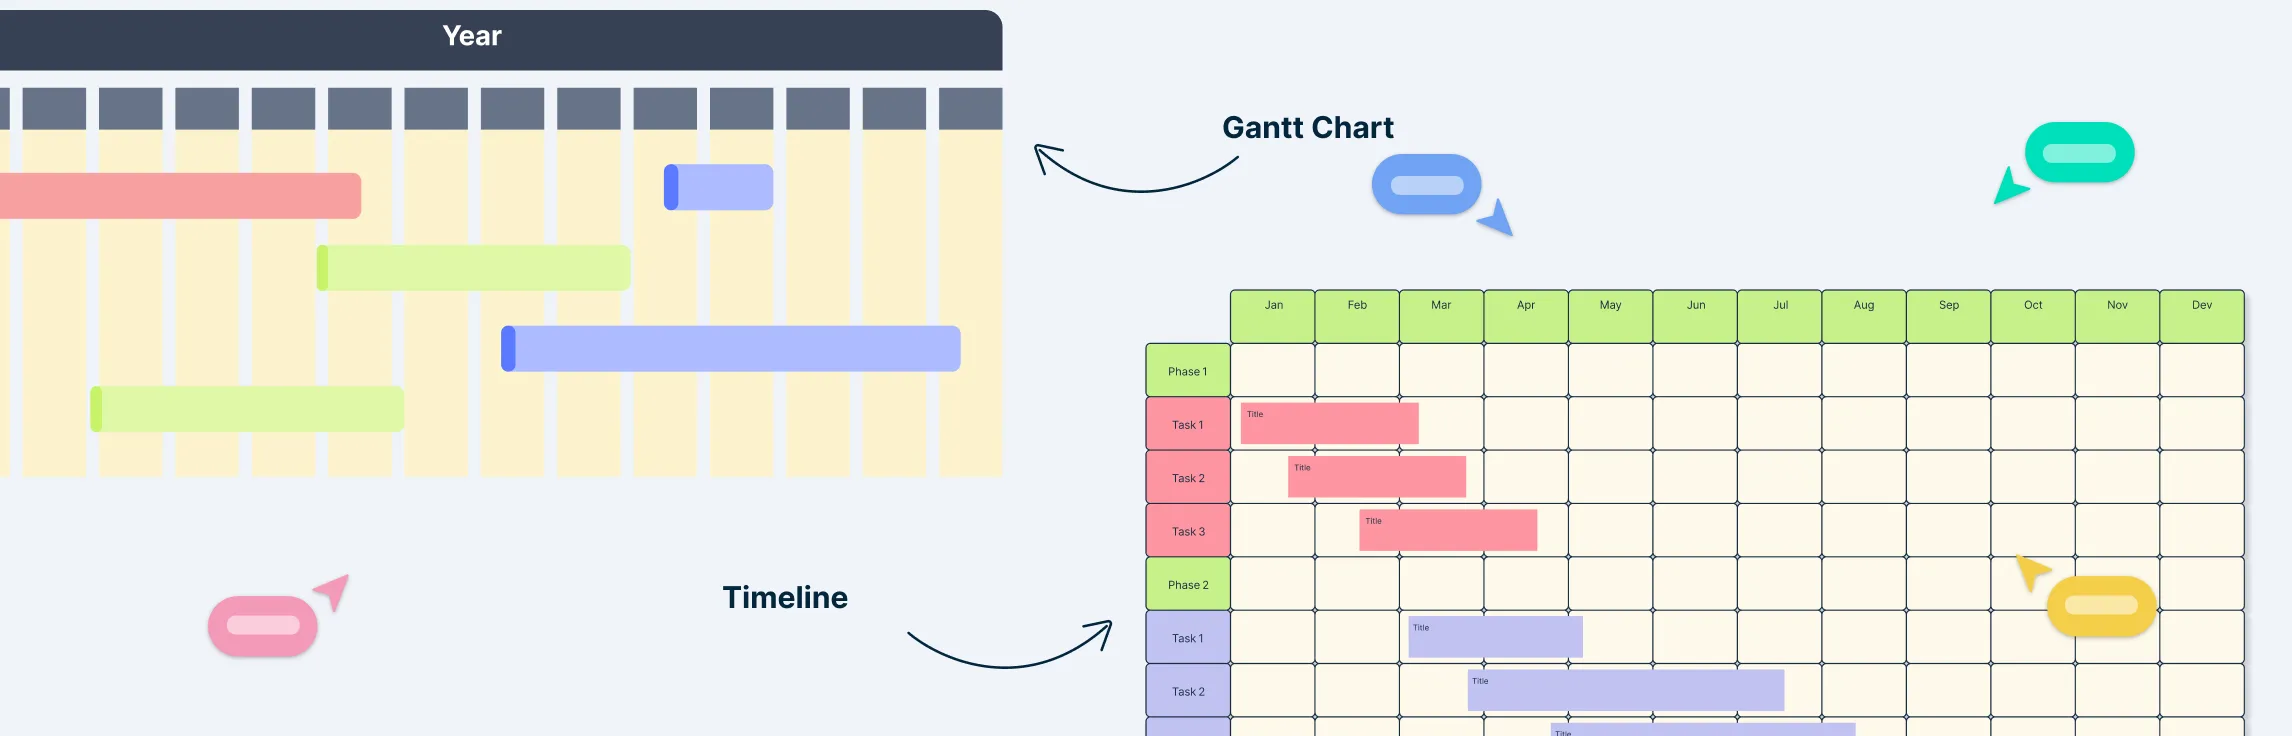
- project status
- timeline
- staffing model
This makes the chart more helpful for both planning and day-to-day execution.
Step 7. Review the chart visually
Check whether the chart reflects how the team actually works.
After mapping the structure, review the chart with project leads or key stakeholders. In Creately, you can make this easier by using:
- collapsible branches to hide areas you do not need
- compact or full card views depending on how much detail you want to see
This helps you verify whether reporting lines, workstreams, and staffing reflect the real delivery setup.
Step 8. Keep the chart updated as the team changes
Treat the project team structure chart as a living workspace.
Project teams change as people join, responsibilities shift, or workstreams expand. Creately makes it easier to keep the chart current with features such as:
- real-time auto-save
- collaborative editing
- undo for bulk changes, including CSV imports
That helps the org chart stay aligned with the actual project team throughout delivery instead of becoming outdated after setup.
How to Choose the Right Structure for Your Project Team Org Chart
The best org chart structure is the one that reflects how your project team actually works. Rather than choosing a format based only on hierarchy, build the chart around how people are grouped, how they collaborate, and how responsibilities are shared.
Functional-heavy project teams
In this structure, most team members stay grouped by department or specialty. It works best when the project is delivered mainly through existing functional teams and there is limited cross-functional coordination.
Cross-functional project teams
This structure is better for projects that rely on close collaboration between different specialties. It is useful when teams such as product, design, engineering, operations, and marketing all work together toward the same outcome.
Matrix project teams
A matrix structure works well when team members report to both a functional manager and a project lead. In these cases, the org chart should show both direct accountability and dotted-line collaboration clearly.
Examples of Project Team Org Charts by Team Setup
Different projects require different team structures. Here are a few common setups where a project team org chart can be especially useful with ready to use examples of project team organizational charts.