Genograms are widely used in research and professional practice to analyze patterns across families. But when each case is documented differently, comparing genograms becomes difficult. Missing data fields, unclear relationship details, and undocumented sources can reduce the reliability of family datasets, even when a genogram looks visually complete. A genogram data completeness score helps researchers evaluate whether a genogram contains the structured information needed for analysis, assessment, or documentation.
In this guide, you’ll learn how completeness scoring works, how to apply a practical 0–100 scoring framework, and how to maintain consistent genogram reliability in research across multiple cases.
What Is Genogram Data Completeness?
Genogram data completeness refers to how much of the required information for a genogram has been captured.
A research-ready genogram typically includes:
- All relevant family members within the defined study scope, including required generations and kinship links
- Standardized demographic variables, such as age or birth year, sex or gender category, and living or deceased status
- Study-relevant events, conditions, or behavioral variables, recorded using consistent definitions
- Clearly defined biological, legal, or social relationship indicators to support accurate family structure analysis
- Documented data sources for key information, such as interviews, records, or verified reports
- Explicit markers for unknown, missing, or not-applicable data, enabling transparent completeness assessment
Why Completeness Matters for Research Quality
Genogram data completeness refers to how much of the required information for a genogram has been captured. A genogram can look complete visually while still missing critical structured data needed for analysis.
Incomplete genograms can lead to:
- Missed patterns: Hereditary or behavioral trends may remain hidden if key family members or conditions are not documented.
- Unreliable comparisons: When different genograms contain different levels of detail, comparing them becomes difficult.
- Bias in research findings: Missing data or unevenly documented data can distort interpretation, especially when comparing multiple families or case groups.
- Reduced reproducibility: Future researchers may struggle to interpret or verify the findings if the original data is incomplete.
In this guide, research readiness means a genogram contains enough structured, interpretable, and documented data to be used reliably in analysis or compared across cases.
What Is Data Completeness Scoring?
Data completeness scoring answers an important question:
Is this genogram ready for analysis?
Instead of relying on subjective judgment, researchers assign a completeness score based on how much of the required information has been captured.
A data field is generally considered complete when:
- The information is present
- The data is interpretable
- The information is relevant to the genogram’s purpose
- The source is documented when necessary
- Unknown values are clearly marked
Using a scoring system helps teams evaluate genograms consistently across cases and datasets.
The 0–100 Genogram Completeness Scoring System
A practical way to measure genogram completeness is to use a 0–100 scoring scale.
This percentage reflects how much of the required information has been captured for the genogram’s intended use.
| Score Range | Category | Description |
|---|---|---|
| 0–19 | Empty | Minimal structure or only a few individuals recorded. Not usable for analysis. |
| 20–39 | Minimal | Basic family structure present but missing key variables or relationships. |
| 40–59 | Basic | Core relationships are included with some attributes, but many gaps remain. |
| 60–79 | Good | Most required fields captured; suitable for many analyses with some limitations. |
| 80–100 | Complete | Required data fields largely filled, sources tracked, and unknown values documented. |
The exact thresholds can be adjusted by study design, but the scale provides a practical shared framework for team review.
Example scoring model
A practical scoring system may weigh different data components:
- Family structure completeness — 40%
- Required field completeness — 30%
- Source documentation — 15%
- Certainty or unknown markers — 10%
- Review or verification status — 5%
Weighted scoring ensures that critical variables influence the score more than optional data.
Core Fields Every Research Genogram Should Capture
While genograms vary by purpose, certain data elements appear in most research-quality family datasets.
Individual information
- Unique identifier or research ID
- Sex or gender category used in the study
- Birth year or age
- Living or deceased status
Family structure
- Parent–child relationships
- Partner relationships
- Sibling relationships
- Biological vs adoptive or step relationships
Health or life events
- Significant conditions
- Major life events
- Age of onset when relevant
Documentation information
- Data source
- Certainty level
- Unknown value marker
- Last update date
In practice, many research teams track data sources and note uncertainty so they can evaluate how reliable each data point is, particularly when information comes from interviews or historical records.
Use-Case Specific Required Fields
Not all genograms collect the same information. The required fields depend on why the genogram is being created. For example, medical genograms focus on hereditary conditions, while therapy genograms explore emotional dynamics.
| Genogram Type | Typical Required Fields | Purpose |
|---|---|---|
| Medical Genograms | Multi-generational biological relationships, demographic data (sex, age or birth year), death information, diagnoses and age of onset, relevant ancestry, reproductive history, genetic testing results | Supports identification of hereditary disease patterns and genetic risk assessment |
| Therapy Genograms | Relationship quality indicators, emotional patterns, conflict or alliance structures, significant life events or trauma, cultural and migration context, key non-biological relationships | Helps analyze family dynamics and systemic influences on behavior |
| Social Work Genograms | Caregiving roles, household composition, guardianship or custody context, support networks, service involvement, risk and protective factors, family disruptions | Supports assessment of family functioning and social support systems |
| Legal Genograms | Verified kinship links, marital and adoption history, inheritance-relevant relationships, beneficiary structures, documentary evidence, disputed or legally contested relationships | Clarifies legally recognized family relationships for case analysis and documentation |
| Research Genograms | Study identifiers, standardized coded variables, operational definitions, documented data sources, certainty indicators, missing-data markers, review or update records | Supports consistent coding, transparent missing-data handling, and comparability across genogram datasets |
How to Calculate a Genogram Completeness Score
Calculating a genogram completeness score provides a practical way to estimate how ready a genogram is for analysis. Rather than assuming a diagram is usable, researchers can review whether the required information has been captured.
The 0–100 scoring approach described here is one useful framework for evaluating completeness. It can be adapted depending on the study design, professional context, or documentation requirements.
Step 1 — Define the Required Fields
Start by identifying the information your genogram needs to include based on its intended use.
For example:
- Medical genograms may prioritize diagnoses and age of onset
- Therapy genograms may emphasize relationship dynamics
- Research genograms may require study identifiers and source tracking
These required fields form the baseline dataset used to assess completeness.
Step 2 — Review Recorded Data and Information Sources
Next, examine whether each required data element has been documented.
At this stage, it is also important to record where the information came from.
Family data may originate from multiple sources, such as:
- participant or family interviews
- medical or clinical records
- birth, death, or marriage certificates
- census or historical records
- probate or legal documentation
- genetic testing results
- researcher inference based on available evidence
Recording information sources helps researchers judge whether data is verified, estimated, or uncertain, and makes completeness assessments easier to interpret.
If information is unavailable, mark it as “Unknown” rather than leaving the field blank.
Step 3 — Estimate the Completion Percentage
A simple way to evaluate completeness is to compare the number of required fields captured with the total number of fields defined for the genogram.
Example:
Required fields: 20
Completed fields: 15
Estimated completeness score:
15 ÷ 20 = 75%
This percentage provides a general indication of how complete the dataset is.
Step 4 — Interpret the Result
Researchers can use completeness ranges as a practical guide to assess readiness for analysis.
For example:
- 0–19 — Very limited information recorded
- 20–39 — Basic structure present but major gaps remain
- 40–59 — Some key data captured with notable missing elements
- 60–79 — Most required information present
- 80–100 — Substantial coverage of defined data fields
These ranges are not fixed standards but can help teams decide whether additional data collection or verification may be needed before using the genogram for research or professional documentation.
Example Completeness Score
The following example shows how a genogram completeness score might be calculated using weighted components.
| Component | Score |
|---|---|
| Family Structure Completeness | 32 / 40 |
| Required Field Completion | 23 / 30 |
| Source Documentation | 9 / 15 |
| Certainty Indicators | 6 / 10 |
| Review Status | 3 / 5 |
Total Score: 73 / 100 — Good
This genogram contains most of the required information, but some gaps remain. For example, missing source documentation or uncertain data may reduce confidence in interpretation across cases.
Even when a genogram scores well, it is still important to review the data for consistency, verification, and alignment with the research objectives.
Genogram Data Completeness Scoring Templates
1. Basic Genogram Data Completeness Scoring Template
This simple template works well for individual case reviews or small studies. It helps researchers check whether the essential data fields in a genogram have been captured. Each required data element is marked as completed or missing, making it easy to calculate an overall completeness score.


2. Weighted Genogram Completeness Scoring Template
This template is useful for more structured research projects where different types of data carry different levels of importance.
For example, core family structure information may be weighted more heavily than supporting metadata such as documentation notes or update status.

3. Multi-Case Genogram Dataset Template
This template is designed for large research datasets involving multiple families or case studies.
It allows researchers to compare completeness scores across multiple genograms and quickly identify which cases may require additional data collection or verification.

4. Individual-Level Data Completeness Template
Instead of scoring an entire genogram at once, this template evaluates completeness at the individual level. This approach works well for large family structures where some individuals may have incomplete data.
Researchers can then calculate a family-level completeness score based on the completeness of each individual record.

Using Creately to Build and Review Complete Genograms
Maintaining complete and consistent genogram datasets can be challenging, especially in research settings involving multiple families, evolving records, or collaborative data collection.
Using a structured visual platform like Creately can help researchers capture required information more systematically and review genograms more efficiently when applying completeness scoring methods.
Here are a few ways Creately can support research-ready genogram documentation.
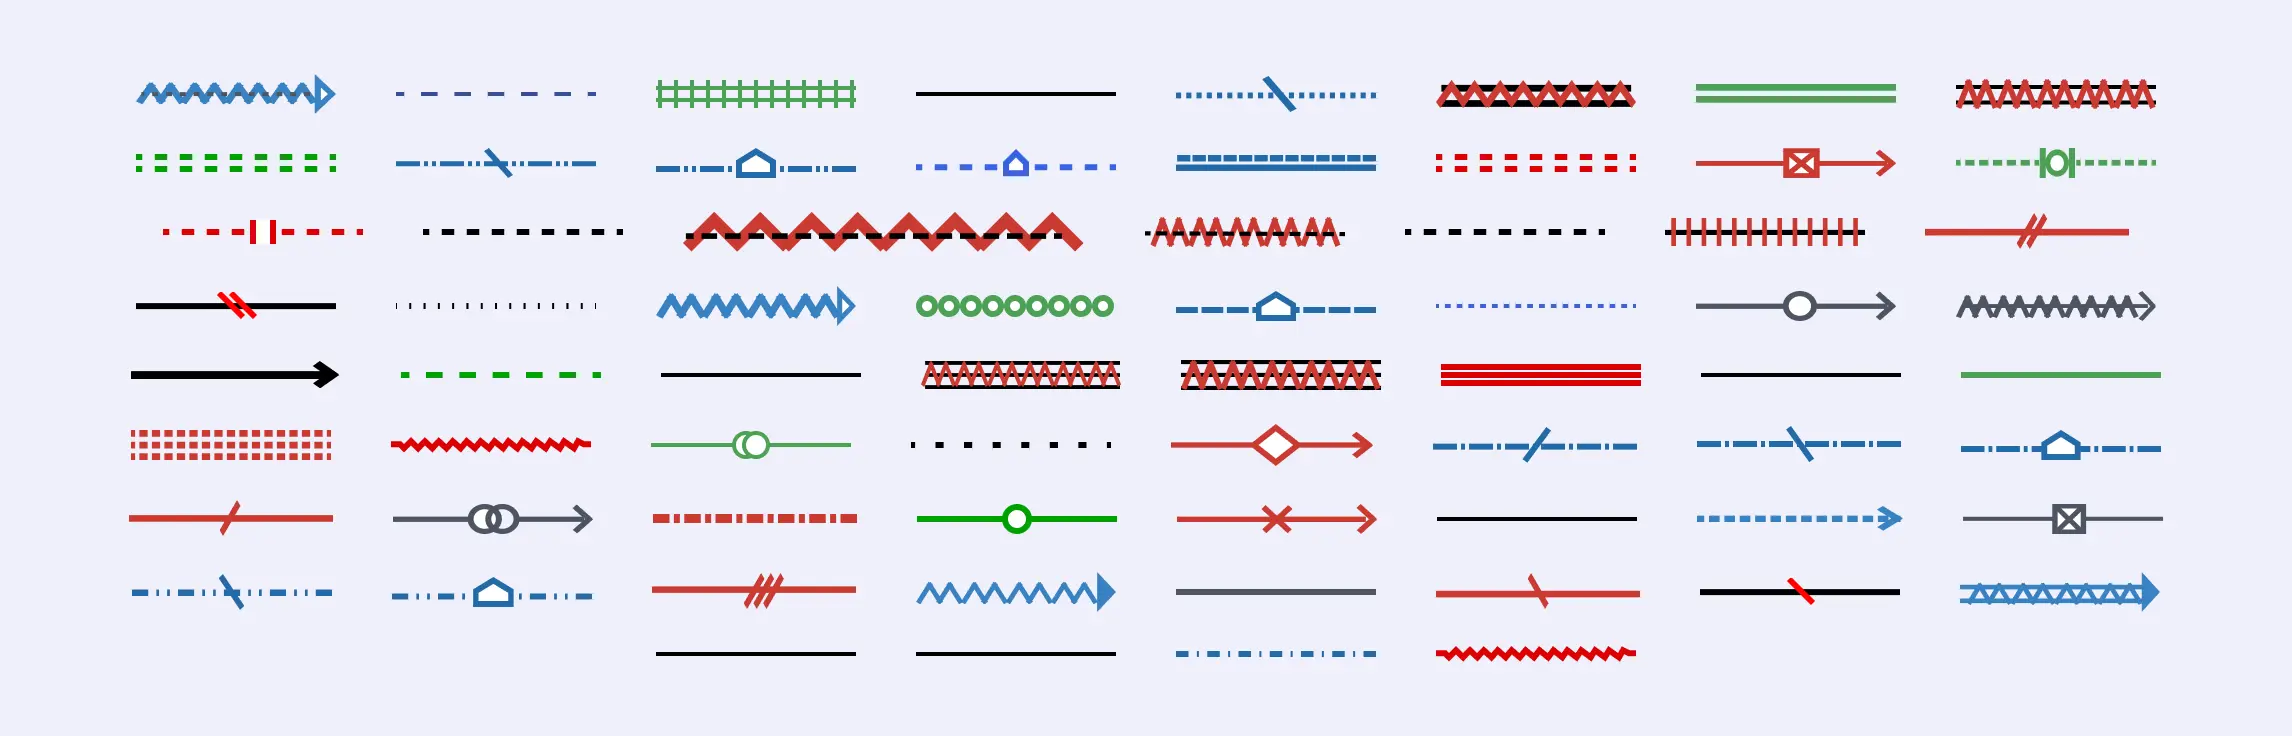
Document Family Relationships Consistently
Creately provides structured relationship notation that can help researchers represent biological, legal, and social connections clearly. This supports family structure completeness, making it easier to confirm that required kinship links and generational relationships have been recorded before scoring the dataset.
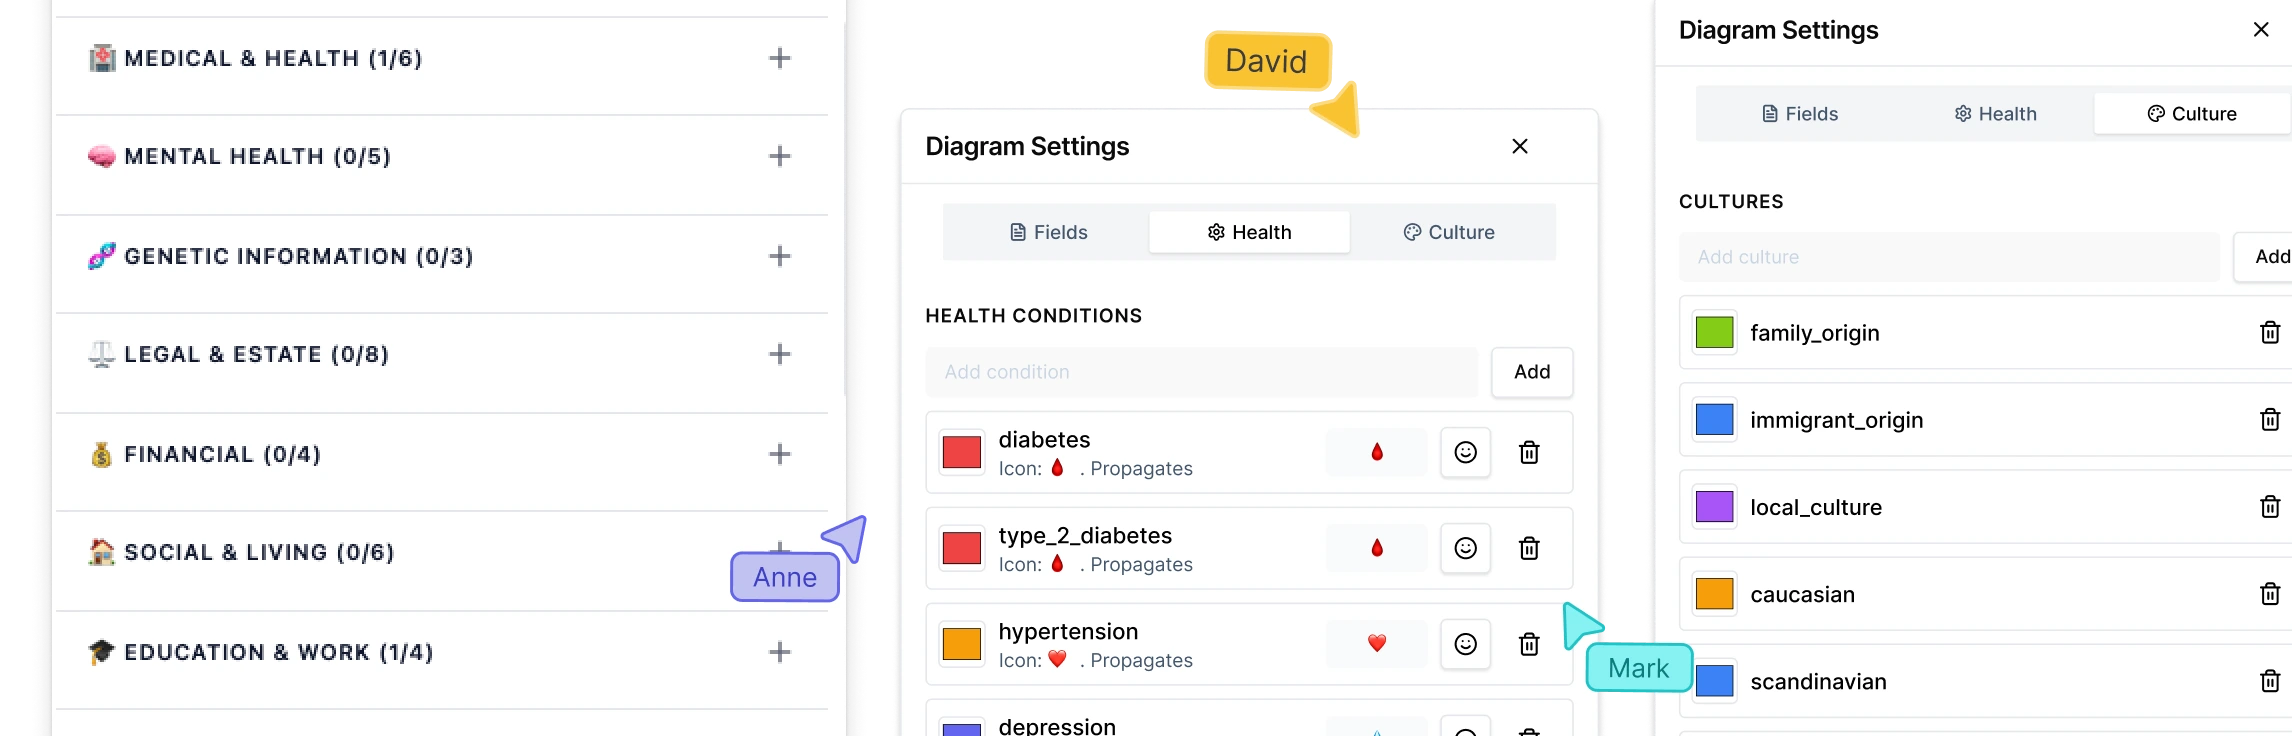
Capture Structured Data Within Each Individual Record
Researchers can attach structured data fields directly to individuals in the genogram. These fields may include demographic variables, study-relevant conditions, legal roles, or research identifiers. This supports required field completeness, allowing teams to check whether essential variables have been captured for each case.
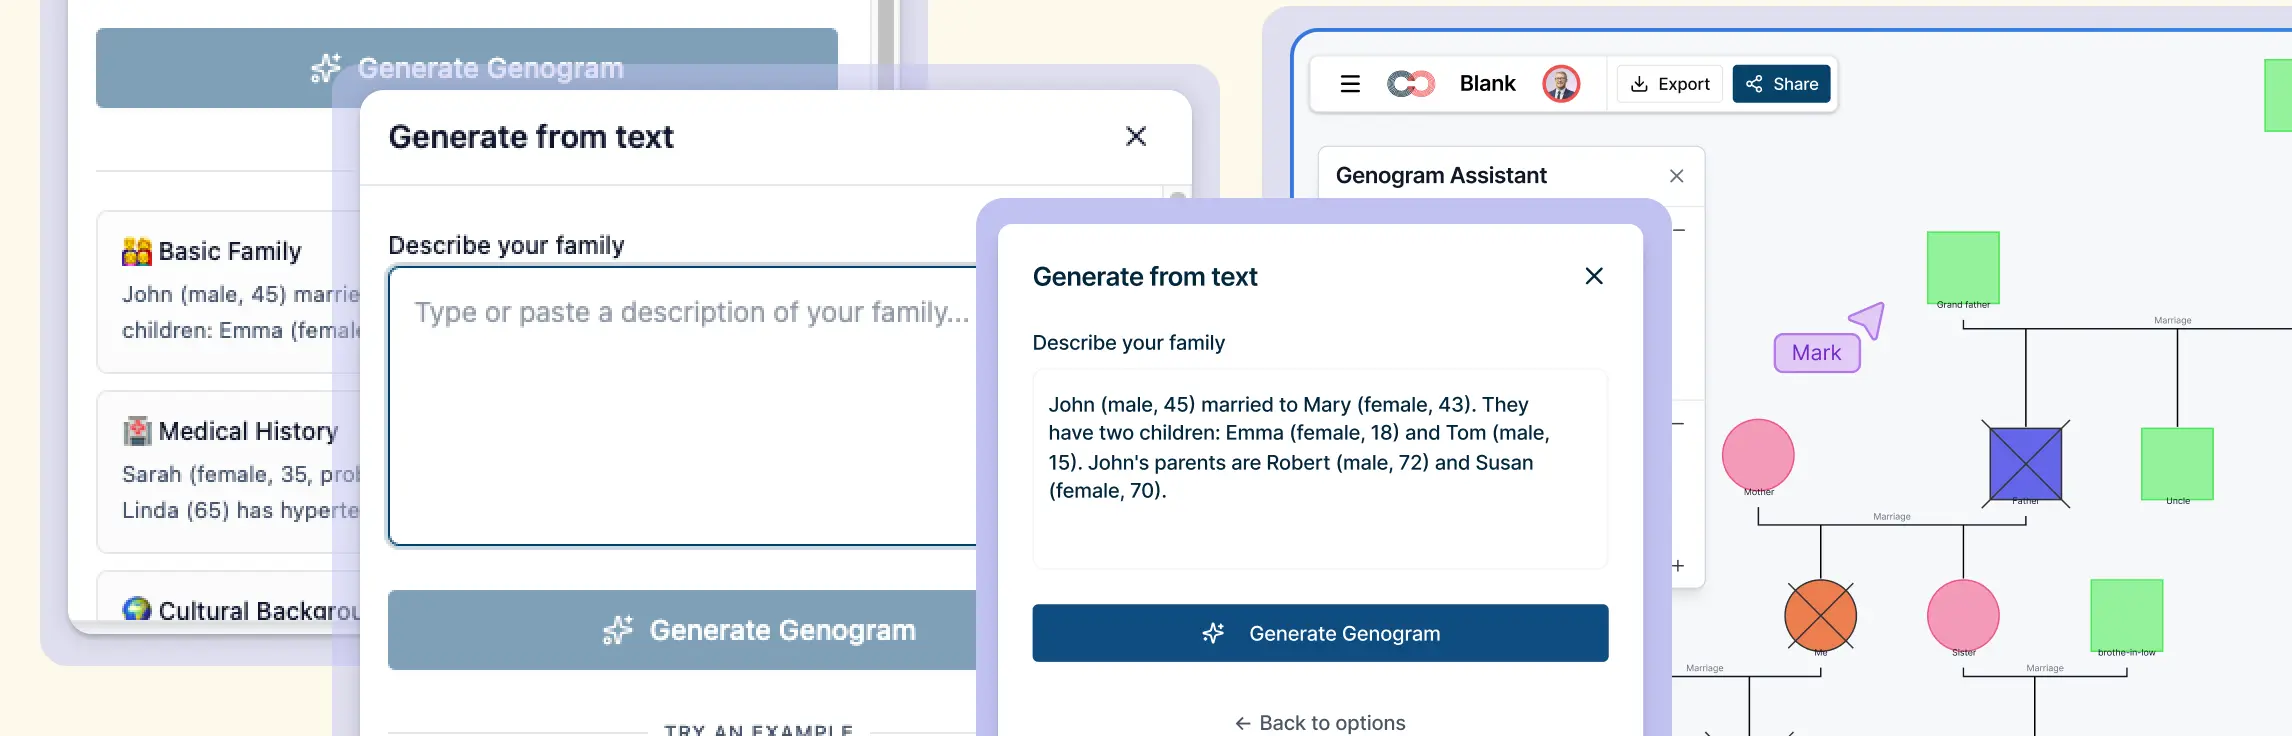
Generate Initial Genograms from Case Notes
Creately’s text-to-genogram capability can help researchers create a baseline family diagram from interview summaries or case descriptions. Establishing an initial structure early in the documentation process supports dataset initialization and completeness review, making it easier to identify missing individuals or relationships.
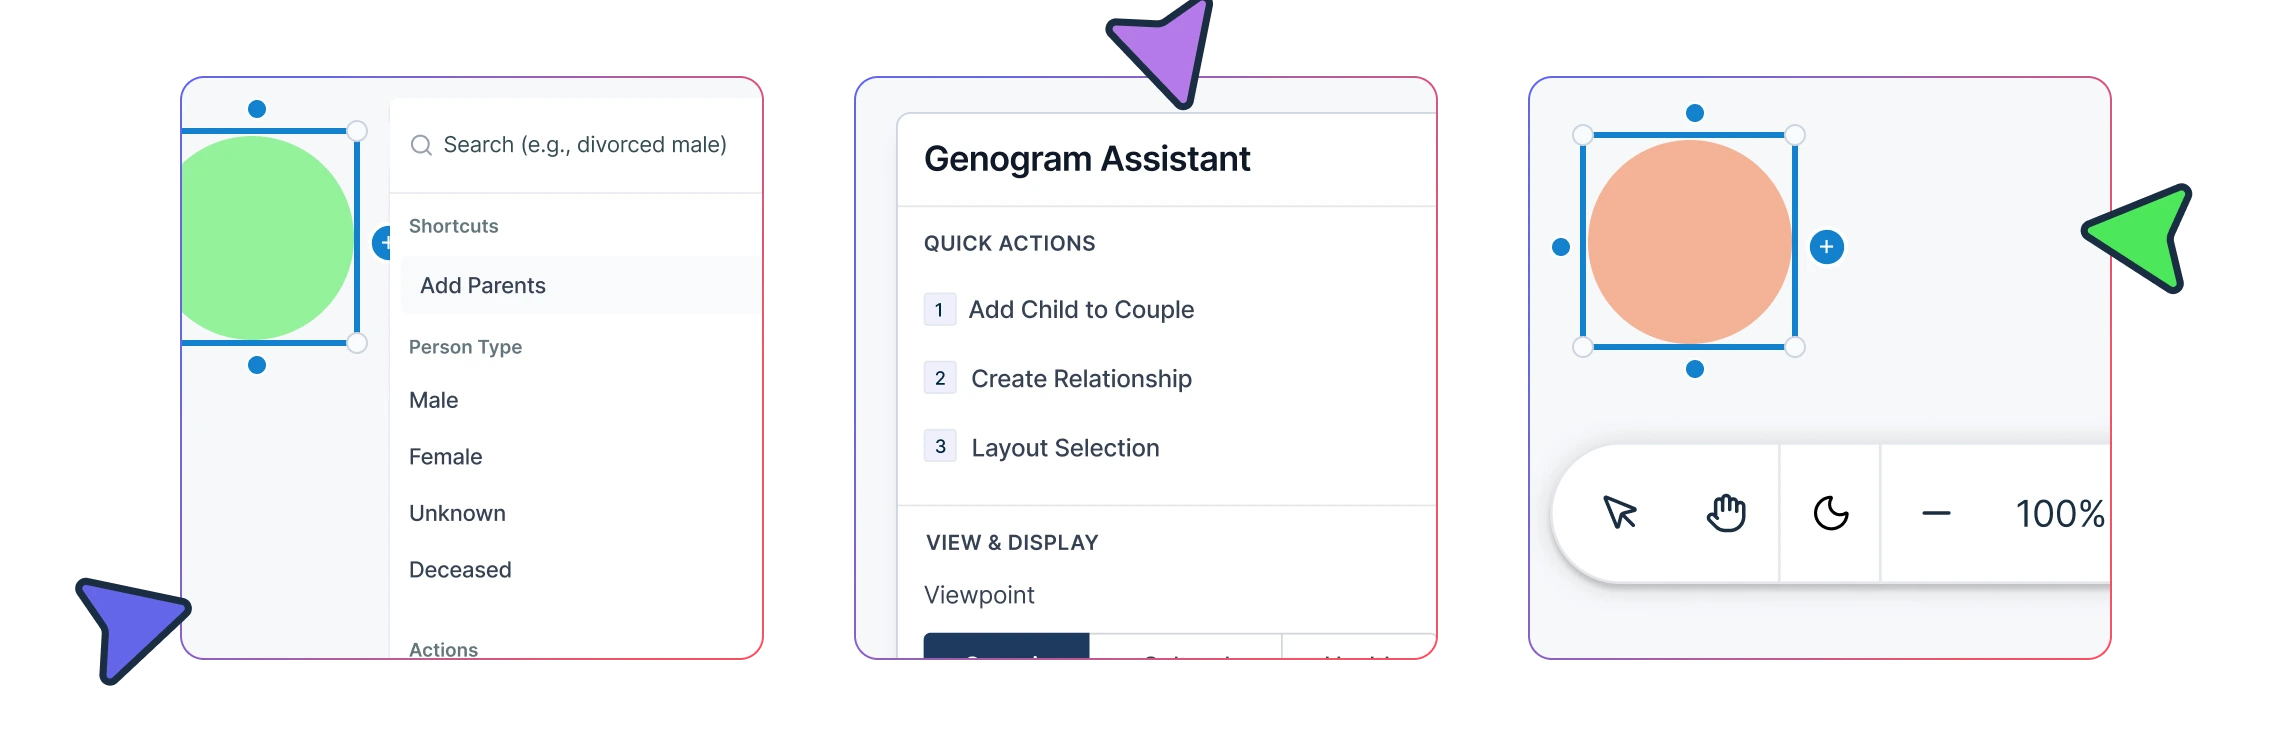
Review Large Multi-Generational Families More Easily
Automatic layout features help maintain readability as genograms expand across generations. This can support structural verification, enabling researchers to scan complex diagrams for gaps such as unrecorded relatives, unclear relationship links, or incomplete branches that may affect completeness scoring.
Support Collaborative Data Review
Shared workspaces allow multiple contributors to review and refine genograms over time. Collaborative review supports update and verification status, helping teams confirm data accuracy, document changes, and maintain more consistent completeness levels across multiple cases.